
Square
Following
Hot
News
Notifications
Profile
Share your thoughts
placeholder
Article
Why are traders more likely to underestimate risk after a winning streak?

A winning streak is naturally something to be happy about.

But in the trading market, getting several calls right in a row can also quietly change the way someone makes decisions.

Some start increasing their position sizes, some loosen their stop-losses, and some think they have figured out how the market works. The risk has not disappeared; recent success has simply made it harder to notice.

I. Why can profits change risk perception?

1. Mistaking short-term success for long-term ability

Several consecutive profita
post-image
🔥【WCTC S9 Second Half Kicks Off】The leaderboard resets, reshuffling the race for the title!

📌 Tonight at 20:00 (UTC+8), join Gate Live to talk about how your team can climb the rankings:
• Can the top teams from the first half stay in the lead? How can new teams seize a chance to make a comeback?
• Which leaderboard best plays to your strengths: platform-wide trading volume, CFD trading volume, or earnings?
• With recent market volatility, how can you keep your trading pace in the second half?

🎁 Two rounds of interactive prize draws
100 USDT position trial vouchers ×3|Gate mice ×3

🎙️ Sp
GateLiveChinese
🔥【WCTC S9 Second Half Kicks Off】The leaderboard resets, reshuffling the race for the title!
📌 Tonight at 20:00 (UTC+8), join Gate Live to talk about how your team can climb the rankings:
• Can the top teams from the first half stay in the lead? How can new teams seize a chance to make a comeback?
• Which leaderboard best plays to your strengths: platform-wide trading volume, CFD trading volume, or earnings?
• With recent market volatility, how can you keep your trading pace in the second half?
🎁 Two rounds of interactive prize draws
100 USDT position trial vouchers ×3|Gate mice ×3
🎙️ Special guests: Eden, @翻仓王, @天才交易员杰哥哥, @币大师稳健持币
🔔 Book in advance and see you in the livestream: https://www.gate.com/live/video/55b0ea48f9e5427dbdebee21a2f713af?type=live

repost-content-media
Trenches
mihao
m
bade
b
mihao
4Cxj...pump
Market Cap
$.
Change
.
24h Vol
$.
Holders
.
HOLD
H
bade
b
HOLD
4iJ7...pump
Market Cap
$.
Change
.
24h Vol
$.
Holders
.
X
X
bade
b
X
9VZe...pump
Market Cap
$.
Change
.
24h Vol
$.
Holders
.
PIEVERSE
P
bade
b
PIEVERSE
0x0e...25a9
Market Cap
$.
Change
.
24h Vol
$.
Holders
.
DacityCoin
D
bade
b
DacityCoin
DKYc...pump
Market Cap
$.
Change
.
24h Vol
$.
Holders
.
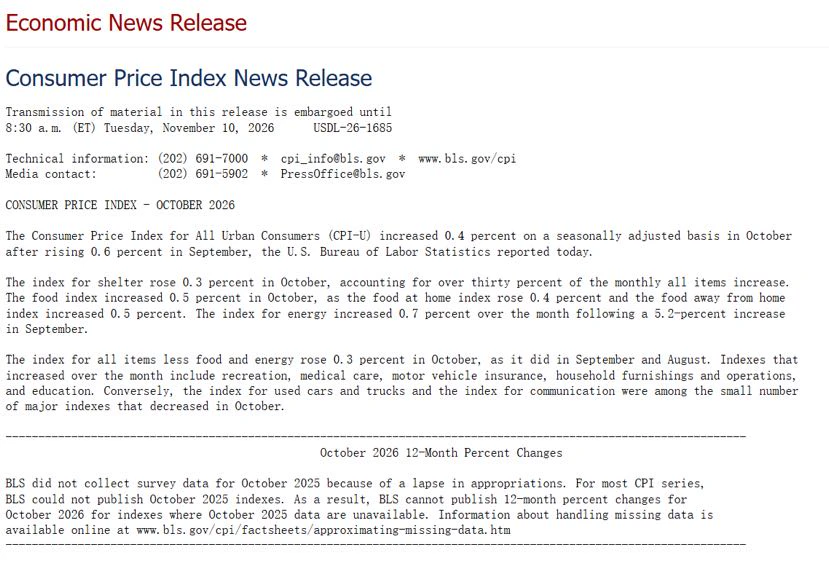
Last night’s CPI poured another bucket of cold water on risk assets😮‍💨

U.S. CPI rose 0.4% month over month in October, above expectations of 0.3%. Core CPI also came in at 0.3%, likewise exceeding expectations;

Although overall inflation slowed compared with September, core inflation has held at 0.3% for three consecutive months, and inflation remains quite stubborn

The market reaction was also immediate: Treasury yields and the U.S. dollar both strengthened, gold $XAU plunged, while $BTC slid all the way to around $72.7k

What I’m paying more attention to this time is expectations for
post-image
XAU+0.38%
  • 9
  • 2
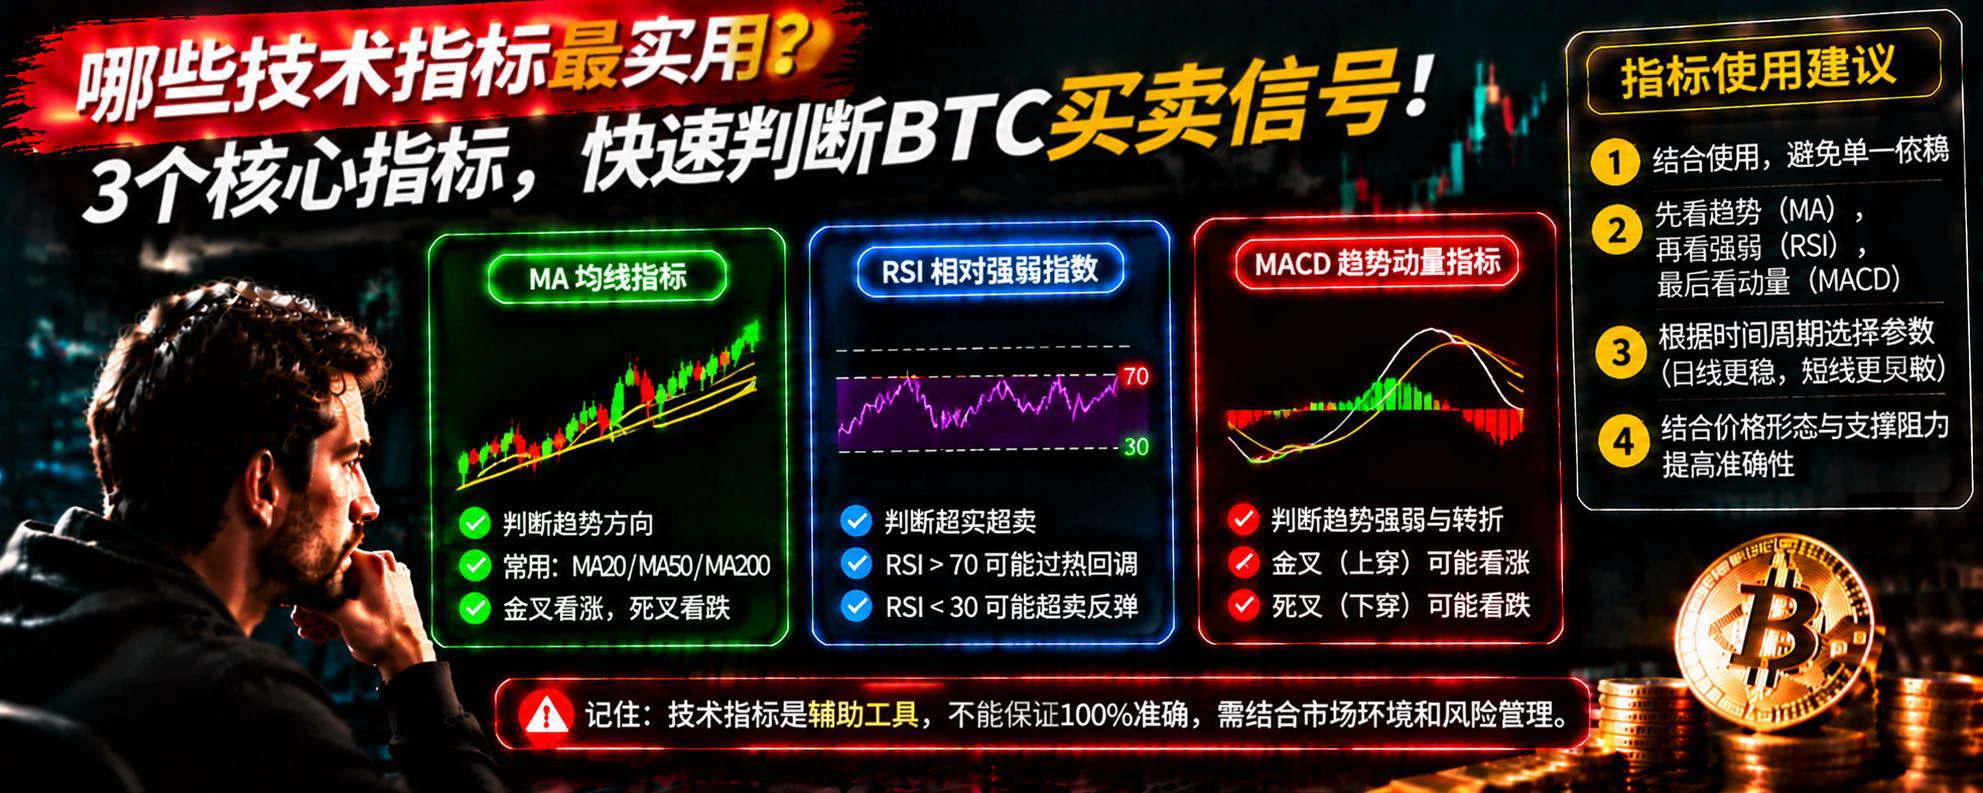
How to Identify Market Trends? Improve Your BTC Trading Win Rate with Trend Analysis
In cryptocurrency trading, many people search every day for the best entry and exit points, but overlook a more fundamental question: What trend is the market currently in?
If you haven't clearly determined the market's direction, even using numerous technical indicators may still lead to repeated bad decisions.
First, learn to identify the three basic market conditions.
First, an uptrend. Prices continue to form higher highs and higher lows, indicating that buyers have the upper hand. In this situation, focus
post-image
BTC-0.67%
Market Analysis: $BTC (2026-11-11)
Looking directly at the daily chart, the market is currently in a sustained decline, and has now broken below support. Although it has held this level in the short term, I think a break below is extremely likely.📉
I wouldn’t consider going long. You can wait for a rebound before entering a short. If a deep V-shaped rebound appears and holds, stopping out of the short then won’t cost too much. But chasing the drop could very likely leave you trapped by a deep V-shaped rebound~
post-image
BTC-0.65%
#BTC
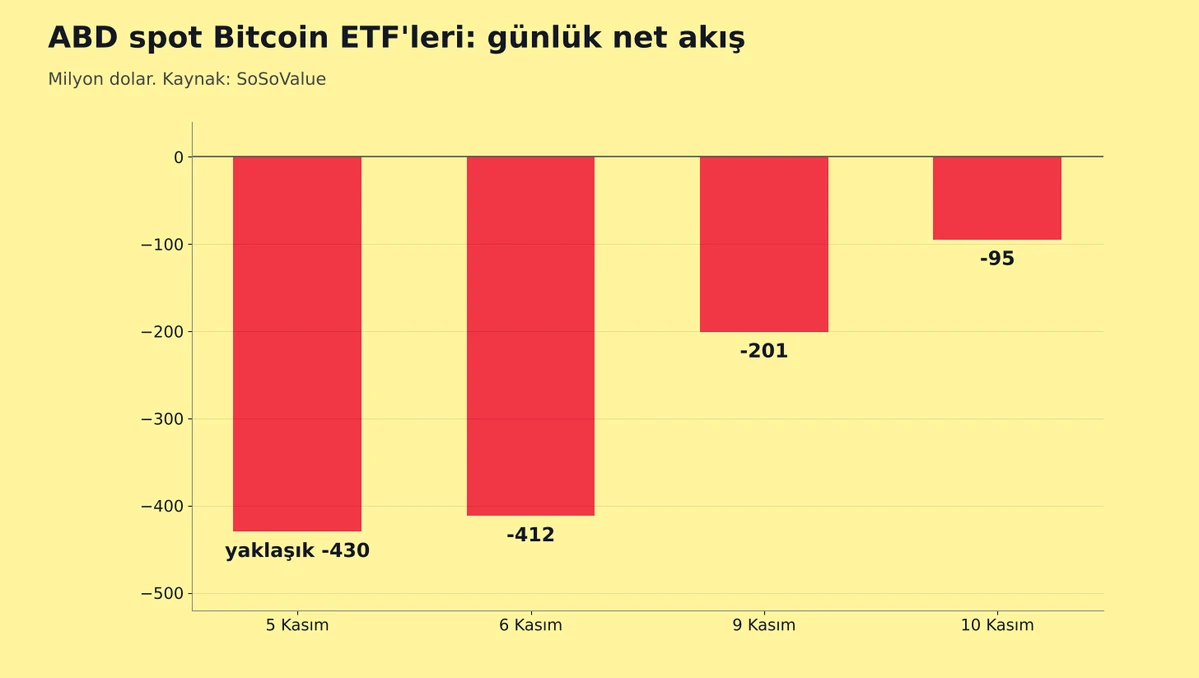
ETF outflows have continued for four days, but are shrinking.
Folks, US spot Bitcoin $BTC ETFs saw net outflows of $95 million yesterday. The outflow streak reached its fourth day.
What stands out is that outflows are declining each day. They were about $430 million on November 5, $412 million on November 6, $201 million on November 9, and $95 million yesterday.
Of yesterday’s outflows, $78 million came from BlackRock’s fund and $37 million from Fidelity’s fund. Morgan Stanley’s fund saw inflows of $20 million.
Total outflows over four days exceeded $1.1 billion. The ETFs’ total assets ar
post-image
BTC-1.45%
BLK+0.59%
MS+0.27%
What Is the Funding Rate, and How Does It Affect Trading?

In crypto futures trading, many people focus only on BTC’s daily price movements while overlooking an important metric: the funding rate.

Sometimes BTC keeps rising, yet traders going long have to keep paying funding fees. Why does this happen?

First, the funding rate is a periodic payment between longs and shorts in the perpetual futures market. Its main purpose is to help keep contract prices close to spot prices.

When the funding rate is positive, it usually means perpetual futures are priced relatively high, and longs pay fundin
post-image
BTC-0.65%
Short setup $BNB
Entry: 708- 750 Stop loss: 763 Take profit: 681 Take profit: 651 Take profit: 601 Uptrend resistance above: Price remains capped below the 99-period EMA (around $688.90), keeping overall short-term momentum tilted to the downside. Trade here $BNB 👇
post-image
BNB-0.76%
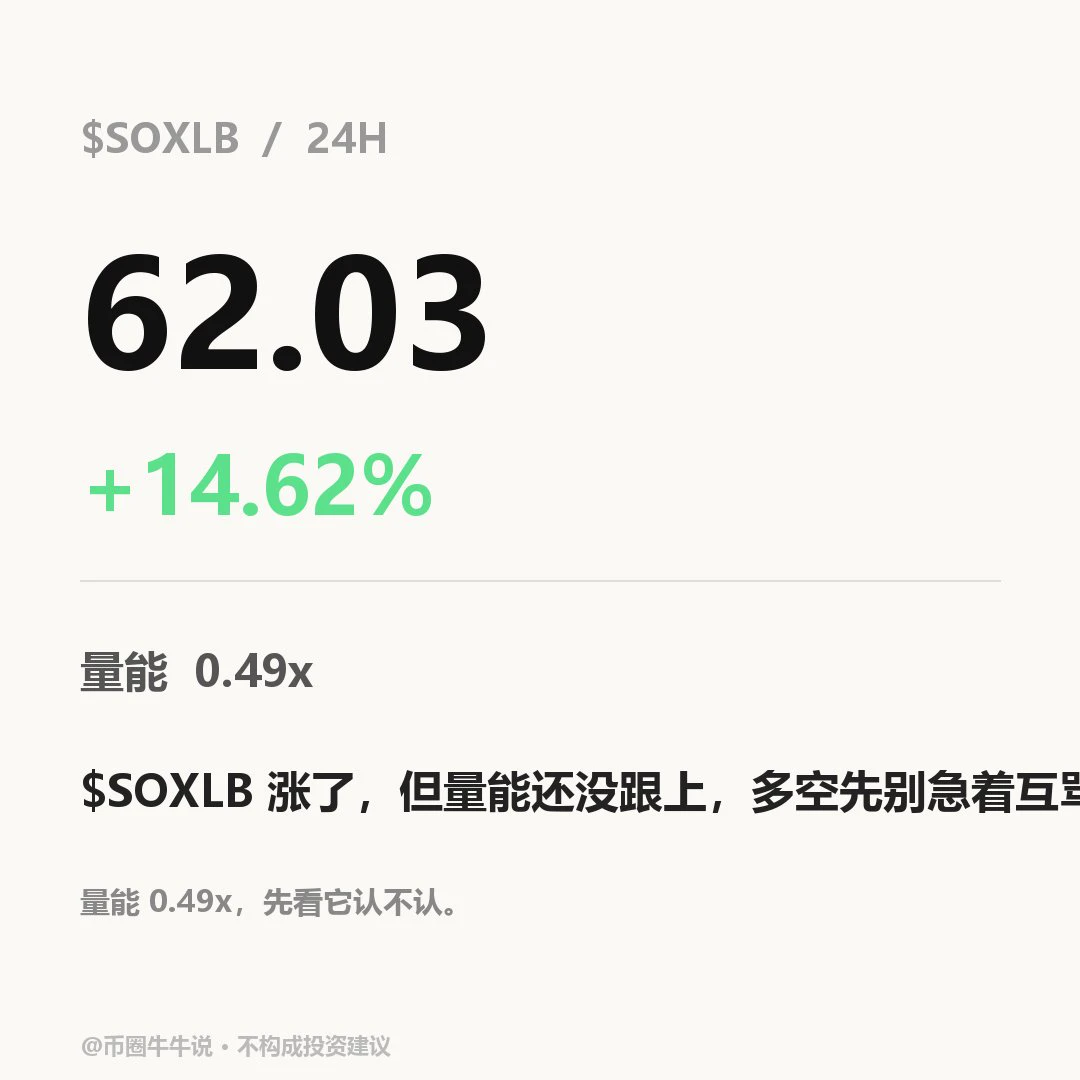
$SOXLB Currently trading at 62.03, up 14.62% over 24H (range 51.01–63.18). The 1H trend is strong, with an RSI of 84; the 4H trend is also strong, with an RSI of 76. If it breaks above 63.18 decisively, watch for further upside; if it falls below the 51.01 support, the short-term structure may weaken. The market is volatile; for observation only.
post-image
#Polymarket年化收入突破18亿美元 $1.8 billion in revenue is real, but the “takeoff” may not land on Polymarket

The prediction market sector is definitely taking off, but Polymarket isn’t necessarily the sure-fire beneficiary.

I. First, separate the two numbers

$1.8 billion is annualized revenue, or about $150 million per month; $14.5 billion is the US site’s nominal trading volume in October. A rough calculation puts the monetization rate around 1%—but note that the figures use different scopes: revenue is global, while the $14.5 billion is only for the US site, so this is just an order-of-magnitude
KALSHI+0.00%
HOOD-2.36%
BTC-0.67%
Afternoon Updates,,,,.....
live-cover
LIVE2,025
After a Losing Streak, How Should You Adjust Your Trading Mindset?
In cryptocurrency trading, a losing streak is when many traders are most likely to lose confidence.
After the first loss, they may think they simply misread the market; after the second, they begin to doubt their strategy. When a losing streak reaches three, five, or even more losses, some may become desperate to win back what they lost.
And that is often where the real danger begins.
Why can a losing streak trap traders in a vicious cycle?
First, losses affect judgment. When someone is eager to recover their losses, they may a
post-image
David Schwartz, former CTO of Ripple, revealed that he had sold almost all of his crypto. By his own estimates, he went from around 26 million XRP to 3 million, from 1,500 BTC to just one, and from 40,000 ETH to only 6.
The reason is simple: he “really hates risk.” He says he and his wife agreed that he would sell whenever a new all-time high was reached. He also hasn't bought XRP in a long time.
Still a member of Ripple’s board of directors, he nevertheless remains convinced of XRP’s potential. In his view, it is hard to imagine a world where the XRP Ledger succeeds without XRP capturing a si
post-image
XRP-1.15%
BTC-0.67%
ETH-1.26%
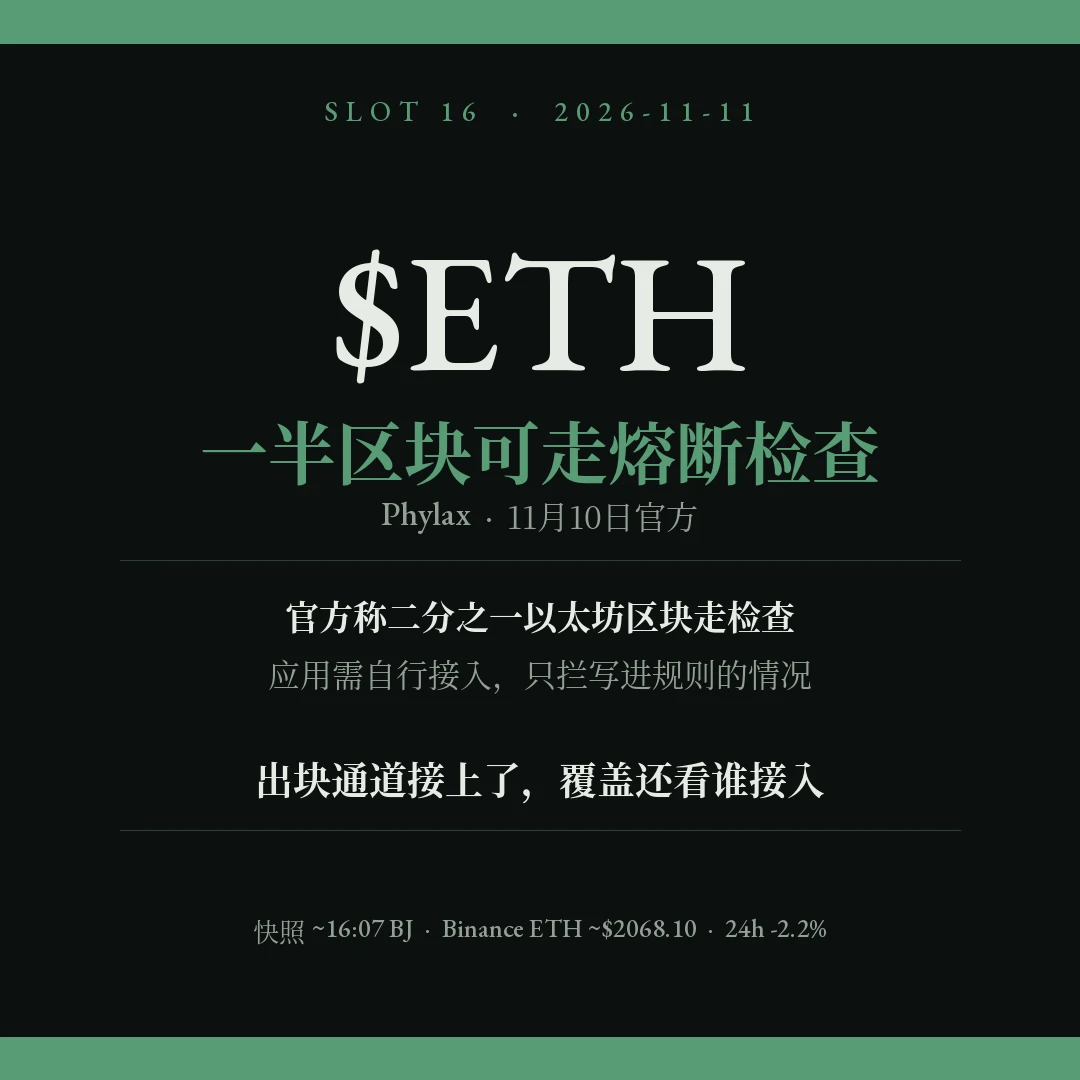
Just reading the headline, it’s easy to hear “half of blocks are protected” and assume the entire chain is now much less likely to have problems. Let’s look at what actually happened.
On November 10, security project Phylax Systems officially announced a partnership with Titan Builder, which produces a large share of Ethereum blocks, to bring circuit-breaker rules to mainnet. Apps can define actions that must not occur, and Titan removes violating transactions while assembling blocks so they don’t settle on-chain. The announcement states that half of Ethereum blocks today will undergo these ch
post-image
ETH-1.26%
$DOGE Is this dog coin not suitable for futures trading? Yesterday it looked like it was in unrealized profit, but today it's in unrealized loss. It seems like everyone else opened their positions in spot
post-image
DOGE-0.18%
CRYPTO MARKET
live-cover
LIVE2,157
What Is Volume-Price Divergence? How Can You Spot a Trend Reversal Early?
In cryptocurrency trading, many people watch candlestick charts every day and assume that an uptrend will continue when they see prices repeatedly hitting new highs.
But sometimes, a warning sign has already appeared: prices are still rising, while trading volume and technical indicators are starting to weaken.
This is what traders often call volume-price divergence.
What is volume-price divergence?
Simply put, it is a mismatch between price movements and trading volume or momentum indicators.
For example, in an uptrend,
post-image
BTC-0.67%
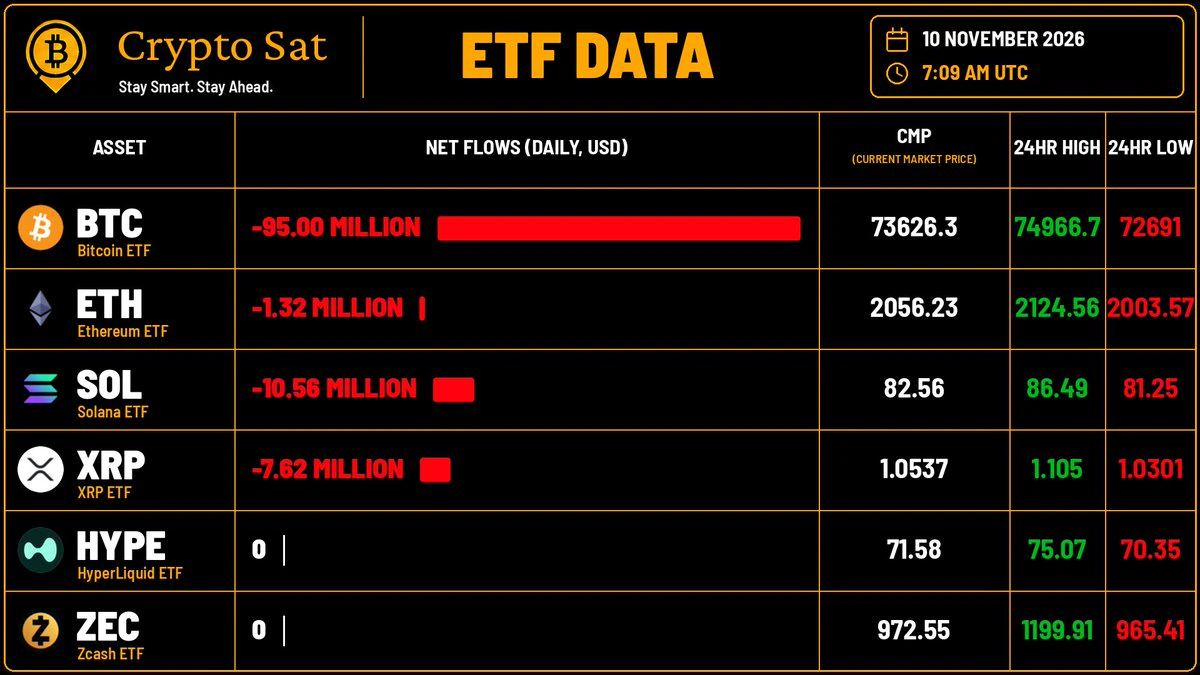
ETF Flows Update (10 November 2026)
• $BTC : -$95.00 Million
• $ETH : -$1.32 Million
• $XRP : -$7.62 Million
• $SOL : -$10.56 Million
• $HYPE : $0
• $ZEC : $0
Bitcoin ETF recorded outflows of $95.00M on November 10. Ethereum posted a modest outflow of $1.32M, Solana saw outflows of $10.56M, XRP saw outflows of $7.62M, while Hyperliquid and ZEC remained flat.
post-image
BTC-1.45%
ETH-3.30%
  • 9
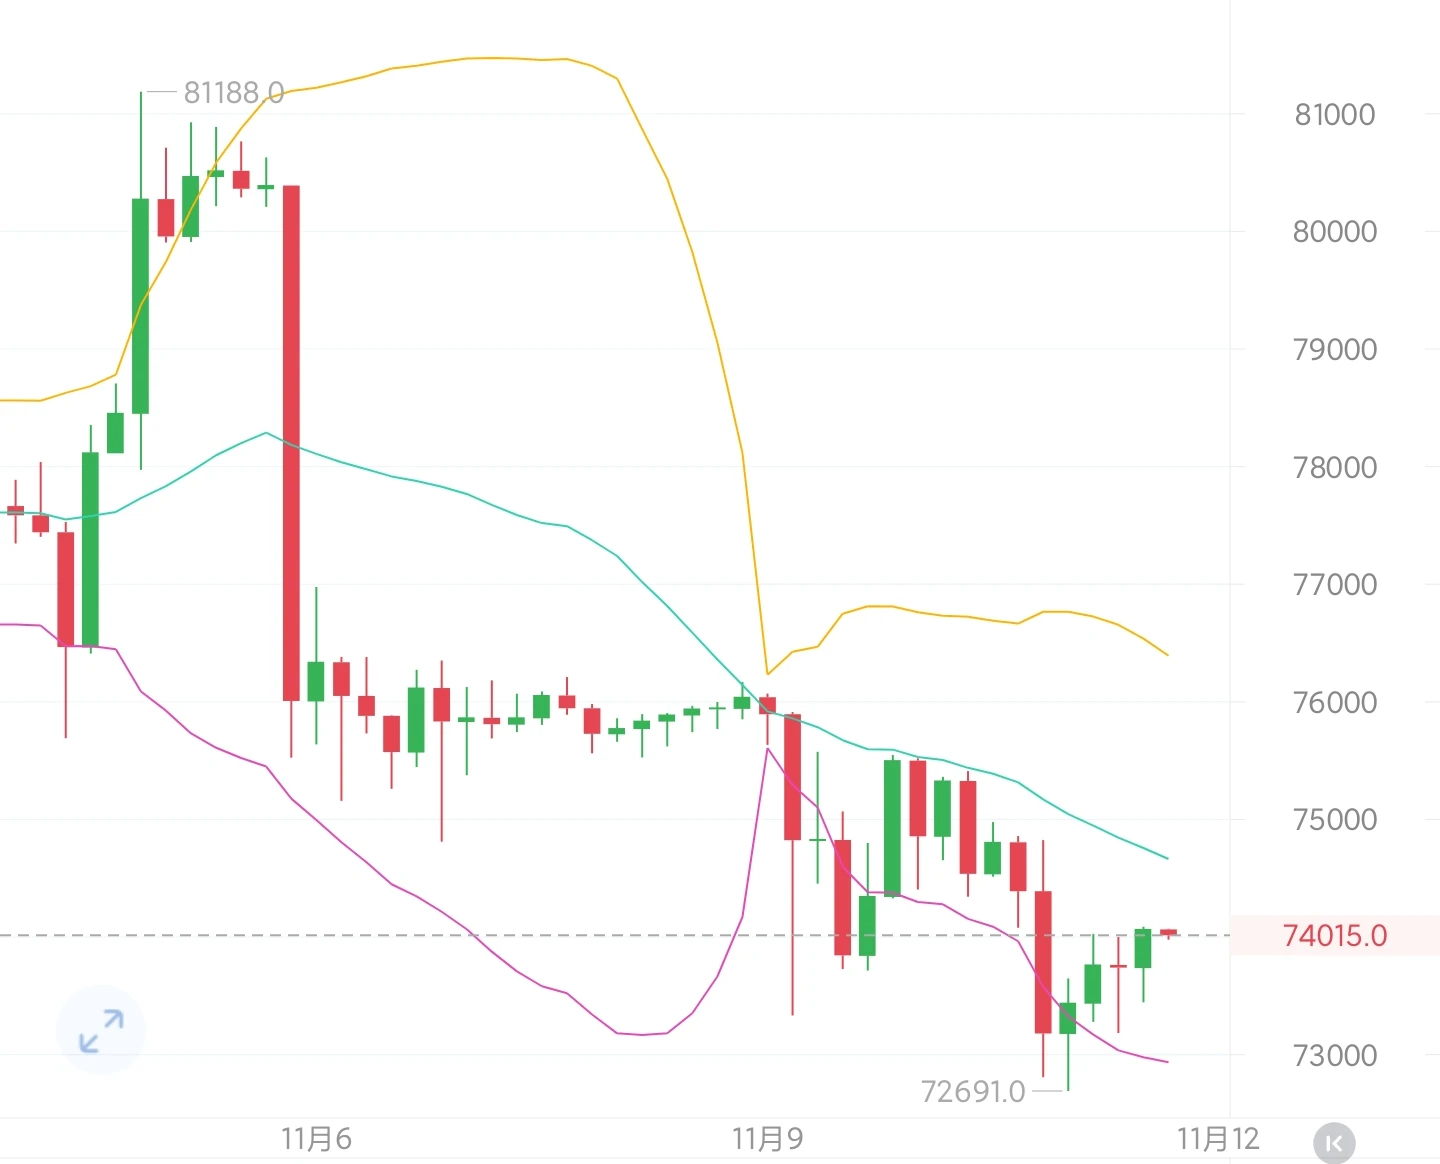
BTC’s larger chart structure remains bearish on the daily timeframe. The Bollinger Bands are opening downward, bearish MACD momentum continues to build, and price is clearly under pressure.

On the 4-hour chart, price continues to trade below the Bollinger midline, with every rebound met by selling pressure—a typical bearish continuation pattern.

The 1-hour chart shows only a slight indicator recovery, with KDJ edging up. This is merely a brief relief bounce within a downtrend; volume is not following through, there is no basis for a reversal, and upside is limited.

BTC may face resistance n
post-image
BTC-0.67%
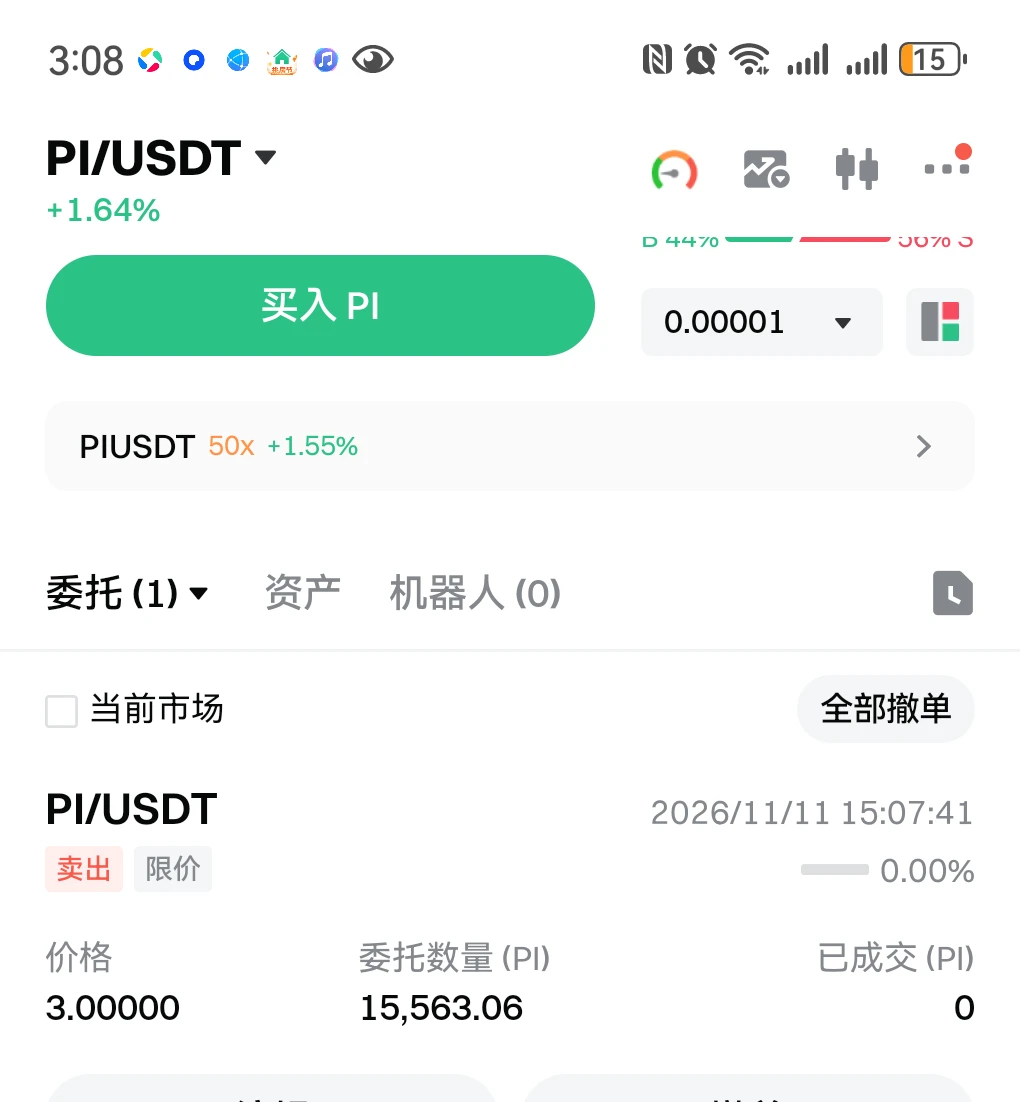
$PI List it for 3u—asking to break even isn't too much, right?
post-image
PI-0.60%
  • 5
Load More

Join 40 M users in our growing community

⚡️ Join 40 M users in the crypto craze discussion

💬 Engage with your favorite top creators

👍 See what interests you

Trending Topics

GateGlobalComplianceExpansion

15.43k Views342 Discussing

Gate continues to expand its global compliance footprint, now covering 81 regulated jurisdictions across Europe, North America, Asia, and Oceania. From MiCA and U.S. state-level MTLs to Japan’s FSA, Dubai, and Australia-related regulatory approvals, global exchanges are entering a new stage of compliance competition. Do you think regulatory strength will become as important as products and liquidity for exchanges in the future?

USOctoberCPIBeatsExpectations

85.78k Views2.61k Discussing

AnthropicIPOValuationCouldReach1.4T

11.72k Views1.6k Discussing

View More