

#ShareWeekly #PlanYourTradesThisWeek
##USSeptemberJobs29K
RELATÓRIO DE EMPREGOS DE SETEMBRO ACABA DE MUDAR O CENÁRIO DO MERCADO
O relatório de empregos dos EUA de setembro provocou um grande choque nos mercados.
Os empregos não agrícolas aumentaram apenas 29.000, contra expectativas próximas de 90.000, enquanto a taxa de desemprego subiu de 4,1% para 4,2%.
Os empregos de agosto também foram revisados para baixo, de 162.000 para 133.000, enquanto as revisões dos dois meses anteriores eliminaram cerca de 60.000 empregos. Os ganhos médios por hora aumentaram apenas 0,1% na comparação mensal e 3,0% na comparação anual, mostrando que tanto o crescimento do emprego quanto o impulso dos salários estão perdendo força.
À primeira vista, este parecia exatamente o tipo de relatório que os otimistas de cripto queriam. Um mercado de trabalho mais fraco reduz a pressão imediata por um aperto monetário adicional, o que inicialmente empurrou os rendimentos dos Treasuries para baixo, enfraqueceu o dólar e elevou os ativos de risco.
O Bitcoin rapidamente subiu acima de US$ 87.000, enquanto o ouro avançou acentuadamente em direção a US$ 4.223. Mas a reação não durou, e essa reversão é muito mais importante do que o salto inicial.
OS RENDIMENTOS DOS TREASURIES AINDA SÃO O MAIOR SINAL PARA AS CRIPTOMOEDAS
O rendimento dos Treasuries de 10 anos inicialmente caiu cerca de oito pontos-base após o relatório de empregos, recuando para perto de 5,15%, mas depois se recuperou para perto de 5,21%. O rendimento dos títulos de 2 anos também reverteu sua queda inicial e avançou para perto de 4,82%, enquanto o rendimento dos títulos de 30 anos permaneceu em torno de 5,62%.
Isso nos mostra que os mercados não estão interpretando o relatório de empregos fraco como o fim do problema da inflação.
Para Bitcoin e Ethereum, essa distinção é fundamental. Um mercado de trabalho mais fraco é otimista quando produz rendimentos menores e expectativas de uma política monetária mais branda. No entanto, se a inflação continuar persistente e os rendimentos dos Treasuries de longo prazo permanecerem acima de 5%, os ativos de risco ainda enfrentarão uma forte concorrência da renda fixa. É por isso que o rali inicial do Bitcoin após o relatório de empregos perdeu força tão rapidamente.
BITCOIN: A FAIXA ESTÁ CLARA
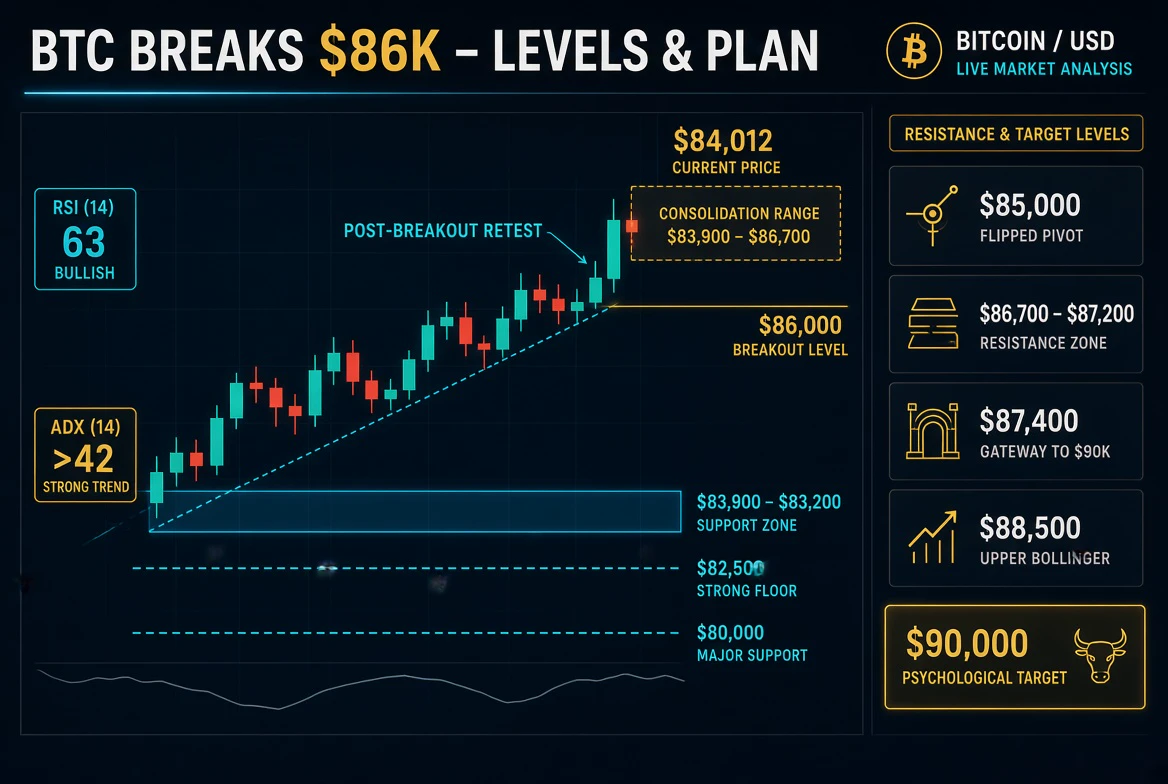
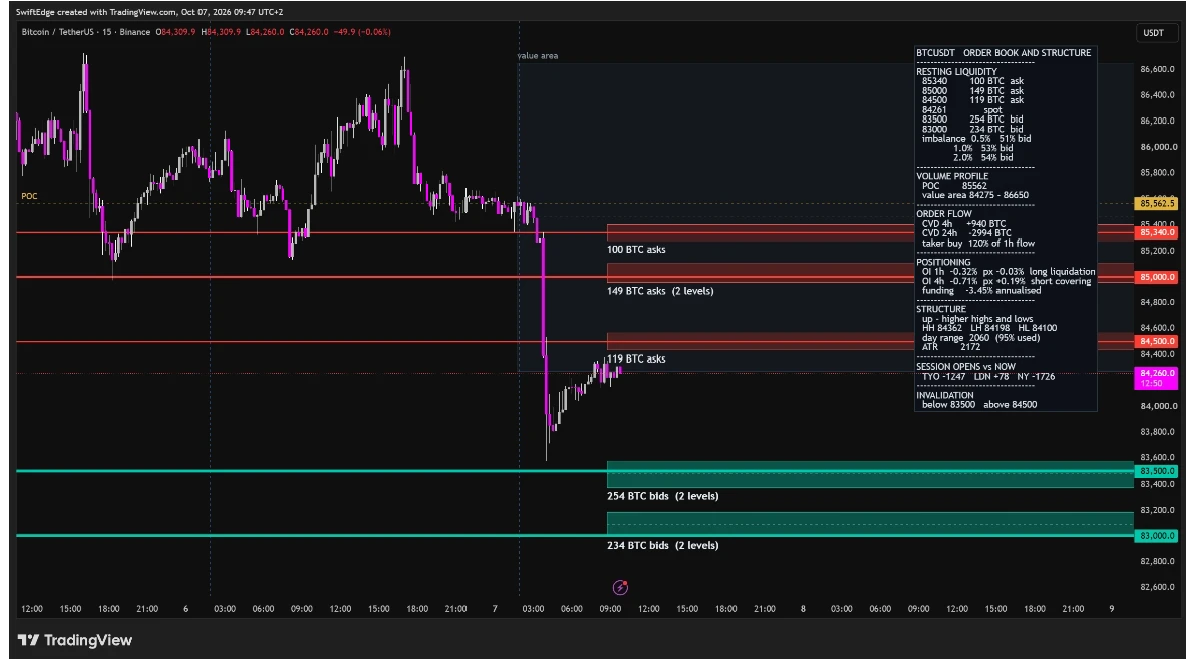
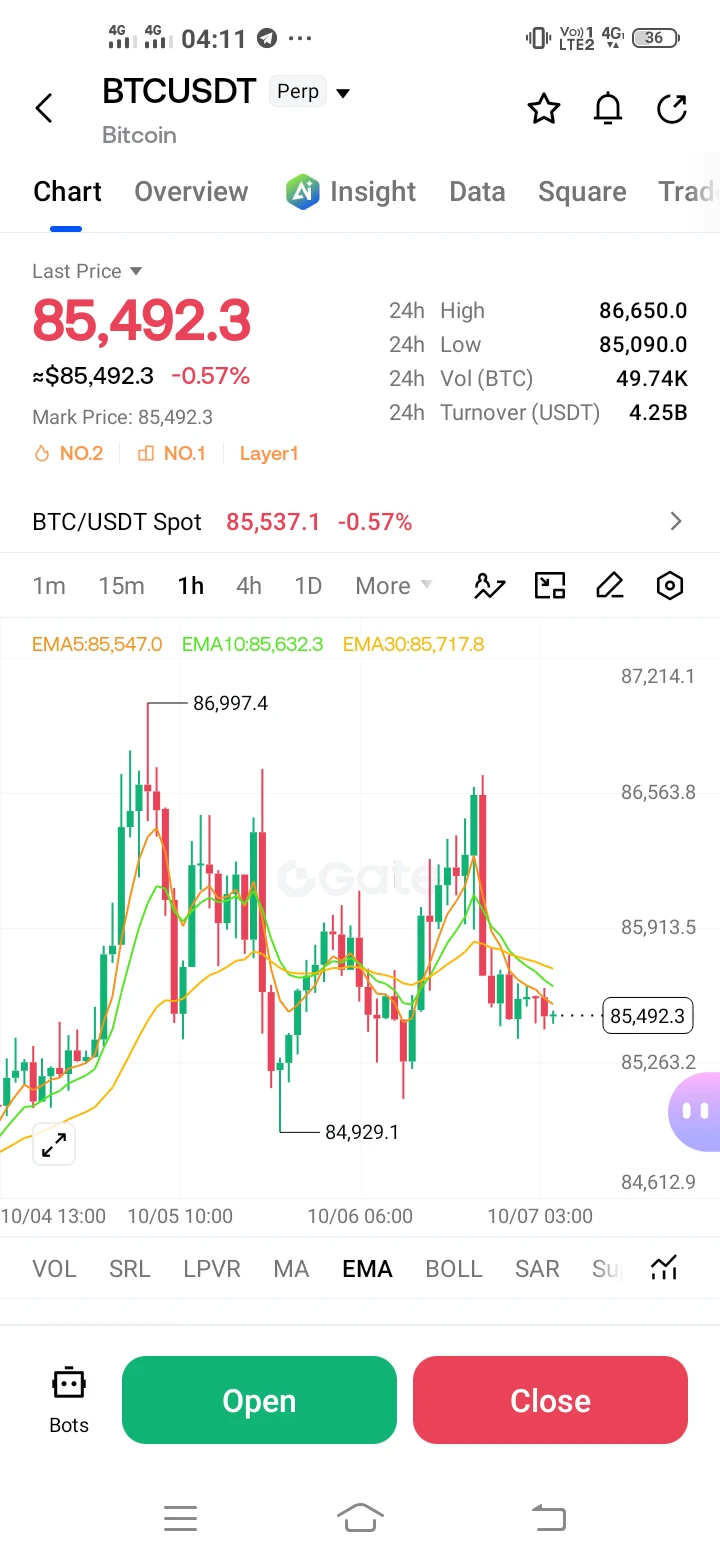
O Bitcoin está sendo negociado atualmente em torno de US$ 84.000, após atingir uma máxima intradiária próxima de US$ 86.700 e cair para perto de US$ 83.585. A estrutura de curto prazo continua lateralizada, com a faixa de US$ 83.500–83.800 atuando como a primeira zona importante de suporte.
Se o Bitcoin perder US$ 83.500 com forte pressão vendedora, o próximo suporte importante estará próximo de US$ 82.000. Essa região se torna particularmente importante porque uma ruptura enfraqueceria a estrutura atual e aumentaria a probabilidade de uma correção mais profunda.
No lado positivo, US$ 85.300–85.500 é a primeira zona de resistência. Acima disso, US$ 86.700–87.500 é a principal área de rompimento. Um fechamento diário decisivo acima de US$ 87.500 fortaleceria a estrutura otimista e poderia abrir caminho para US$ 90.000.
Minha visão de trading, portanto, é simples: eu não perseguiria o Bitcoin no meio da faixa. Abaixo de US$ 83.500, o risco aumenta significativamente, enquanto uma recuperação confirmada de US$ 87.500 proporcionaria um sinal de impulso muito mais forte. A região de US$ 82.000–83.000 continua sendo a zona de queda mais interessante para os compradores, desde que a estrutura do mercado se estabilize ali.
ETHEREUM ESTÁ MOSTRANDO MAIS FRAQUEZA
O Ethereum está apresentando desempenho inferior ao Bitcoin e permanece próximo da região de US$ 2.600. A faixa de US$ 2.590–2.610 é a região de suporte imediato, enquanto US$ 2.680–2.700 é a primeira área importante de recuperação.
Um movimento acima de US$ 2.700 melhoraria a estrutura de curto prazo, enquanto uma recuperação de US$ 2.725–2.760 proporcionaria uma confirmação mais forte de que os compradores estão retornando. Por outro lado, uma ruptura clara abaixo de US$ 2.590 poderia expor a região de US$ 2.570 e sinalizar uma fraqueza relativa contínua em relação ao Bitcoin.
Isso é importante para o mercado de altcoins como um todo. Até que o Ethereum comece a recuperar suas médias móveis e mostre um desempenho relativo mais forte, eu trataria os ralis agressivos de altcoins com cautela. O Bitcoin continua sendo a expressão mais forte do risco cripto, enquanto o ETH ainda tenta se estabilizar.
O FED AINDA É O PRINCIPAL FATOR
O relatório fraco de empregos reduziu acentuadamente as expectativas de um aumento imediato dos juros em outubro. Antes do relatório, os mercados atribuíam probabilidades consideravelmente maiores a outro aumento, mas essas expectativas desabaram após os dados de emprego.
No entanto, os traders não devem confundir expectativas menores de aumento dos juros em outubro com um Federal Reserve totalmente dovish.
A inflação continua sendo o problema.
O CPI de agosto aumentou 0,4% na comparação mensal e 3,4% na comparação anual, enquanto o PPI veio consideravelmente mais quente, a 5,4% na comparação anual. Os preços da energia e as pressões geopolíticas continuam criando riscos inflacionários adicionais.
Isso significa que o Fed pode receber um relatório de emprego fraco e ainda assim permanecer cauteloso. O banco central precisa equilibrar duas forças opostas: um mercado de trabalho em desaceleração e uma inflação persistente. Até que a inflação caia claramente, o mercado não poderá precificar com confiança um ciclo de afrouxamento duradouro.
CPI E PPI AGORA SÃO OS VERDADEIROS CATALISADORES
O próximo grande teste do mercado virá dos dados de inflação. O CPI de setembro está programado para 14 de outubro e o PPI de setembro para 15 de outubro. Esses dados poderão determinar se a atual faixa do Bitcoin romperá para cima ou para baixo.
Se o CPI e o PPI vierem mais quentes do que o esperado, os rendimentos dos Treasuries poderão subir novamente, o dólar poderá se fortalecer e o Bitcoin poderá testar novamente US$ 83.500 ou até US$ 82.000. Isso reforçaria a narrativa de juros elevados por mais tempo.
Se a inflação vier mais baixa, o cenário oposto se torna possível. Os rendimentos dos Treasuries poderão voltar a cair abaixo de 5%, as expectativas de um aperto adicional poderão enfraquecer e o Bitcoin poderá receber o impulso de liquidez necessário para desafiar US$ 87.500 e, eventualmente, US$ 90.000.
O CENÁRIO MAIS AMPLO DO MERCADO
As ações continuam surpreendentemente resilientes apesar dos rendimentos elevados. O S&P 500 e o Nasdaq ainda estão sendo negociados próximos de níveis recordes, fortemente apoiados pelo ciclo de investimentos em IA.
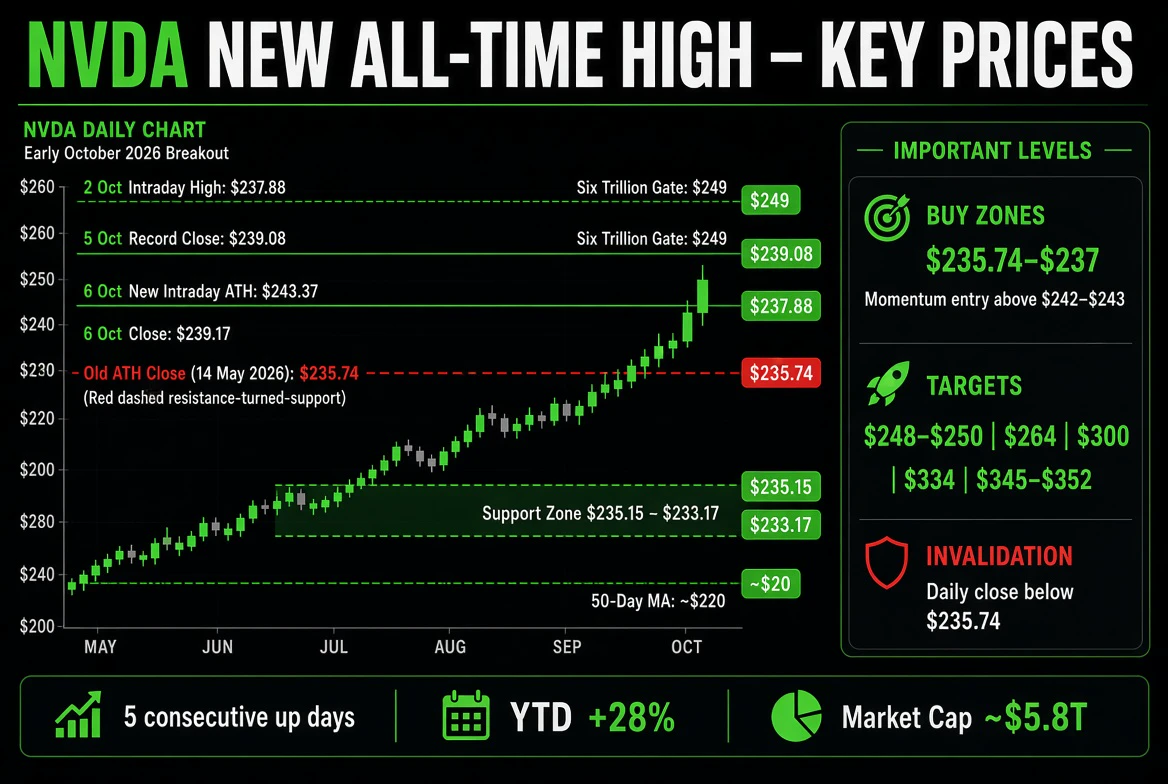
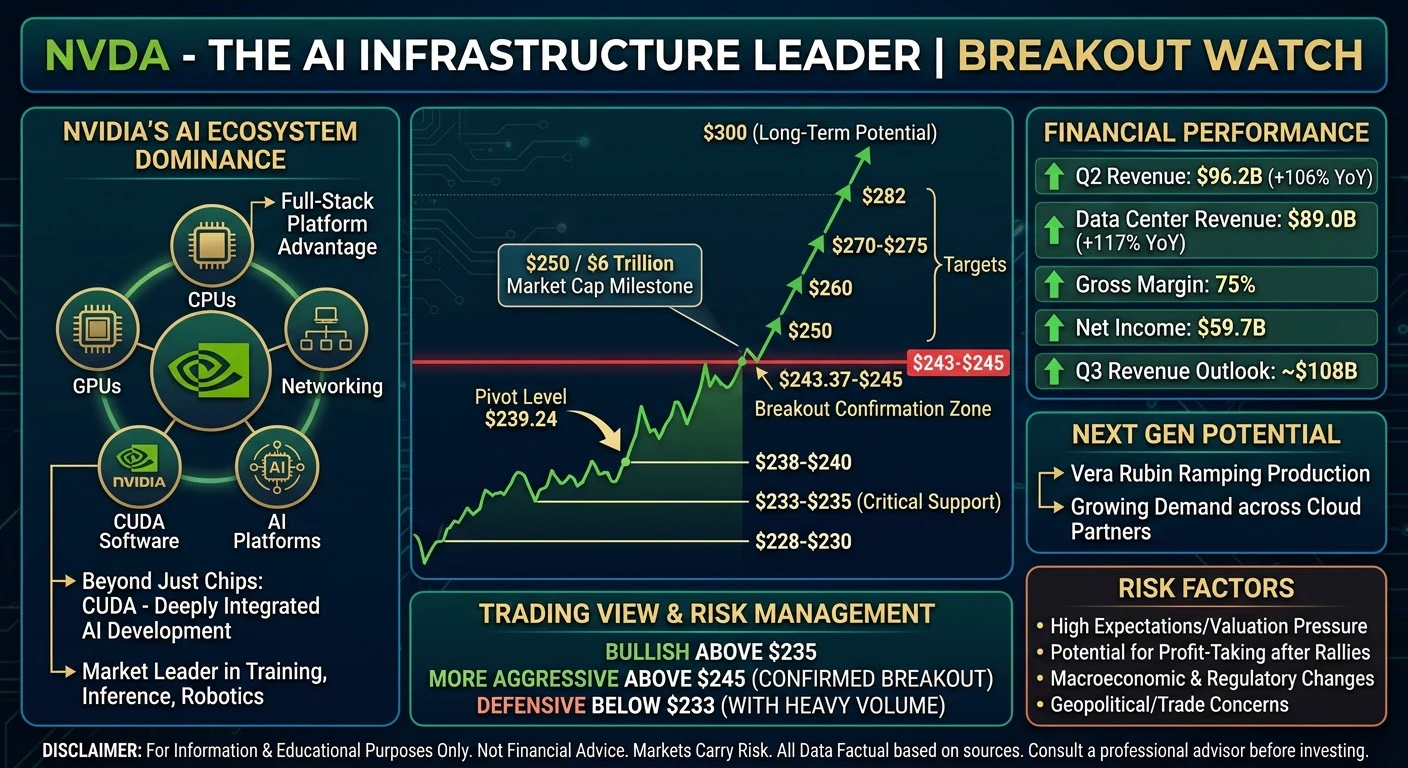
A Nvidia avançou para novas máximas, enquanto o setor de memória continua sendo um dos temas mais fortes, porque a infraestrutura de IA continua sustentando a demanda por memórias avançadas.
O ouro também está enviando um sinal importante. Ele avançou acentuadamente após o relatório de empregos e sustentou seus ganhos melhor do que o Bitcoin. Essa divergência mostra que os investidores ainda tratam o ouro como um ativo defensivo tradicional, enquanto o Bitcoin continua se comportando mais como um ativo de risco de beta elevado, que precisa de condições favoráveis de liquidez.
Para os traders de cripto, isso significa que o gráfico mais importante talvez não seja o do BTC. Observe o rendimento dos Treasuries de 10 anos. Se os rendimentos permanecerem acima de 5%, o Bitcoin poderá ter dificuldade para estabelecer um rompimento sustentado. Se os rendimentos caírem decisivamente abaixo de 5% enquanto as expectativas de inflação também recuarem, o ambiente se tornará muito mais favorável para BTC, ETH e para o mercado cripto como um todo.
MINHA VISÃO ATUAL DE TRADING
Meu cenário-base é de uma postura otimista neutra a cautelosa, desde que o Bitcoin mantenha a região de suporte de US$ 83.500–82.000. Eu me tornaria significativamente mais otimista após um rompimento e fechamento confirmados acima de US$ 87.500, pois isso invalidaria grande parte da estrutura atual da faixa e criaria um caminho potencial para US$ 90.000.
Abaixo de US$ 82.000, no entanto, a configuração otimista se torna consideravelmente mais fraca e o mercado poderia entrar em uma correção mais profunda.
Para o Ethereum, US$ 2.590–2.610 é a zona de defesa principal, enquanto US$ 2.700 e depois US$ 2.725–2.760 são os níveis que os otimistas precisam recuperar.
O relatório de empregos de setembro mudou a narrativa do Fed no curto prazo, mas não encerrou a história da inflação.
O próximo grande movimento do Bitcoin provavelmente dependerá da combinação entre os rendimentos dos Treasuries, CPI, PPI e as expectativas para o Fed, e não apenas do relatório de emprego.
Por enquanto, o mercado permanece preso entre um mercado de trabalho em desaceleração, que apoia uma política mais branda, e uma inflação persistente, que mantém os rendimentos elevados. Essa tensão está criando a volatilidade atual, e o próximo grande rompimento provavelmente ocorrerá quando um dos lados finalmente vencer.
#OneGateWitnessProgram
##USSeptemberJobs29K
RELATÓRIO DE EMPREGOS DE SETEMBRO ACABA DE MUDAR O CENÁRIO DO MERCADO
O relatório de empregos dos EUA de setembro provocou um grande choque nos mercados.
Os empregos não agrícolas aumentaram apenas 29.000, contra expectativas próximas de 90.000, enquanto a taxa de desemprego subiu de 4,1% para 4,2%.
Os empregos de agosto também foram revisados para baixo, de 162.000 para 133.000, enquanto as revisões dos dois meses anteriores eliminaram cerca de 60.000 empregos. Os ganhos médios por hora aumentaram apenas 0,1% na comparação mensal e 3,0% na comparação anual, mostrando que tanto o crescimento do emprego quanto o impulso dos salários estão perdendo força.
À primeira vista, este parecia exatamente o tipo de relatório que os otimistas de cripto queriam. Um mercado de trabalho mais fraco reduz a pressão imediata por um aperto monetário adicional, o que inicialmente empurrou os rendimentos dos Treasuries para baixo, enfraqueceu o dólar e elevou os ativos de risco.
O Bitcoin rapidamente subiu acima de US$ 87.000, enquanto o ouro avançou acentuadamente em direção a US$ 4.223. Mas a reação não durou, e essa reversão é muito mais importante do que o salto inicial.
OS RENDIMENTOS DOS TREASURIES AINDA SÃO O MAIOR SINAL PARA AS CRIPTOMOEDAS
O rendimento dos Treasuries de 10 anos inicialmente caiu cerca de oito pontos-base após o relatório de empregos, recuando para perto de 5,15%, mas depois se recuperou para perto de 5,21%. O rendimento dos títulos de 2 anos também reverteu sua queda inicial e avançou para perto de 4,82%, enquanto o rendimento dos títulos de 30 anos permaneceu em torno de 5,62%.
Isso nos mostra que os mercados não estão interpretando o relatório de empregos fraco como o fim do problema da inflação.
Para Bitcoin e Ethereum, essa distinção é fundamental. Um mercado de trabalho mais fraco é otimista quando produz rendimentos menores e expectativas de uma política monetária mais branda. No entanto, se a inflação continuar persistente e os rendimentos dos Treasuries de longo prazo permanecerem acima de 5%, os ativos de risco ainda enfrentarão uma forte concorrência da renda fixa. É por isso que o rali inicial do Bitcoin após o relatório de empregos perdeu força tão rapidamente.
BITCOIN: A FAIXA ESTÁ CLARA
O Bitcoin está sendo negociado atualmente em torno de US$ 84.000, após atingir uma máxima intradiária próxima de US$ 86.700 e cair para perto de US$ 83.585. A estrutura de curto prazo continua lateralizada, com a faixa de US$ 83.500–83.800 atuando como a primeira zona importante de suporte.
Se o Bitcoin perder US$ 83.500 com forte pressão vendedora, o próximo suporte importante estará próximo de US$ 82.000. Essa região se torna particularmente importante porque uma ruptura enfraqueceria a estrutura atual e aumentaria a probabilidade de uma correção mais profunda.
No lado positivo, US$ 85.300–85.500 é a primeira zona de resistência. Acima disso, US$ 86.700–87.500 é a principal área de rompimento. Um fechamento diário decisivo acima de US$ 87.500 fortaleceria a estrutura otimista e poderia abrir caminho para US$ 90.000.
Minha visão de trading, portanto, é simples: eu não perseguiria o Bitcoin no meio da faixa. Abaixo de US$ 83.500, o risco aumenta significativamente, enquanto uma recuperação confirmada de US$ 87.500 proporcionaria um sinal de impulso muito mais forte. A região de US$ 82.000–83.000 continua sendo a zona de queda mais interessante para os compradores, desde que a estrutura do mercado se estabilize ali.
ETHEREUM ESTÁ MOSTRANDO MAIS FRAQUEZA
O Ethereum está apresentando desempenho inferior ao Bitcoin e permanece próximo da região de US$ 2.600. A faixa de US$ 2.590–2.610 é a região de suporte imediato, enquanto US$ 2.680–2.700 é a primeira área importante de recuperação.
Um movimento acima de US$ 2.700 melhoraria a estrutura de curto prazo, enquanto uma recuperação de US$ 2.725–2.760 proporcionaria uma confirmação mais forte de que os compradores estão retornando. Por outro lado, uma ruptura clara abaixo de US$ 2.590 poderia expor a região de US$ 2.570 e sinalizar uma fraqueza relativa contínua em relação ao Bitcoin.
Isso é importante para o mercado de altcoins como um todo. Até que o Ethereum comece a recuperar suas médias móveis e mostre um desempenho relativo mais forte, eu trataria os ralis agressivos de altcoins com cautela. O Bitcoin continua sendo a expressão mais forte do risco cripto, enquanto o ETH ainda tenta se estabilizar.
O FED AINDA É O PRINCIPAL FATOR
O relatório fraco de empregos reduziu acentuadamente as expectativas de um aumento imediato dos juros em outubro. Antes do relatório, os mercados atribuíam probabilidades consideravelmente maiores a outro aumento, mas essas expectativas desabaram após os dados de emprego.
No entanto, os traders não devem confundir expectativas menores de aumento dos juros em outubro com um Federal Reserve totalmente dovish.
A inflação continua sendo o problema.
O CPI de agosto aumentou 0,4% na comparação mensal e 3,4% na comparação anual, enquanto o PPI veio consideravelmente mais quente, a 5,4% na comparação anual. Os preços da energia e as pressões geopolíticas continuam criando riscos inflacionários adicionais.
Isso significa que o Fed pode receber um relatório de emprego fraco e ainda assim permanecer cauteloso. O banco central precisa equilibrar duas forças opostas: um mercado de trabalho em desaceleração e uma inflação persistente. Até que a inflação caia claramente, o mercado não poderá precificar com confiança um ciclo de afrouxamento duradouro.
CPI E PPI AGORA SÃO OS VERDADEIROS CATALISADORES
O próximo grande teste do mercado virá dos dados de inflação. O CPI de setembro está programado para 14 de outubro e o PPI de setembro para 15 de outubro. Esses dados poderão determinar se a atual faixa do Bitcoin romperá para cima ou para baixo.
Se o CPI e o PPI vierem mais quentes do que o esperado, os rendimentos dos Treasuries poderão subir novamente, o dólar poderá se fortalecer e o Bitcoin poderá testar novamente US$ 83.500 ou até US$ 82.000. Isso reforçaria a narrativa de juros elevados por mais tempo.
Se a inflação vier mais baixa, o cenário oposto se torna possível. Os rendimentos dos Treasuries poderão voltar a cair abaixo de 5%, as expectativas de um aperto adicional poderão enfraquecer e o Bitcoin poderá receber o impulso de liquidez necessário para desafiar US$ 87.500 e, eventualmente, US$ 90.000.
O CENÁRIO MAIS AMPLO DO MERCADO
As ações continuam surpreendentemente resilientes apesar dos rendimentos elevados. O S&P 500 e o Nasdaq ainda estão sendo negociados próximos de níveis recordes, fortemente apoiados pelo ciclo de investimentos em IA.
A Nvidia avançou para novas máximas, enquanto o setor de memória continua sendo um dos temas mais fortes, porque a infraestrutura de IA continua sustentando a demanda por memórias avançadas.
O ouro também está enviando um sinal importante. Ele avançou acentuadamente após o relatório de empregos e sustentou seus ganhos melhor do que o Bitcoin. Essa divergência mostra que os investidores ainda tratam o ouro como um ativo defensivo tradicional, enquanto o Bitcoin continua se comportando mais como um ativo de risco de beta elevado, que precisa de condições favoráveis de liquidez.
Para os traders de cripto, isso significa que o gráfico mais importante talvez não seja o do BTC. Observe o rendimento dos Treasuries de 10 anos. Se os rendimentos permanecerem acima de 5%, o Bitcoin poderá ter dificuldade para estabelecer um rompimento sustentado. Se os rendimentos caírem decisivamente abaixo de 5% enquanto as expectativas de inflação também recuarem, o ambiente se tornará muito mais favorável para BTC, ETH e para o mercado cripto como um todo.
MINHA VISÃO ATUAL DE TRADING
Meu cenário-base é de uma postura otimista neutra a cautelosa, desde que o Bitcoin mantenha a região de suporte de US$ 83.500–82.000. Eu me tornaria significativamente mais otimista após um rompimento e fechamento confirmados acima de US$ 87.500, pois isso invalidaria grande parte da estrutura atual da faixa e criaria um caminho potencial para US$ 90.000.
Abaixo de US$ 82.000, no entanto, a configuração otimista se torna consideravelmente mais fraca e o mercado poderia entrar em uma correção mais profunda.
Para o Ethereum, US$ 2.590–2.610 é a zona de defesa principal, enquanto US$ 2.700 e depois US$ 2.725–2.760 são os níveis que os otimistas precisam recuperar.
O relatório de empregos de setembro mudou a narrativa do Fed no curto prazo, mas não encerrou a história da inflação.
O próximo grande movimento do Bitcoin provavelmente dependerá da combinação entre os rendimentos dos Treasuries, CPI, PPI e as expectativas para o Fed, e não apenas do relatório de emprego.
Por enquanto, o mercado permanece preso entre um mercado de trabalho em desaceleração, que apoia uma política mais branda, e uma inflação persistente, que mantém os rendimentos elevados. Essa tensão está criando a volatilidade atual, e o próximo grande rompimento provavelmente ocorrerá quando um dos lados finalmente vencer.
#OneGateWitnessProgram