
Square
Following
Hot
News
Notifications
Profile
Share your thoughts
placeholder
Article
BTC ETFs bleed continuously, $870 million evaporates! Has Bitcoin's bull market engine stalled?

The Bitcoin market has recently seen a major capital retreat. U.S. spot BTC ETFs recorded cumulative net outflows of nearly $870 million this week, and institutional buying that once seemed unstoppable now appears to have suddenly gone quiet.
It’s like a party where institutions once lined up to get in, but now some are leaving early. The question is, is the party really over?
From a capital-flow perspective, sustained ETF outflows can indeed weaken incremental buying in the spot market. If selling
NVDA+2.80%
  • 12
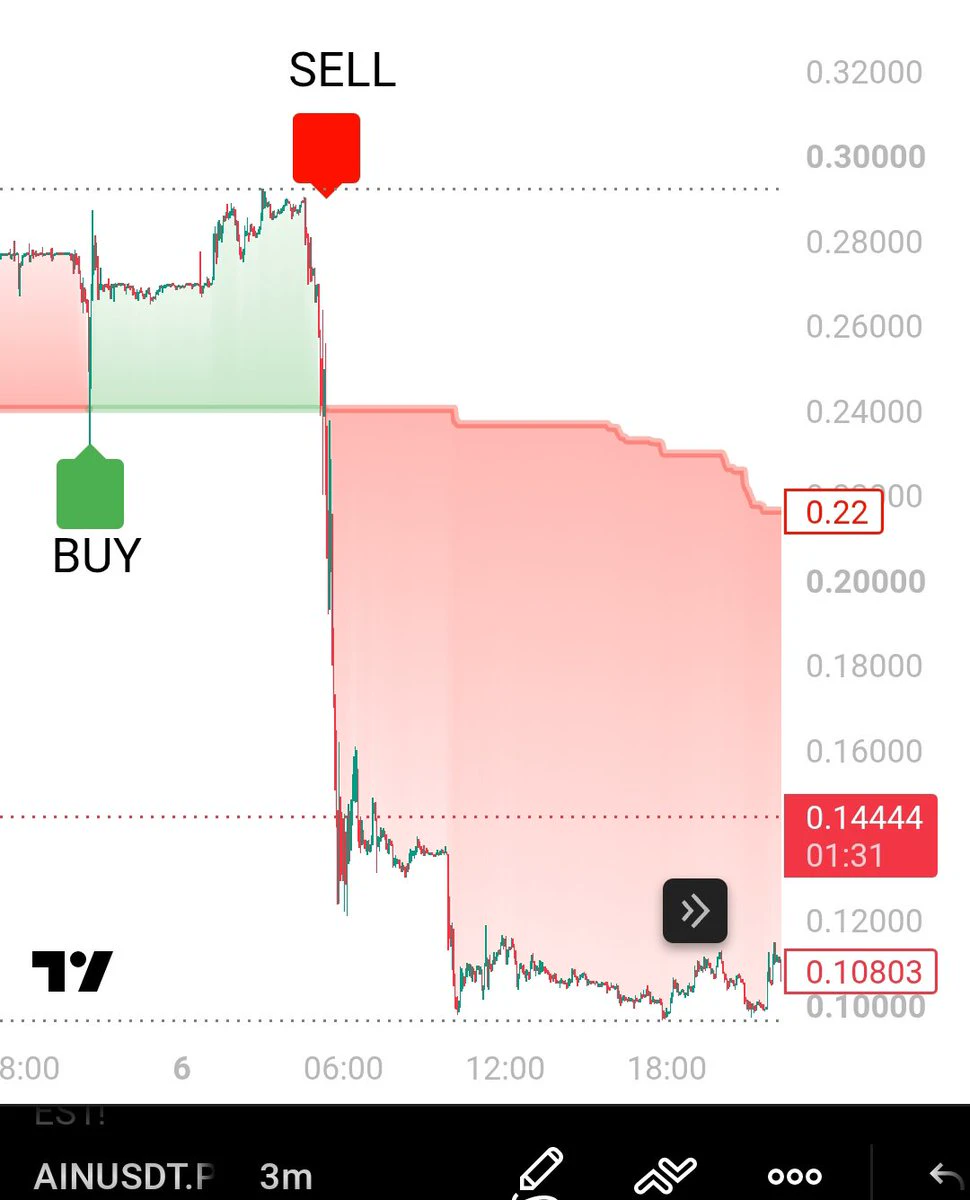
$AIN
Trend Strategy has absolutely delivered!
It's giving even the biggest paid groups tough competition with ease.
The accuracy speaks for itself.
post-image
AIN+3.85%
Trenches
ZIG
Z
bade
b
ZIG
0x8c...1145
Market Cap
$.
Change
.
24h Vol
$.
Holders
.
BTC
B
bade
b
BTC
C5xp...pump
Market Cap
$.
Change
.
24h Vol
$.
Holders
.
GM
G
bade
b
GM
0x13...7777
Market Cap
$.
Change
.
24h Vol
$.
Holders
.
Diamond
D
bade
b
Diamond
5VCE...pump
Market Cap
$.
Change
.
24h Vol
$.
Holders
.
DOGE
D
bade
b
DOGE
DoGE...fm7R
Market Cap
$.
Change
.
24h Vol
$.
Holders
.
#StockTalkSeason
#StockTalkSeason

The global stock market is entering another interesting period, and investors are paying close attention to the latest developments across different industries. From technology and artificial intelligence to banking, energy, healthcare, and semiconductor companies, every sector is bringing new opportunities and challenges for market participants.

Stock trading is not only about buying and selling shares. It is also about understanding companies, studying financial performance, following economic news, and identifying important market trends. Every market mo
BTC Update
live-cover
LIVE1,888
This isn’t just being heartless—their heart’s grown on top of their lungs.
What kind of person could do something this cruel?
I’m seriously pissed after reading this, damn.
📉 Guys, one thing I'm sure of: $ONE /USDT may continue falling sooner or later. However, before it falls, it may still print another bullish candle, triggering shorts' stop-loss orders and sweeping them out. On the other hand, it could also start falling directly from the current price. So I'm not going to wait. I'm opening a small short position now. If the price rises first, I'll add in batches at better prices. If it starts falling from here, I'll add to the position and lock in profits all the way down. My target is to sell below $0.00140. Let's see if this plan works. Ready to make this
post-image
ONE-1.19%
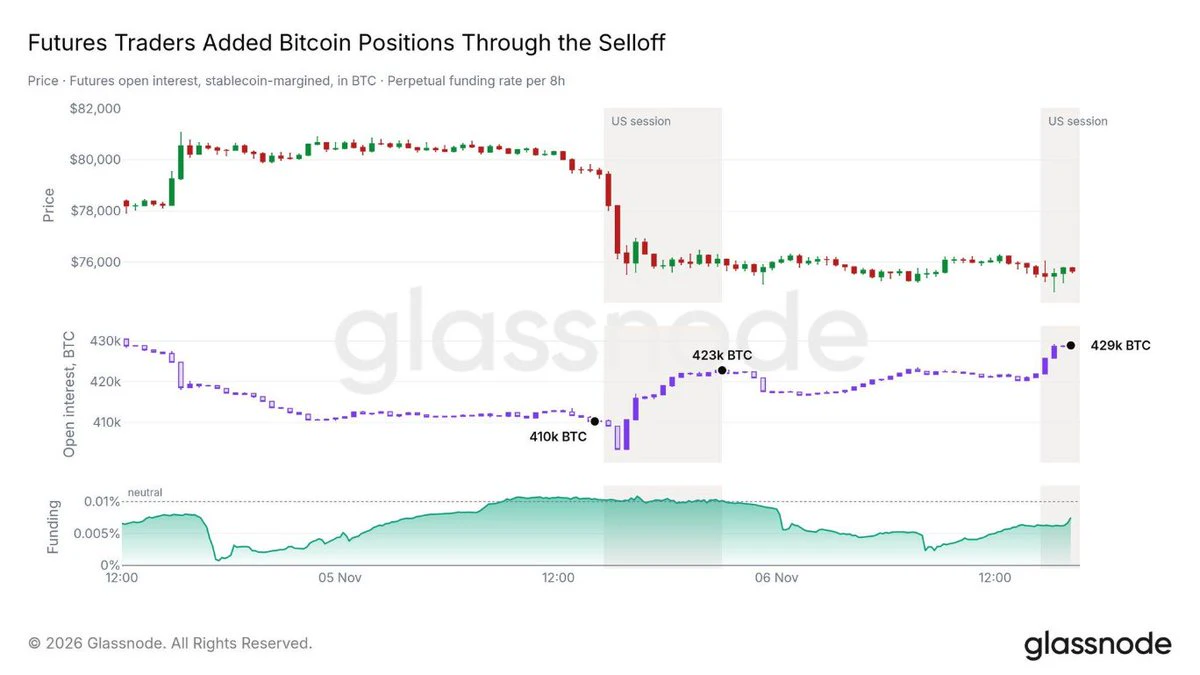
🐋 WHALE WATCH : $BTC open interest climbed $1.5B during the selloff per Glassnode.
Traders added leveraged positions into falling prices. Thats either conviction or a crowded trade setting up a sharper flush.
post-image
BTC-0.65%
What Is the Risk-Reward Ratio? Why Can a Trading Strategy with a High Win Rate Still Lose Money Over the Long Term?

In cryptocurrency trading, some traders place great importance on their win rate. They want to win at least seven out of ten trades, believing that making the right call often enough will allow them to keep making money.

But actual trading results don't depend only on how many times you win. They also depend on how much you make on each winning trade, how much you lose on each losing trade, and how high your trading costs are.

That's why the risk-reward ratio and win rate must
post-image
🇺🇸 The US takes another step toward bringing crypto into 401(k) retirement plans
The US Department of Labor has submitted a rule easing investment in crypto, private equity, and real estate in 401(k) plans to the White House for review.
This is the next step following Trump’s executive order in August 2025.
If approved, crypto could gain access to massive amounts of long-term capital from US pension funds. This is a notable signal, as this capital flow could provide further momentum for the market over the long term.
post-image
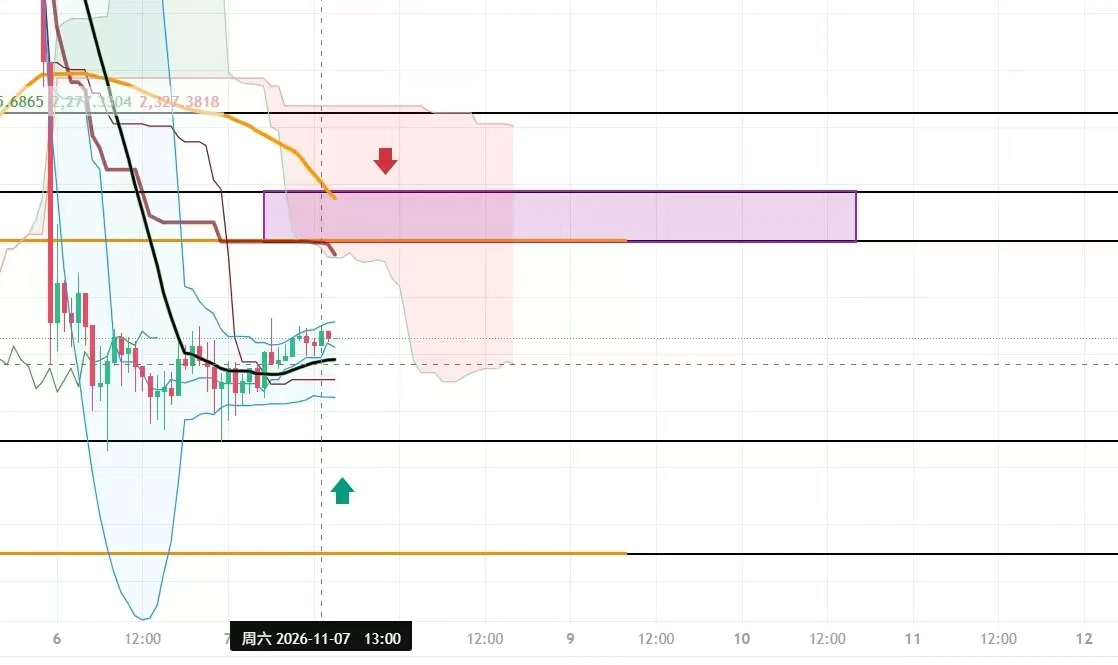
Ether is currently trading within a medium-term bearish framework, with this move being an oversold recovery rally following a deep decline. The daily bearish structure remains intact, with no confirmed trend reversal signals. Downward momentum on the 4-hour chart is gradually fading, and the market has entered a range-bound recovery phase. On the 1-hour chart, price has staged a modest short-term rebound, edging higher on support from the lows, and bullish sentiment on the shorter timeframe has improved somewhat. The three timeframes converge at 2279 to form resistance, making this the short-
post-image
ETH-1.26%
$SPCX ‌
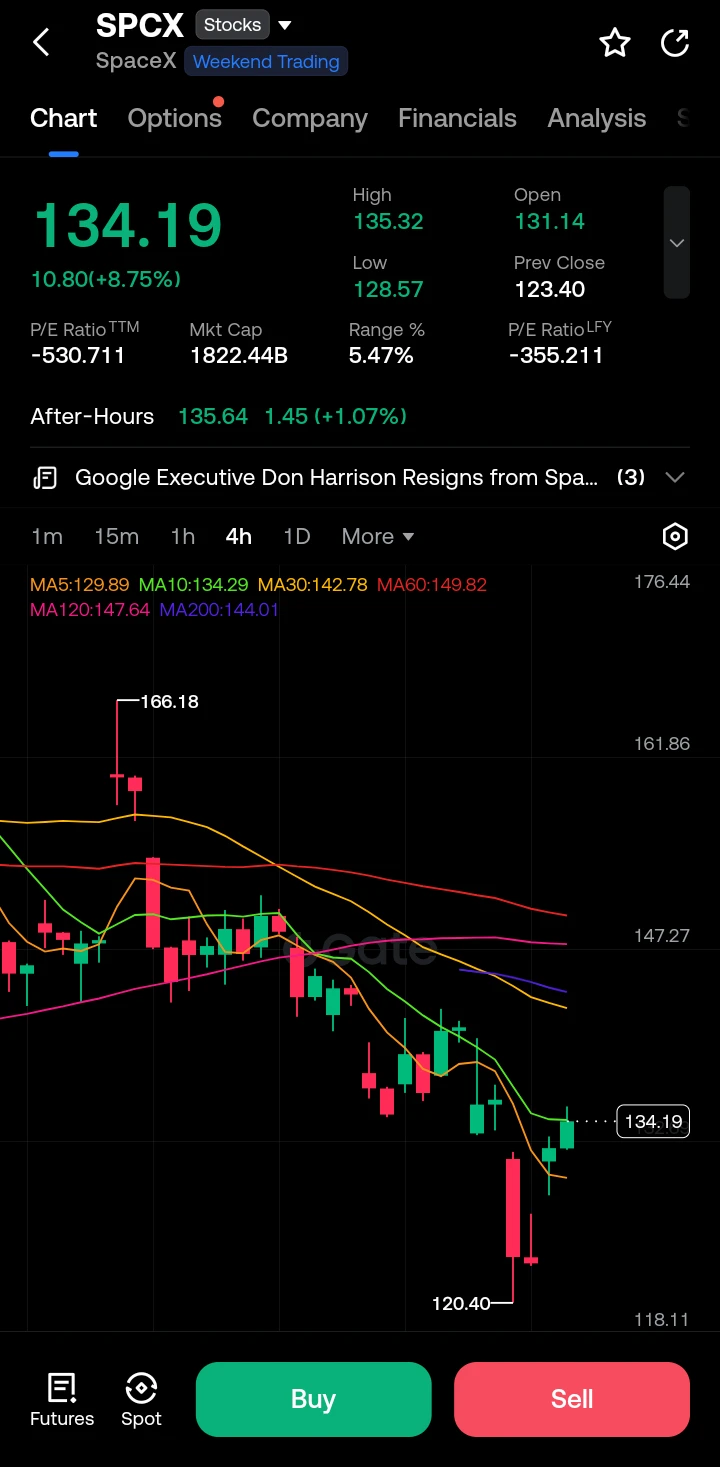
SPCX is trading at 134.19, up +8.75% on the session after a sharp recovery from the 120.40 low. Price has reclaimed the MA5 (129.89) and is testing the MA10 (134.29). Broader structure remains bearish with price still below the MA30/60/120/200 cluster (142–149 zone). After-hours is holding the bounce at 135.64.

Resistance: 135.30–136.50 (session high + after-hours), 142–144 (MA30 + MA200), 147–150 (MA120/MA60)
Support: 129.80–130.50 (MA5 + recent base), 128.50, 123.40 (prev close), 120.40 (swing low)

Strong impulsive red candle into 120.40 showed panic selling / stop-run.
Immediate
post-image
SPCX+8.74%
NAS100 1H Structure & Bias
$NAS100 ‌
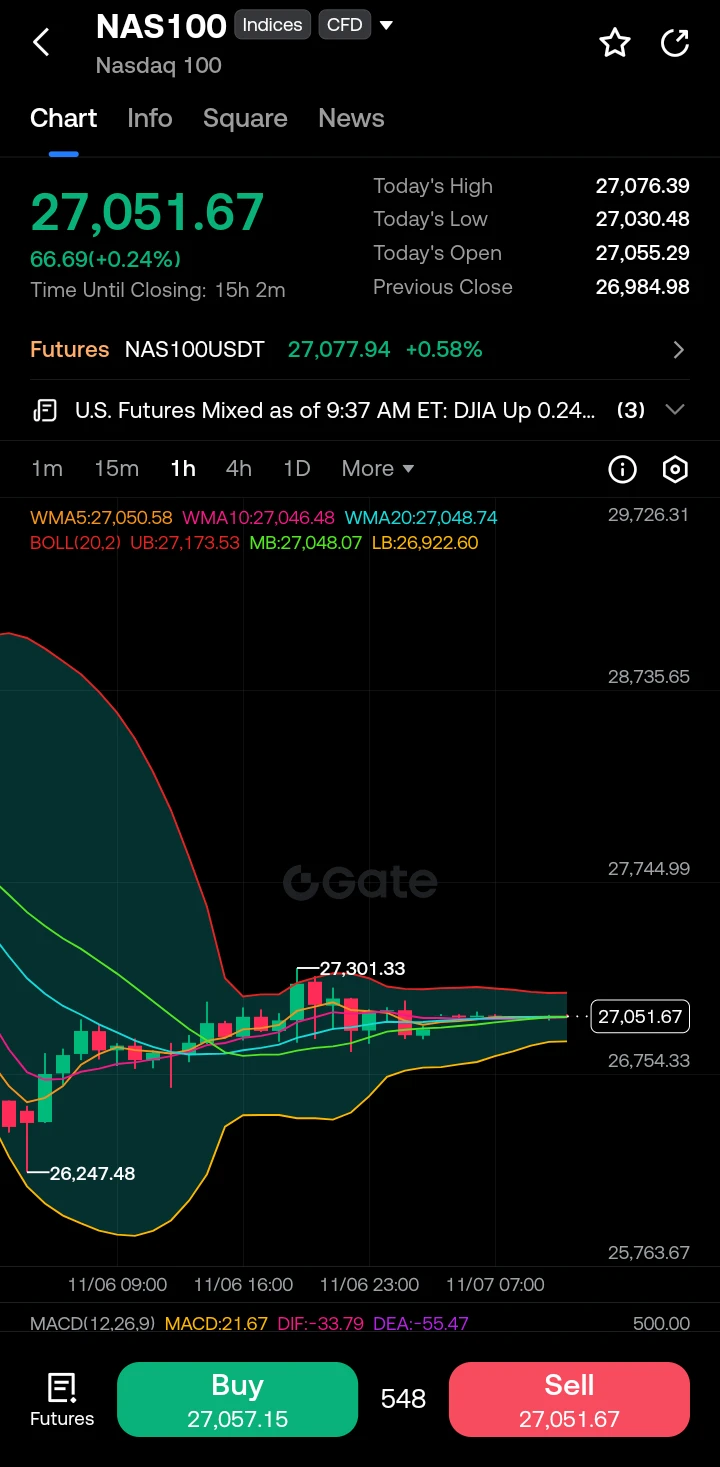
Price sits at 27,051.67, tightly coiled at the confluence of WMA5 (27,050.58), WMA10 (27,046.48), WMA20 (27,048.74) and Bollinger middle band (27,048.07).

Upper band resistance sits at 27,173.53. Lower band support at 26,922.60. Local swing high marked at 27,301.33; prior swing low at 26,247.48.
MACD (12,26,9) shows histogram positive at +21.67 while DIF (-33.79) remains above DEA (-55.47).

Momentum has shifted from deep negative territory and is attempting to cross higher on the 1H.

Key Observations.

Price is mean-reverting after the rejection from 2
post-image
NAS100+1.90%
  • 4
Why might your account's overall risk be far greater than expected even when you've only made a few trades?

Many traders review their positions one by one but overlook a more important question: Do these trades share a common source of risk?

Suppose you hold long positions in BTC, ETH, and SOL at the same time. On the surface, you hold three different assets; but if they are all affected by a broad market downturn, a contraction in liquidity, or declining risk appetite, all three trades could lose value together.

These are three issues in portfolio risk that are often overlooked.

1. Correl
post-image
BTC-0.67%
ETH-1.26%
SOL-0.77%
In BTC trading, there is a market phenomenon worth paying close attention to: after the price breaks below a key support level, the area that previously supported an uptrend may become resistance during the next rebound.
Why does this happen?
First, buying confidence changes. When BTC finds support multiple times in a certain price area, many traders choose to buy there. But once the price decisively breaks below that area, those who were waiting to buy may start sitting on the sidelines, weakening buying pressure.
Second, trapped traders start looking for a way out. Some investors bought near
post-image
BTC-0.67%
$CYBER Has it bottomed?🤔 Smart money is quietly accumulating—what about you? Key support levels are waiting for your assessment. #Gate.io 💎 #每周来晒 #Gate广场中秋团圆局
CYBER-5.40%
MARKET UPDATE
live-cover
LIVE1,138
In BTC trading, many traders have had this experience: the price suddenly breaks through an important resistance level, and they think an uptrend has finally begun, so they immediately enter by chasing the rally. Before long, the price quickly falls back into its previous range, or even triggers their stop-loss. This phenomenon is commonly known as a fake breakout.
So, how can you identify a fake breakout?
First, watch trading volume. A genuine breakout usually needs some volume to support it. If the price breaks through a key level but trading volume does not increase significantly, market pa
post-image
BTC-0.67%
#美股史诗级抛售 #Gate股票畅聊季 #每周来晒 The “Deleveraging” Moment in U.S. AI Stocks: A 1998 Replay Without Fed Rate Cuts to the Rescue!

This article analyzes the plunge in U.S. AI stocks and the wave of programmatic selling: at the market-structure level, leveraged ETFs and dealers’ negative Gamma triggered a mechanical selloff; at the valuation level, uncertainty over capex and returns created a rift; and at the macro level, the Fed was absent as a backstop through rate cuts. It examines whether the AI trade is replaying the 1998 LTCM crisis or heading toward a 2000-style bubble.

As buyers of AI computin
BUBBLE-2.35%
NDAQ+0.28%
SPX500+0.19%
NVDA+2.80%
CSCO-2.05%
  • 3
Bullish on red fruit, IQ has dropped; bullish on yellow fruit, sex drive has surged. The future of humanity is unimaginable 😅
post-image
Load More

Join 40 M users in our growing community

⚡️ Join 40 M users in the crypto craze discussion

💬 Engage with your favorite top creators

👍 See what interests you

Trending Topics

USAIStocksHitHard

15.97k Views3.64k Discussing

U.S. stocks sold off sharply on Thursday, November 5 (UTC). The Nasdaq closed down around 5.5%, entering correction territory, while the Philadelphia Semiconductor Index plunged roughly 12%, with chip stocks including $NVDA and $AMD posting steep losses. Beyond profit-taking, investors are growing concerned about the pace of AI data center construction, capital spending, and future returns on investment. The key question now is whether the AI sector’s lofty growth expectations need to be repriced. Where do you think the next opportunities will emerge: chip stocks, tech giants, or other sectors?

USNonfarmPayrolls

23.64k Views4.26k Discussing

StakeOnLaunchpoolToShare450KVLX

2.62k Views775 Discussing

View More