





Share crypto content and earn up to 60% commissions through content mining.
placeholder
gatefun
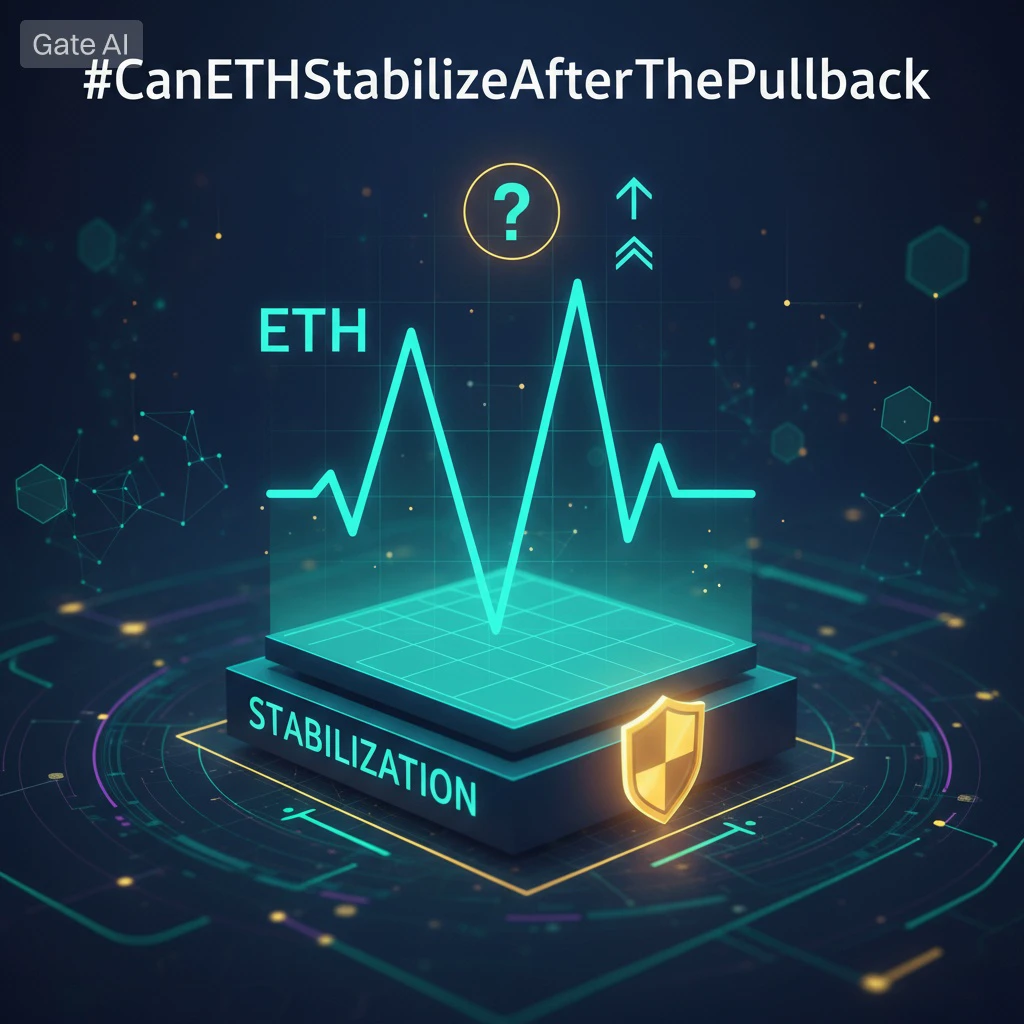
September 1 ETH Market Analysis

Direction: Rejected after rising to 2488.87, with a short-term choppy downward correction; prioritize entering long positions on a pullback
Long: Around 2430, stop-loss below 2415, targets 2475/2500

ETH is currently at 2457.27. On the one-hour timeframe, upward momentum weakened after rising to 2488.87, with the highs gradually moving lower and price pulling back after the rise. The 7-period moving average has turned downward, and price has fallen below the short-term moving averages, creating short-term downward pressure.

The 30-day moving average is stil
ETH1.77%
View Original
post-image
  • Reward
  • Comment
  • Repost
  • Share
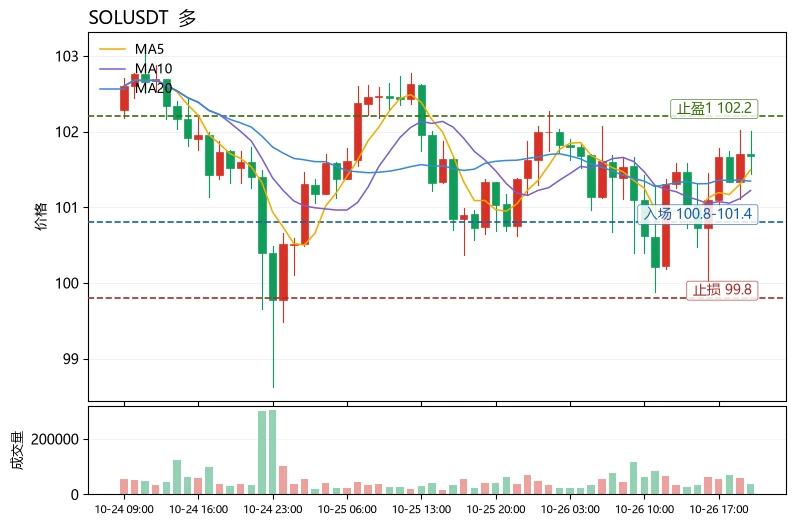
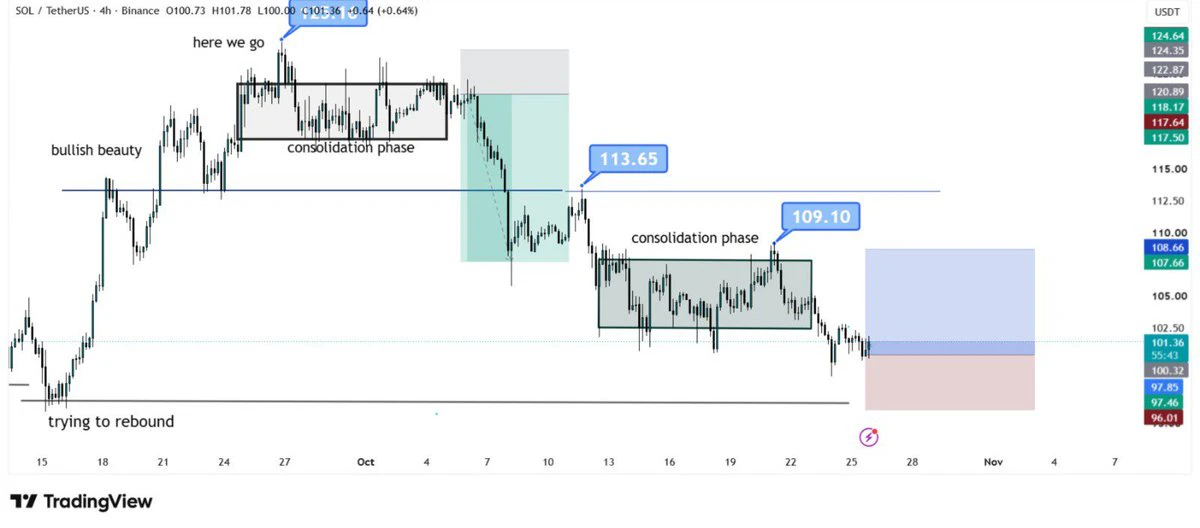
The hand that set the stop-loss a few days ago trembled slightly; this morning I realized that was unnecessary filial devotion. During the repeated intraday swings, $SOL /SOL faked a scary drop every time, but always held firm after the pullback, so I went long with my eyes closed.

I opened the charts this morning and saw that the sleepless nights had paid off. With a cost basis of 81.16, it is now at 102.89, +2490.63%. This move climbed step by step from the bottom—solid and reassuring.

I’ve banked 80%, raised the protection on the remaining 20%, and will let the rest of the profits run. E
SOL1.31%
ADA3.06%
DOGE1.01%
View Original
post-image
  • Reward
  • Comment
  • Repost
  • Share
One mythic Cache flow and a goal to retire 😂
Let’s see how this goes 🔥
@0xCacheFlow
FLOW-1.91%
post-image
  • Reward
  • Comment
  • Repost
  • Share
Others take years to save for a down payment, this wallet only took 46 hours.
$12.3k entered to buy $fone, finally sold back for $226.7k, net profit of $214.2k.
At first glance, it looks like a gamble, but after reviewing the records, it turns out: it sold 40 times in total, selling while the price rose, leaving not a single one at the end.
Wallet:
View Original
post-image
  • Reward
  • Comment
  • Repost
  • Share
9.1 ZEC Analysis
The monthly price has held above the Bollinger middle band and broken through the upper band. After the MACD formed a golden cross below the zero axis, the red bars have continued to expand, indicating that the long-term bearish trend has reversed. The monthly RSI has reached 71.5 and entered overbought territory. The momentum behind the long-term rally has begun to slow, and the market will likely digest profit-taking through wide-range consolidation at elevated levels. The daily price is within the 805‑870 range, with the Bollinger upper band forming immediate resistance and
ETH1.79%
View Original
post-image
  • Reward
  • Comment
  • Repost
  • Share
This trend doesn’t even require me to think—the account is dancing on its own🤣.

With green lights all over the screen, $XRP /XRP was lying on the ground, clearly moving sideways at the bottom. I watched it three times and decisively opened a long position. While everyone else was running, I insisted on buying the dip.

Fine, the market gave me the answer. Entered at 1.1518 and got out at 1.3808, taking +1846.25% profit directly. Staying bullish wasn’t in vain.

Take off 75% in the first move, and set protection for the remaining 20% at the entry price. Don’t let unrealized profits turn int
XRP1.96%
DOGE1.01%
ADA3.06%
View Original
post-image
  • Reward
  • Comment
  • Repost
  • Share
Cysic dropped 34% in the past 24 hours🔻
We may see further downside towards 50 to 45 at least.
Before going there, a possible resistance around 59-61.5 is likely.
Those who want to take $CYS short position should maintain SL at 64/65.
post-image
  • Reward
  • Comment
  • Repost
  • Share
JUST IN: STRC keeps September 2026 dividend yield at 12.00%, unchanged from August. If income stability persists, it could steady investor demand for the stock next month. $STRC
STRC0.13%
post-image
  • Reward
  • Comment
  • Repost
  • Share
$68,000 (blue): Expected probability 100%, odds 1.00x, the market consensus floor support level, with almost no expectation of a break below.
$70,000 (black): Expected probability 100%, odds 1.00x, holding above this price level has become a strong consensus.
$72,000 (green): Expected probability 99%, odds 1.01x, the only level among the three with a very slight divergence.
View Original
post-image
  • Reward
  • Comment
  • Repost
  • Share
JUST IN: BitMine reportedly bought 51,000 ETH (~$126M) from FalconX and BitGo, per Lookonchain. Potential sign of continued treasury accumulation by the Ethereum-focused player $ETH
BMNR6.66%
ETH1.79%
post-image
  • Reward
  • Comment
  • Repost
  • Share
$BLFS
It is about to explode!
post-image
  • Reward
  • Comment
  • Repost
  • Share
2460, 80 short positions in place.
View Original
post-image
  • Reward
  • Comment
  • Repost
  • Share
9.1 Chuze Gold Morning Analysis
Yesterday, the market did not continue last Friday’s sharp plunge. Prices stopped falling and entered a corrective consolidation. Intraday volatility narrowed, with bulls and bears pausing their contest. The rebound was limited, and prices tested overhead resistance several times but failed to achieve an effective breakout.
From a technical perspective, bearish momentum is continuing, and the market is trending weakly lower.
The Bollinger Bands are maintaining a downward channel, with prices fluctuating repeatedly between the middle and lower bands, forming a
BTC0.79%
View Original
post-image
  • Reward
  • Comment
  • Repost
  • Share
BTC thesis played out as expected!
I gave advance notice of a low-entry long on a pullback to 78000–78500. After finding support at the bottom, the market surged, with the first target of 79000 hit precisely.
The analysis was made public in advance, and the price action proved everything. #Gate首发上线日股交易 $BTC
BTC0.76%
View Original
post-image
post-image
  • Reward
  • Comment
  • Repost
  • Share
$ARB is up 32% in just 14 hours 🚀
Currently short-term correction is now underway as buyers take some profit. The key question is whether ARB can find a base around the nearby support zone $0.108–$0.105
If this zone holds, I’m watching for a bounce back toward:
• $0.120–$0.122 → key resistance
• $0.130–$0.133 → breakout zone
• $0.140–$0.150 → further extension if bulls regain strong momentum
🔻 Bearish scenario
If buyers lose control around $0.105–$0.104, the correction could extend toward $0.100 → $0.097 → $0.090 → $0.085
The chart is still structurally bullish after the massive breakout, bu
ARB32.30%
post-image
  • Reward
  • Comment
  • Repost
  • Share
9.1$BTC Market Trend and Strategy
Current Market Conditions
From the chart, the price began recovering after a round of bottoming out, surging again at around 3:10 a.m. and currently rebounding to around 785; the short-term moving averages have started turning upward, while the price remains under pressure below the middle Bollinger Band. The MACD red histogram is narrowing rapidly, momentum from the rebound is fading, and the market is weakening again. The lower timeframe remains a rebound-repair trend.
#加密市场回升
Trading suggestion: On a pullback to around 78000, try a small long position afte
BTC0.76%
View Original
post-image
  • Reward
  • Comment
  • Repost
  • Share
Ethereum stabilized around 2450 in the early hours, after which bulls continued to drive the price higher amid increased volume, with the high reaching 2495. However, this level encountered clear resistance, and the price failed to break through the 2500 round-number level. In the morning, the price pulled back to around 2455 and found brief support, and has now rebounded to around 2475, overall showing a narrow-range consolidation pattern after the surge and retracement.
The 2495-2500 region is a key daily-chart resistance zone. Previous rebounds were repeatedly blocked here, and the resistan
ETH1.77%
View Original
post-image
  • Reward
  • Comment
  • Repost
  • Share
A Brief Analysis of BTC Short-Term Trends from Dow Theory, Chan Theory, Elliott Wave Theory, Volume-Price Relationships, Order Flow, and Price Action (Strategy Recommendations)
Comprehensive Assessment
Dow Theory confirms that the primary trend remains upward, but a short-term double-top structure (81,235-81,347) has been confirmed. The high-volume rebound on August 31 was a positive signal, but it remains necessary to observe whether it can continue.
Chan Theory shows that the downward stroke from 81,347 had very strong momentum (-4,438), followed by a weaker upward stroke (+2,425). However,
BTC0.79%
View Original
post-image
post-image
  • Reward
  • Comment
  • Repost
  • Share
Morning Market Updates
gate liveLIVE
1,867
live-coin
  • Reward
  • Comment
  • Repost
  • Share
Load More

Join 40 M users in our growing community

⚡️ Join 40 M users in the crypto craze discussion
💬 Engage with your favorite top creators
👍 See what interests you
  • Pinned