XDB frente a SAND: Comparación del rendimiento y la escalabilidad de las soluciones de bases de datos de nueva generación


Introducción: Comparativa de inversión XDB vs SAND
En el mercado de criptomonedas, la comparación entre XDB y SAND se ha convertido en una cuestión recurrente para los inversores. Ambas muestran diferencias notables en el ranking de capitalización, los escenarios de uso y el comportamiento de precios, además de representar posicionamientos distintos como activos digitales.
XDB (XDB): Desde su aparición, ha sido reconocida por su papel en el impulso de marcas y consumidores del futuro.
SAND (SAND): Desde 2020, se ha destacado como universo virtual de juegos, consolidándose como una de las criptomonedas con mayor volumen de negociación y capitalización global.
Este artículo analiza en profundidad la comparación del valor de inversión entre XDB y SAND, centrándose en la evolución histórica del precio, mecanismos de suministro, adopción institucional, ecosistemas tecnológicos y previsiones futuras, con el objetivo de responder a la pregunta clave para los inversores:
"¿Cuál es la mejor opción de compra hoy?"
I. Comparativa histórica de precios y situación actual del mercado
Evolución histórica de precios de XDB y SAND
- 2021: XDB alcanzó su máximo histórico de $0,850722 el 22 de noviembre de 2021.
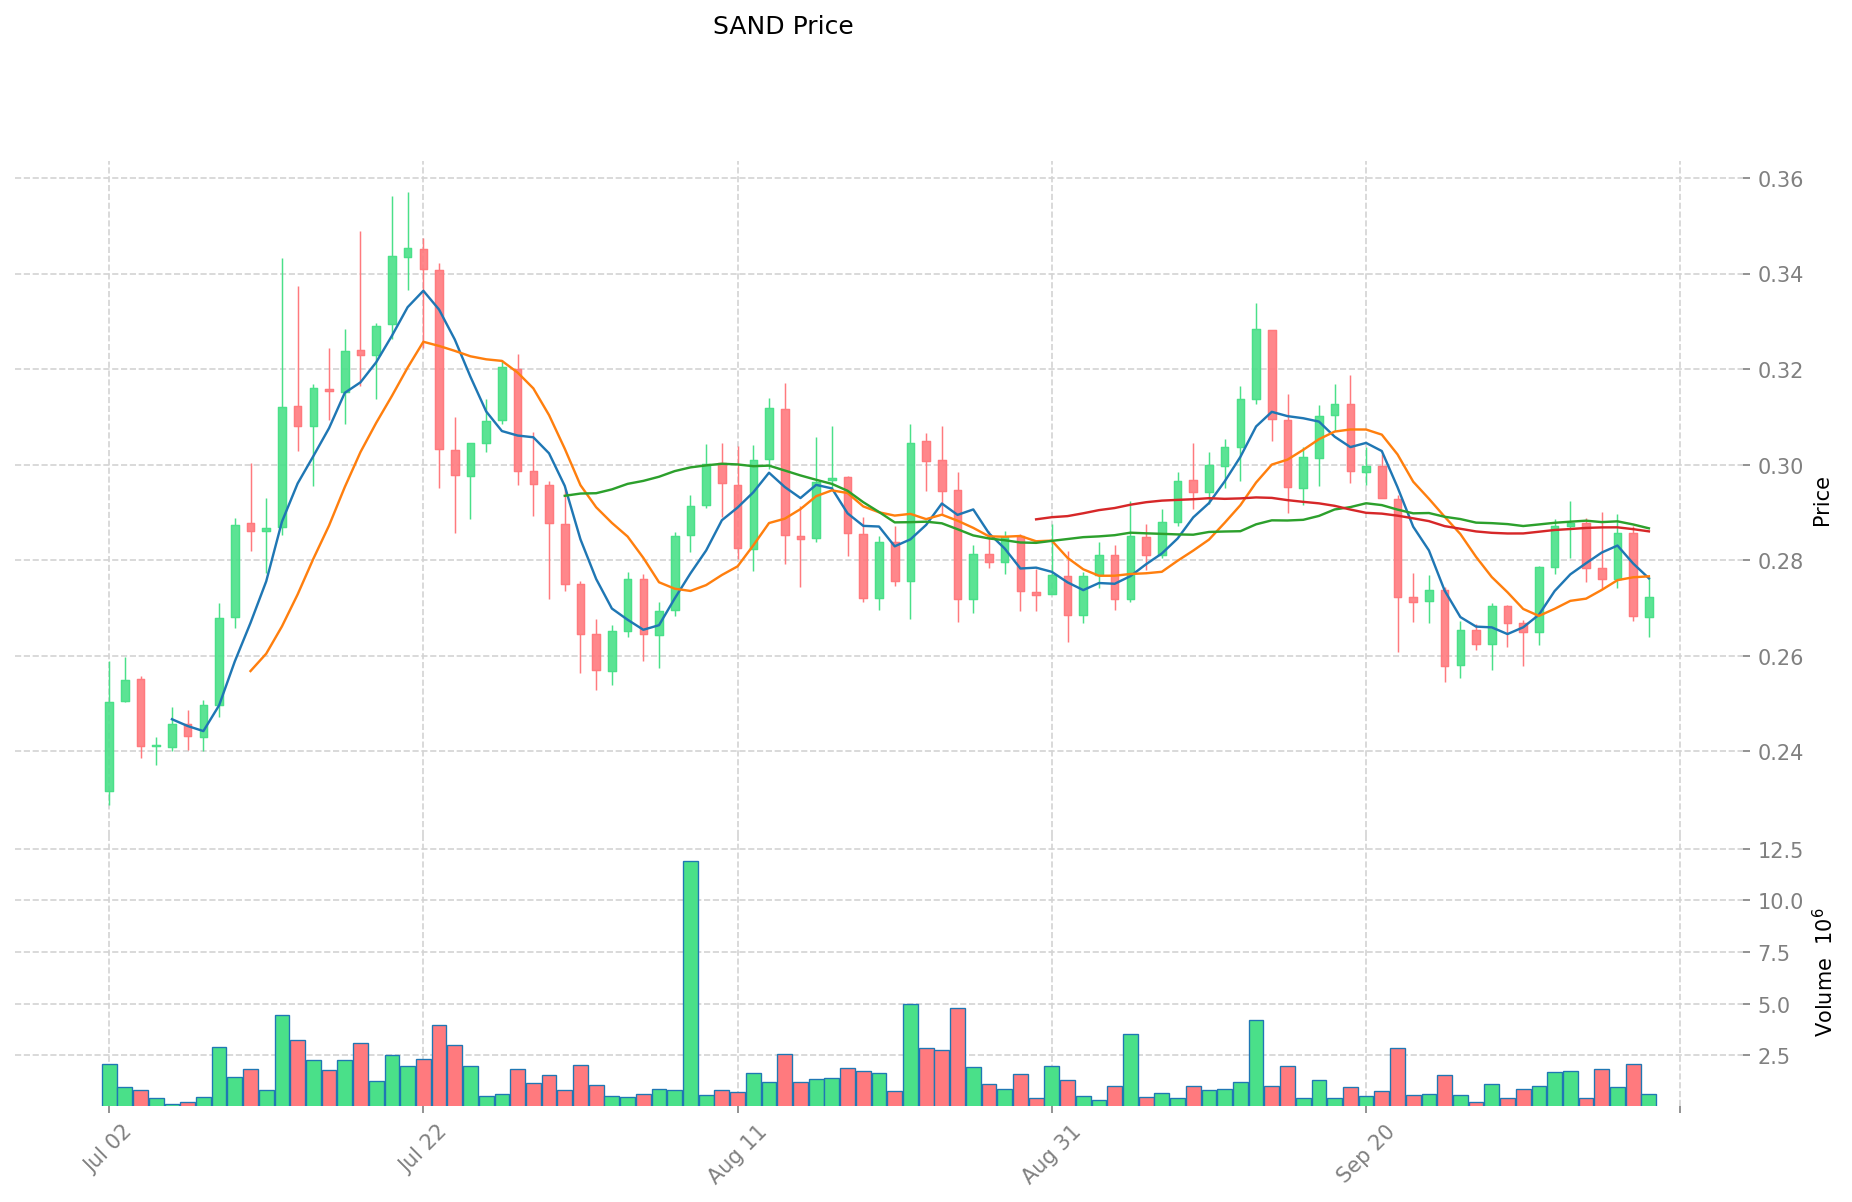
- 2021: SAND llegó a su máximo histórico de $8,4 el 25 de noviembre de 2021, impulsada por la fiebre del metaverso.
- Comparativa: En el último ciclo de mercado, XDB ha caído desde su pico de $0,850722 hasta los $0,0004964 actuales, mientras que SAND ha descendido de $8,4 a $0,2724.
Situación actual del mercado (09 de octubre de 2025)
- Precio actual de XDB: $0,0004964
- Precio actual de SAND: $0,2724
- Volumen negociado 24 h: XDB $6 623,68 | SAND $175 369,34
- Índice de Sentimiento del Mercado (Índice de Miedo y Codicia): 70 (Codicia)
Haz clic para ver precios en tiempo real:
- Ver precio XDB Precio de mercado
- Ver precio SAND Precio de mercado

II. Factores clave que influyen en el valor de inversión de XDB vs SAND
Innovación técnica y desarrollo
- XDB Chain: Centrado en innovación blockchain para el desarrollo de aplicaciones descentralizadas
- SAND: Información limitada en las fuentes disponibles
- 📌 Patrón histórico: Los proyectos con innovación técnica sostenida suelen mantener posiciones de liderazgo en el sector Web3
Participación comunitaria y de usuarios
- XDB Chain: Prioriza la interacción con la comunidad y la participación de usuarios como elementos clave en Web3
- SAND: Información limitada en las fuentes disponibles
- Apoyo comunitario: Ambos tokens emplean mecanismos de recompensa para incentivar la participación, con XDB ofreciendo premios por respuestas rápidas y precisas
Integración con el ecosistema Web3
- XDB Chain: Proyecto orientado al desarrollo de aplicaciones descentralizadas en el ecosistema Web3
- SAND: Información limitada en las fuentes disponibles
- Comparativa de ecosistemas: La adopción en DeFi, NFT, pagos y contratos inteligentes sería relevante, pero no hay datos suficientes
Rendimiento de mercado y accesibilidad de trading
- Plataformas de negociación: Diversos exchanges permiten operar con activos digitales, aunque no se detalla la disponibilidad específica de XDB y SAND
- Accesibilidad: Las plataformas actuales suelen ofrecer soporte en moneda local, métodos de pago variados e interfaces intuitivas
- Condiciones geográficas: Los marcos regulatorios de cada país pueden afectar la disponibilidad y negociación de estos tokens
III. Predicción de precios 2025-2030: XDB vs SAND
Predicción a corto plazo (2025)
- XDB: Conservadora $0,000477504 - $0,0004974 | Optimista $0,0004974 - $0,000651594
- SAND: Conservadora $0,246974 - $0,2714 | Optimista $0,2714 - $0,33925
Predicción a medio plazo (2027)
- XDB podría entrar en fase de crecimiento, con un rango estimado de $0,0004696512975 - $0,0007138699722
- SAND podría iniciar ciclo alcista, con rango estimado de $0,313446645 - $0,51880824
- Factores clave: Entrada de capital institucional, ETF, desarrollo de ecosistemas
Predicción a largo plazo (2030)
- XDB: Escenario base $0,000763338343365 - $0,000916006012038 | Escenario optimista $0,000916006012038+
- SAND: Escenario base $0,56091547335375 - $0,7628450437611 | Escenario optimista $0,7628450437611+
Consulta las previsiones de precios detalladas para XDB y SAND
Aviso legal: Las predicciones anteriores se basan en datos históricos y análisis de mercado. El mercado cripto es altamente volátil y sujeto a cambios rápidos. Esta información no es asesoramiento financiero. Investiga siempre por tu cuenta antes de invertir.
XDB:
| Año | Precio máximo previsto | Precio medio previsto | Precio mínimo previsto | Variación % |
|---|---|---|---|---|
| 2025 | 0,000651594 | 0,0004974 | 0,000477504 | 0 |
| 2026 | 0,00067790646 | 0,000574497 | 0,00030448341 | 15 |
| 2027 | 0,0007138699722 | 0,00062620173 | 0,0004696512975 | 26 |
| 2028 | 0,00073703943621 | 0,0006700358511 | 0,000442223661726 | 34 |
| 2029 | 0,000823139043076 | 0,000703537643655 | 0,000555794738487 | 41 |
| 2030 | 0,000916006012038 | 0,000763338343365 | 0,000618304058126 | 53 |
SAND:
| Año | Precio máximo previsto | Precio medio previsto | Precio mínimo previsto | Variación % |
|---|---|---|---|---|
| 2025 | 0,33925 | 0,2714 | 0,246974 | 0 |
| 2026 | 0,415242 | 0,305325 | 0,25952625 | 12 |
| 2027 | 0,51880824 | 0,3602835 | 0,313446645 | 32 |
| 2028 | 0,6549233463 | 0,43954587 | 0,2725184394 | 62 |
| 2029 | 0,5745963385575 | 0,54723460815 | 0,3666471874605 | 101 |
| 2030 | 0,7628450437611 | 0,56091547335375 | 0,532869699686062 | 106 |
IV. Comparativa de estrategias de inversión: XDB vs SAND
Estrategias de inversión a largo y corto plazo
- XDB: Perfil idóneo para inversores centrados en tecnología blockchain y desarrollo de aplicaciones descentralizadas
- SAND: Apto para inversores interesados en criptomonedas de metaverso y gaming
Gestión de riesgos y asignación de activos
- Inversores conservadores: XDB 30 % | SAND 70 %
- Inversores agresivos: XDB 60 % | SAND 40 %
- Instrumentos de cobertura: stablecoins, opciones, carteras multimoneda
V. Comparativa de riesgos potenciales
Riesgo de mercado
- XDB: El bajo volumen negociado puede aumentar la volatilidad y el riesgo de liquidez
- SAND: Expuesto a las tendencias del metaverso y gaming
Riesgo técnico
- XDB: Escalabilidad y estabilidad de la red
- SAND: Seguridad de la plataforma y vulnerabilidades en smart contracts
Riesgo regulatorio
- Las políticas regulatorias internacionales pueden afectar de forma diferente a ambos tokens, especialmente por la regulación del metaverso y el sector gaming
VI. Conclusión: ¿Cuál es la mejor opción de compra?
📌 Resumen del valor de inversión:
- Ventajas de XDB: Foco en innovación blockchain y participación comunitaria
- Ventajas de SAND: Consolidación en metaverso y gaming, mayor liquidez y volumen negociado
✅ Recomendaciones de inversión:
- Inversores nuevos: Opta por una estrategia equilibrada, con ligera preferencia por SAND por su liquidez
- Inversores experimentados: Evalúa en función de tu tolerancia al riesgo y confianza en los ecosistemas
- Inversores institucionales: Realiza un análisis exhaustivo de ambos proyectos, considerando el potencial a largo plazo y el marco regulatorio
⚠️ Aviso de riesgos: El mercado cripto es altamente volátil y este artículo no constituye asesoramiento de inversión. None
VII. Preguntas frecuentes
P1: ¿Cuáles son las diferencias principales entre XDB y SAND? R: XDB se orienta a la innovación blockchain y al desarrollo de aplicaciones descentralizadas. SAND está enfocado principalmente en el metaverso y el sector gaming. XDB tiene menor volumen y capitalización que SAND, que cuenta con mayor consolidación en su segmento.
P2: ¿Qué token ha mostrado mejor rendimiento histórico? R: Según los datos, SAND ha tenido mejor desempeño. Alcanzó un máximo de $8,4 en noviembre de 2021, frente al pico de $0,850722 de XDB. Ambos han sufrido caídas relevantes desde sus máximos.
P3: ¿Qué previsiones de precio hay para XDB y SAND en 2030? R: Para 2030, XDB podría situarse en el rango base de $0,000763338343365 - $0,000916006012038 y superar $0,000916006012038 en el escenario optimista. SAND se prevé en el rango base de $0,56091547335375 - $0,7628450437611 y por encima de $0,7628450437611 en el escenario optimista.
P4: ¿Cómo se comparan los volúmenes negociados de XDB y SAND? R: Actualmente, SAND registra un volumen negociado 24 h de $175 369,34, muy superior al de XDB, que es de $6 623,68.
P5: ¿Cuáles son los principales riesgos de invertir en XDB y SAND? R: Ambos tokens afrontan riesgos de mercado, técnicos y regulatorios. XDB puede presentar mayor volatilidad y riesgo de liquidez por su bajo volumen, mientras que SAND está más expuesto a los cambios en el metaverso y gaming. Ambos pueden enfrentar desafíos técnicos y regulatorios.
P6: ¿Cómo deben los inversores repartir sus activos entre XDB y SAND? R: Los perfiles conservadores pueden asignar 30 % a XDB y 70 % a SAND; los agresivos, 60 % a XDB y 40 % a SAND. La asignación debe ajustarse a la tolerancia al riesgo y los objetivos individuales.
P7: ¿Qué token se recomienda para inversores principiantes? R: Para inversores nuevos, se aconseja una estrategia equilibrada con ligera preferencia por SAND, por su liquidez y consolidación en el metaverso. Es fundamental investigar y valorar la tolerancia al riesgo antes de invertir.
Compartir
Contenido
Introducción: Comparativa de inversión XDB vs SAND
I. Comparativa histórica de precios y situación actual del mercado
II. Factores clave que influyen en el valor de inversión de XDB vs SAND
III. Predicción de precios 2025-2030: XDB vs SAND
IV. Comparativa de estrategias de inversión: XDB vs SAND
V. Comparativa de riesgos potenciales
VI. Conclusión: ¿Cuál es la mejor opción de compra?
VII. Preguntas frecuentes
Cómo comprar criptomonedas


Criptomonedas en tendencia


¿Es Ultiverse (ULTI) una buena inversión?: Análisis del potencial y los riesgos de este token del metaverso

¿Es Yuliverse (YULI) una buena inversión?: Análisis del potencial y los riesgos de este token del metaverso

NOS vs MANA: Duelo de los Reinos Digitales en la Economía del Metaverso

¿Es Baby Shark (BSU) una buena inversión?: Análisis del potencial de la sensación viral en el mercado de activos digitales
¿Qué es VANRY: análisis de la tecnología innovadora que está revolucionando las experiencias digitales

¿Es Adventure Gold (AGLD) una buena inversión?: Análisis del potencial a largo plazo de este token de gaming dentro del ecosistema NFT

Combo Diario de Dropee 11 de diciembre de 2025
Combo Diario de Tomarket 11 de diciembre de 2025

Comprender la pérdida impermanente en las finanzas descentralizadas

El doble gasto en criptomonedas: estrategias para prevenirlo

Comprender el Método Wyckoff en el trading de criptomonedas