Square
Following
Hot
News
Notifications
Profile
Share your thoughts
placeholder
Article
$AIO Up 24% in 24 hours—I strongly advise you not to touch it right now.
Don't rush to accuse me of blocking your path to profits. Look at the data first: current price 0.0531, 24h high 0.0538, low 0.0381, price range over 40%, trading volume 20.7M. With this much volume behind the price move, tokens are changing hands extremely quickly, and short-term profits have piled up at the peak. If you jump in now, you're providing exit liquidity to those who got in early this morning.
Fundamentally, this AIO rally has no significant on-chain lockups backing it; it's a classic emotion-driven surge. The
AIO-3.19%
Got it!
The idea is to hurry up and find a wife, then start a business together.
A modest annual income goal.
post-image
Trenches
ZIG
Z
bade
b
ZIG
0x8c...1145
Market Cap
$.
Change
.
24h Vol
$.
Holders
.
BTC
B
bade
b
BTC
C5xp...pump
Market Cap
$.
Change
.
24h Vol
$.
Holders
.
STONK
S
bade
b
STONK
6GmA...UNgx
Market Cap
$.
Change
.
24h Vol
$.
Holders
.
ANSEM
A
bade
b
ANSEM
9cRC...pump
Market Cap
$.
Change
.
24h Vol
$.
Holders
.
MAGGIE
M
bade
b
MAGGIE
8rHo...PmZV
Market Cap
$.
Change
.
24h Vol
$.
Holders
.
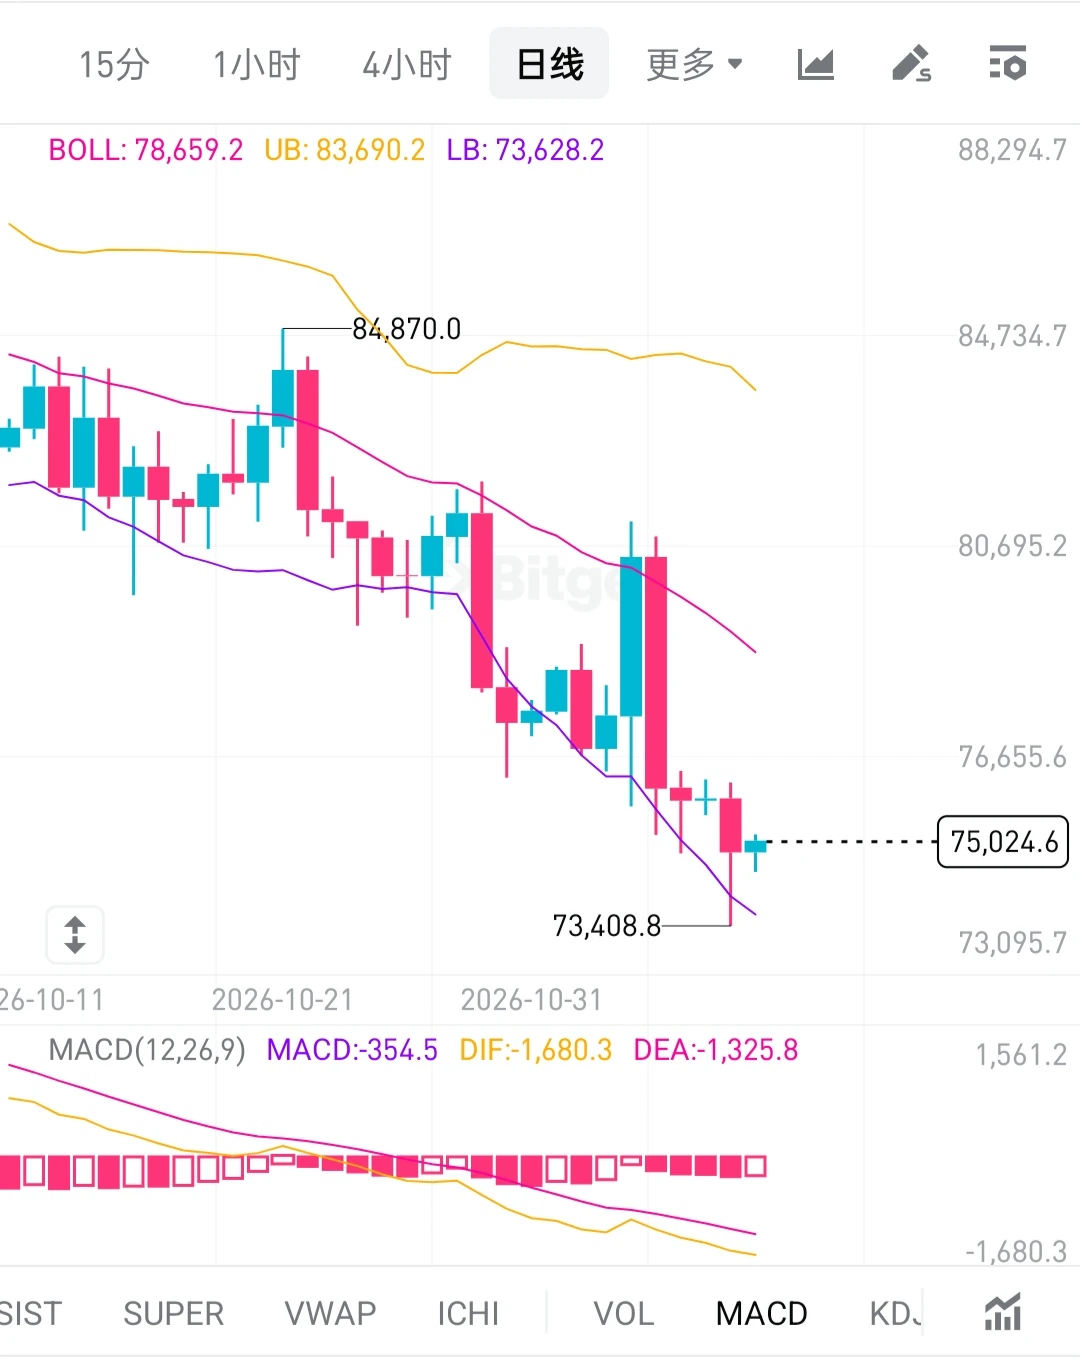
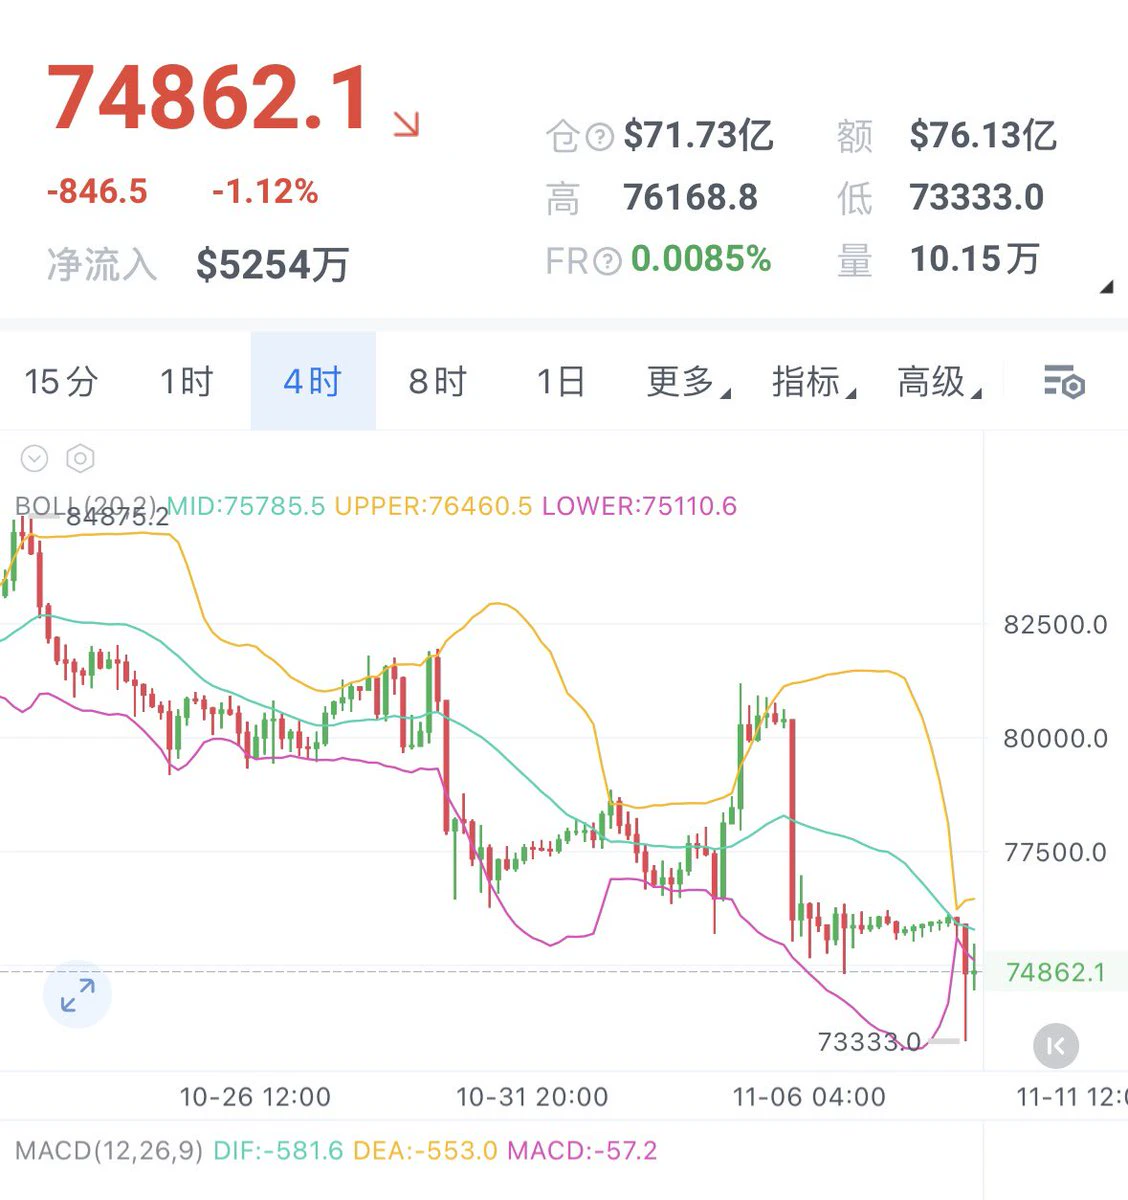
November 9 Bitcoin:

The current price is below the BOLL midline and near the lower BOLL band, with the previous low around 73,400. The broader daily bearish structure remains unchanged. After a downward move, a small candlestick formed, indicating a weak recovery at low levels.

MACD’s DIF is below DEA and remains negative. The bearish structure has not reversed; the decline has only temporarily slowed, with no clear bullish signal. Focus on the 73,408–73,628 support zone. If support holds, the market may attempt a rebound; otherwise, it may continue downward.

Trading suggestion:

Look to sh
post-image
BTC-0.67%
Time to maxbid solana:DEW9dSN6QpWyNthphCpMmAbZP1Q4cEKR9xQXAri98WDP
Free money right now.
Wouldn’t be surprised if it did billions.
post-image
SOL-0.77%
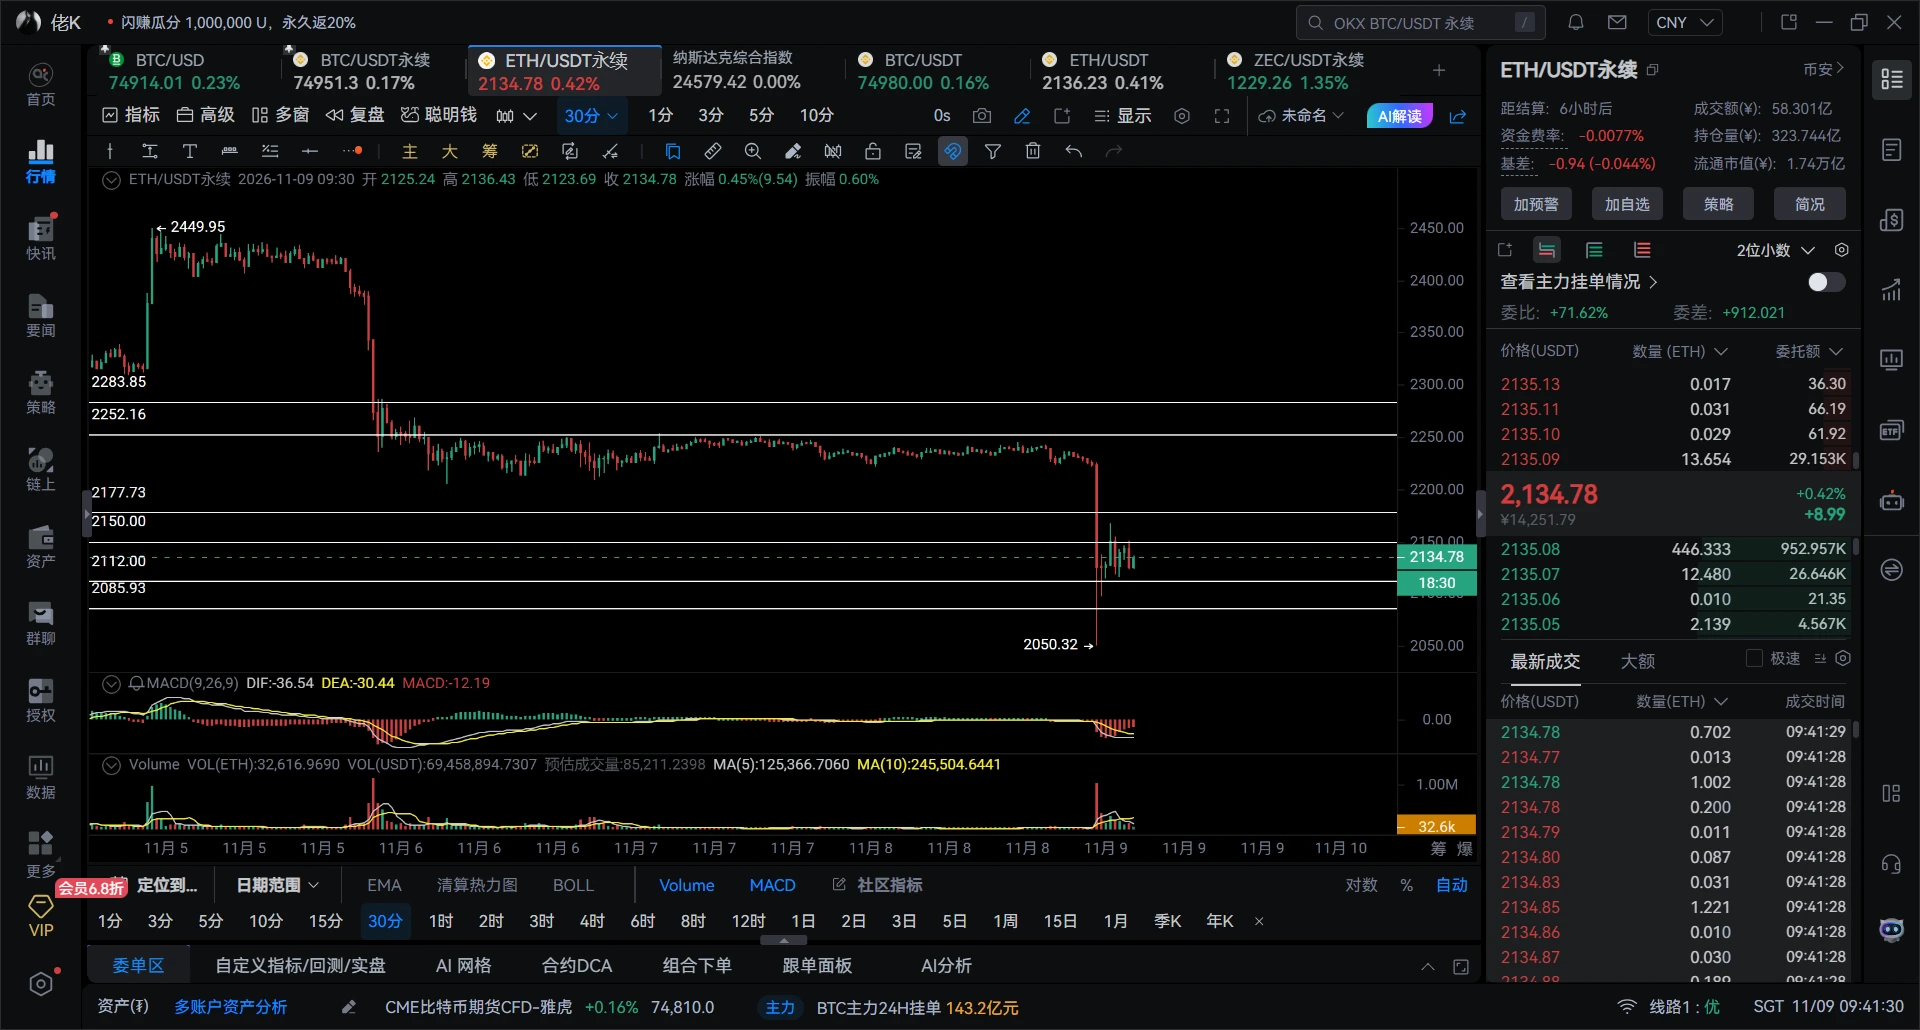
11.9 ETH Market Analysis
Ethereum has fallen sharply and has not recovered as quickly as Bitcoin
The monthly chart also shows hidden divergence; the weekly MACD has printed a death cross for 2 consecutive weeks
On the 3-day and 5-day timeframes, prices have continued to fall on low volume; the 2-day chart has broken lower
12/8-hour timeframe rebound + divergence (no pattern on the 2–6-hour timeframes; in the short term, wait for the 15/30-minute charts to bottom and form a pattern)
Intraday resistance: 2150 2177 2205
Intraday support: 2112 2085 2056
$ETH
post-image
ETH-1.23%
The position is shown as open, purely quantitative, starting at 100U. Welcome to observe 👀.
post-image
$JCT has fallen below the short-term support zone, and the funding rate is starting to reverse. Short, short, short🔥🔥Tp1: 0.01Tp2: 0.085Tp3: 0.06Sl: 0.0137$SKYAI $ON
post-image
JCT-3.26%
SKYAI-7.58%
ON+4.77%
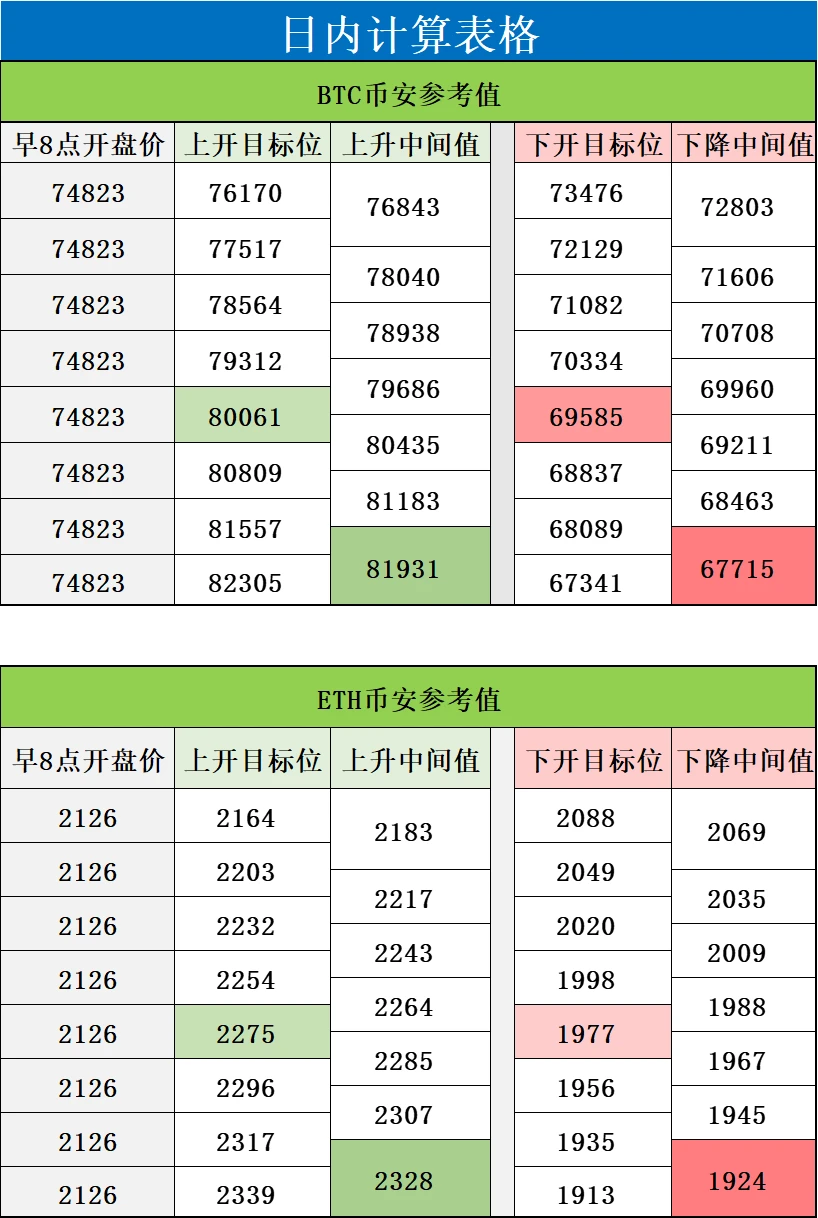
Intraday calculation table
‍$BTC
$ETH
post-image
BTC-0.65%
ETH-1.23%
11.09 Qiqi on Gold Morning Review: Strong Early-Session Rally—Can the Bulls Keep Pushing Higher?

Gold prices surged early, briefly pulling back to 4054 before finding support and continuing higher. They have now reached around 4104, as short-term bullish momentum has surged. Bullish sentiment is picking up, but after a sustained rally, a pullback for consolidation may be needed, so chasing prices higher is not advisable.

Short-term moving averages are in a bullish alignment, and the MACD red bars are expanding. However, indicators are gradually entering overbought territory, so beware of a p
post-image
XAU+0.38%
How to Build a Trading Cost Spreadsheet and Get a Clear Picture of Your Real Profits?

Many traders review their trades every day, but may overlook one key question:

Your account appears to be making money, but how much is actually left after all costs?

Without complete trading records, you may know which trades made money, but not what is continually eroding your profits.

Today, we’re sharing a trading cost accounting method you can put into practice right away.

I. Record Every Trade

We recommend creating an Excel spreadsheet that records at least the following information:

* Trade date
post-image
📊 Macro and Financial News

Title: Macro, Geopolitical and Financial Calendar | 11.09–11.15 (Beijing Time)
Top timestamp: 2026.11.09 08:50
⭐⭐⭐ Very High Impact
✅ November 09 09:30 China October CPI and PPI inflation data
✅ November 10 21:30 US October CPI inflation (Core CPI)【Key Focus This Week】

⭐⭐ Moderate Impact
✅ November 12 21:30 US initial jobless claims
✅ November 13 23:00 US Producer Price Index (PPI)

⭐ Regular Watch
✅ November 11 Watch for public remarks by Fed and ECB officials
✅ November 12 Evening remarks by several Fed officials
✅ November 14 09:30 China price changes for key p
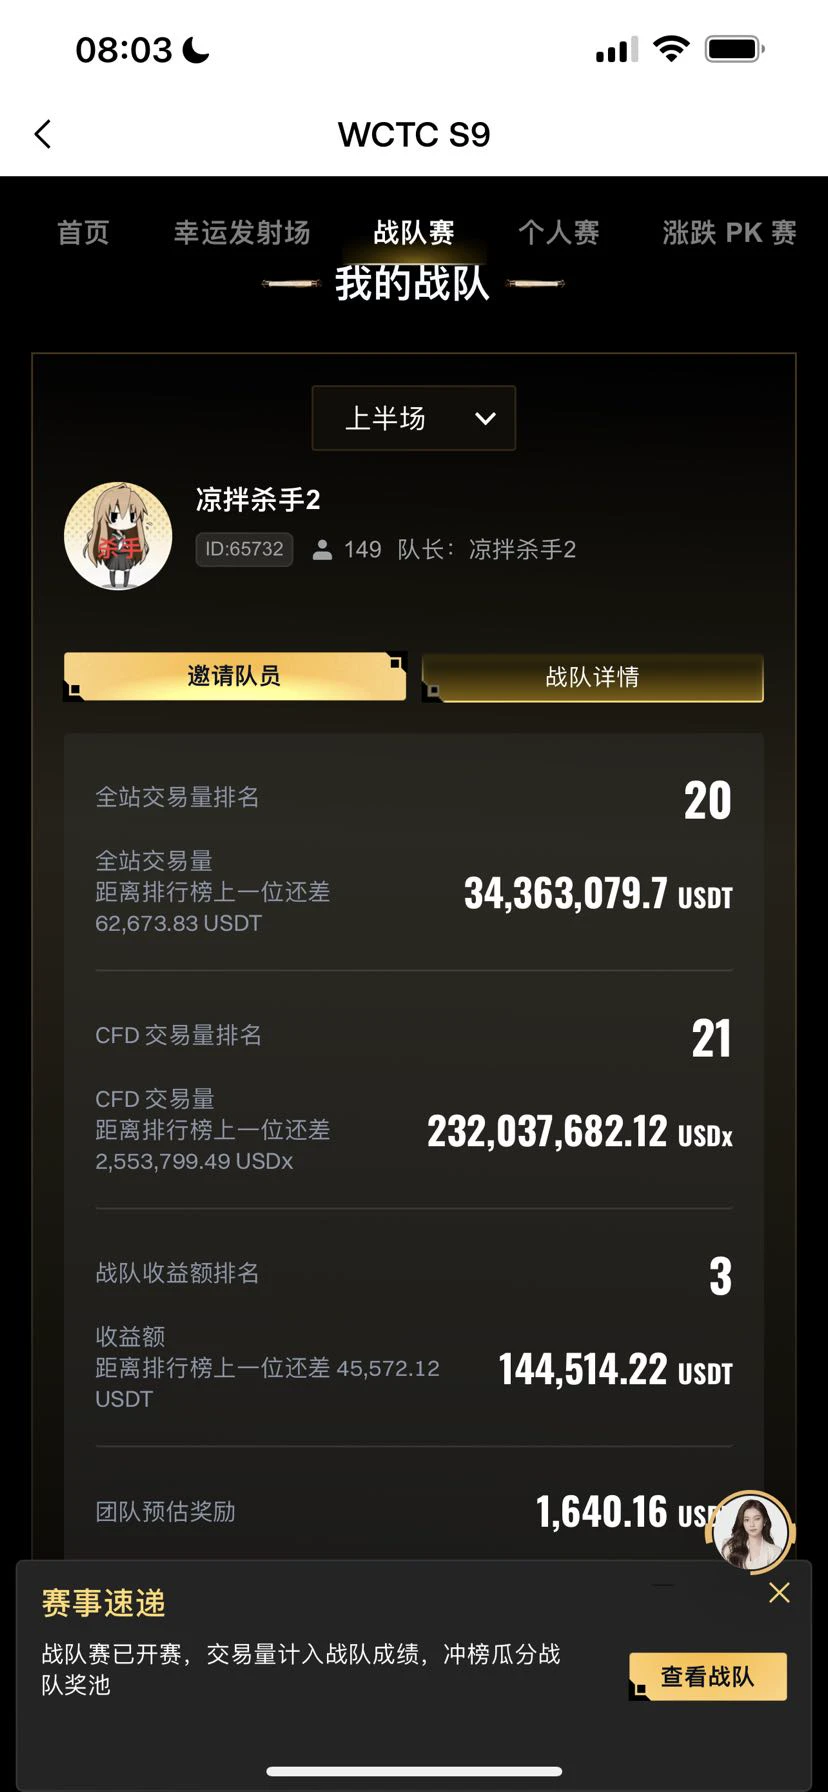
Congratulations to the team! We ranked 15th in number of sign-ups and 20th in platform-wide trading volume, but 3rd in earnings. We ranked 2nd in earnings last season. Tune in to the livestream—earnings are king
post-image
post-image
BTC-0.65%
GT-2.24%
ETH-1.23%
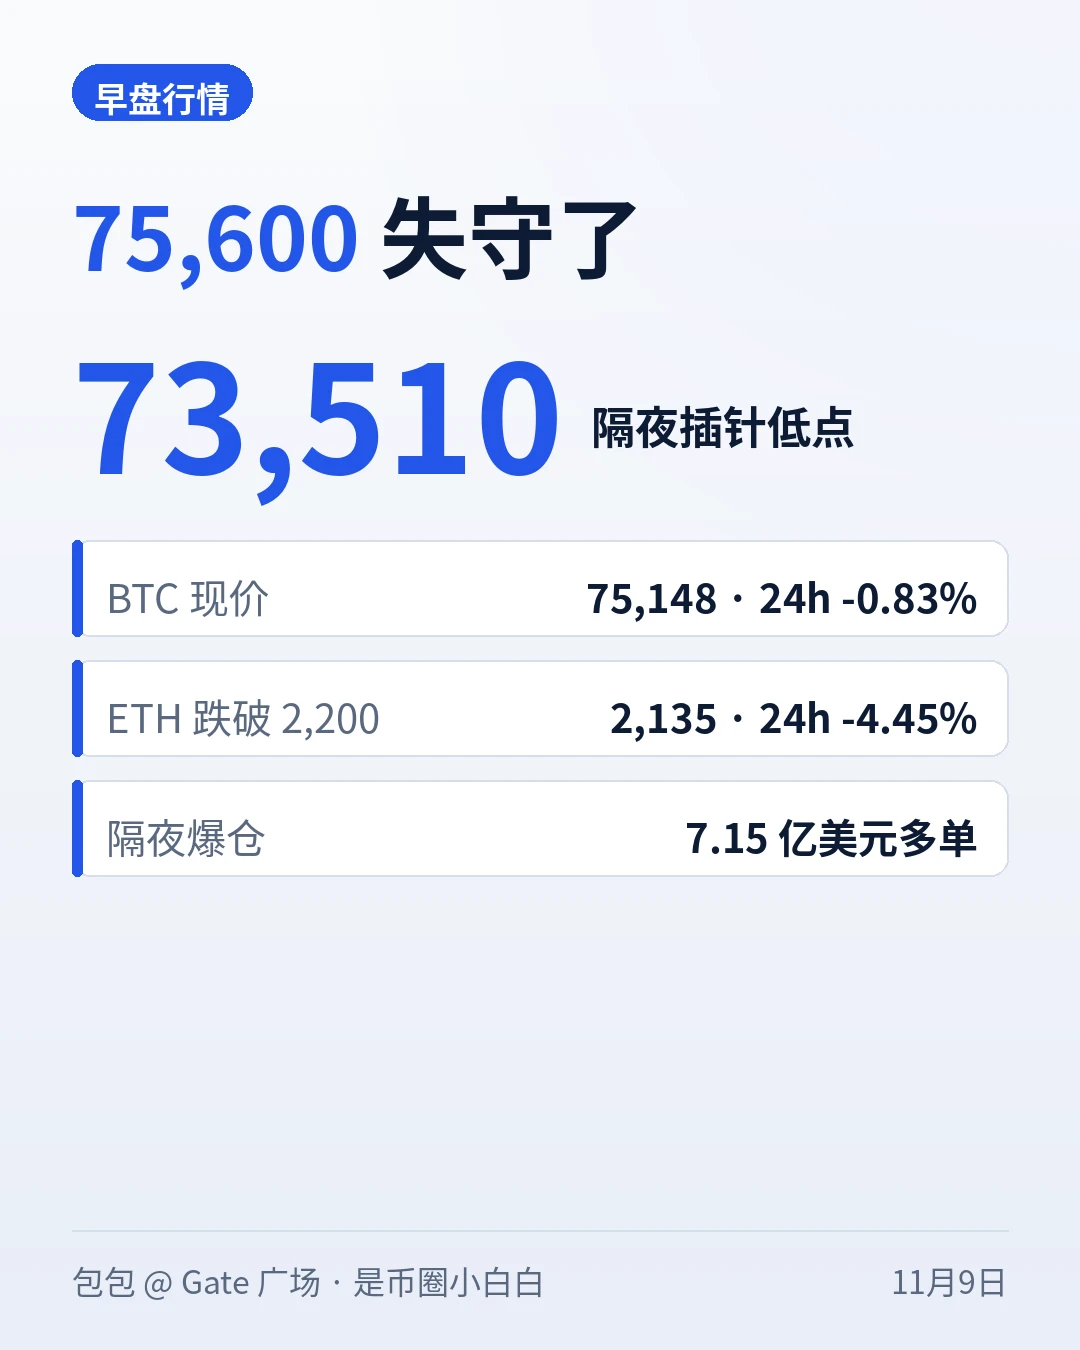
Sudden flash crash before BTC’s weekly close! A wick down to $73,510, with $715 million in long
live-cover
LIVE1,913
In BTC trading, how do you choose the right position size? Don't let one mistake destroy your entire account!
In BTC trading, many people devote a lot of effort to predicting market direction, but overlook a question that directly affects their account’s survival: how much capital should they actually commit? Even if they get the direction right, an oversized position could force them out early due to sharp volatility along the way.
So, how can you choose a position size scientifically?
First, don't confuse your account balance with your actual position size. The amount of money in your accoun
post-image
BTC-0.65%
75,600 held for three days, but still broke. Overnight, BTC plunged to 73,510 on a single wick, liquidating $715 million in long positions in one hour. It’s back to 75,148 this morning—the first day after the breakdown, the key thing to watch isn’t how high the rebound goes, but whether 73,500, the wick’s low, holds. #70%山寨币跌破200日均线
First, the numbers (around 09:00 on November 9, 2026, sources: Finnhub / CoinGecko): BTC at $75,148, down 0.83% in 24 hours, trading in a range of 73,510–76,200; Friday’s close was 75,773, which means the 75,600 level held for three days over the weekend before gi
post-image
BTC-0.67%
ETH-1.26%
Jensen Huang’s Full Apology Letter for His Affair Revealed; NVIDIA Launches Independent Investigation, CEO Admits Infidelity and Takes Full Responsibility
1. Jensen Huang Admits to an Affair and Issues a Public Apology
•
Admits to infidelity: On November 8, 2026, NVIDIA CEO Jensen Huang sent a company-wide letter to employees and family members, publicly admitting that he had been unfaithful to his wife and saying, “There is no excuse. I am deeply sorry.”
•
Takes full responsibility: He emphasized that his family was not responsible for his choices and that all the blame was his. He also asked
NVDA+2.80%
KALSHI+0.00%
Price Breaks Below 74,000—Will It Keep Falling?

Prices broke below 74,000 in the early hours of the morning, then quickly recovered. They’re currently trading around 75,000. There have been too many exchange incidents lately, sparking panic among many people. Then, in the early hours, news broke that NVIDIA CEO Jensen Huang had an affair, triggering a dramatic $650 billion reversal in the U.S. stock market in just seven minutes.

In terms of price action, this pullback has been deep enough. Technically, the price broke below the key 74,000 support level, triggering stop-losses on a large numb
post-image
NVDA+2.80%
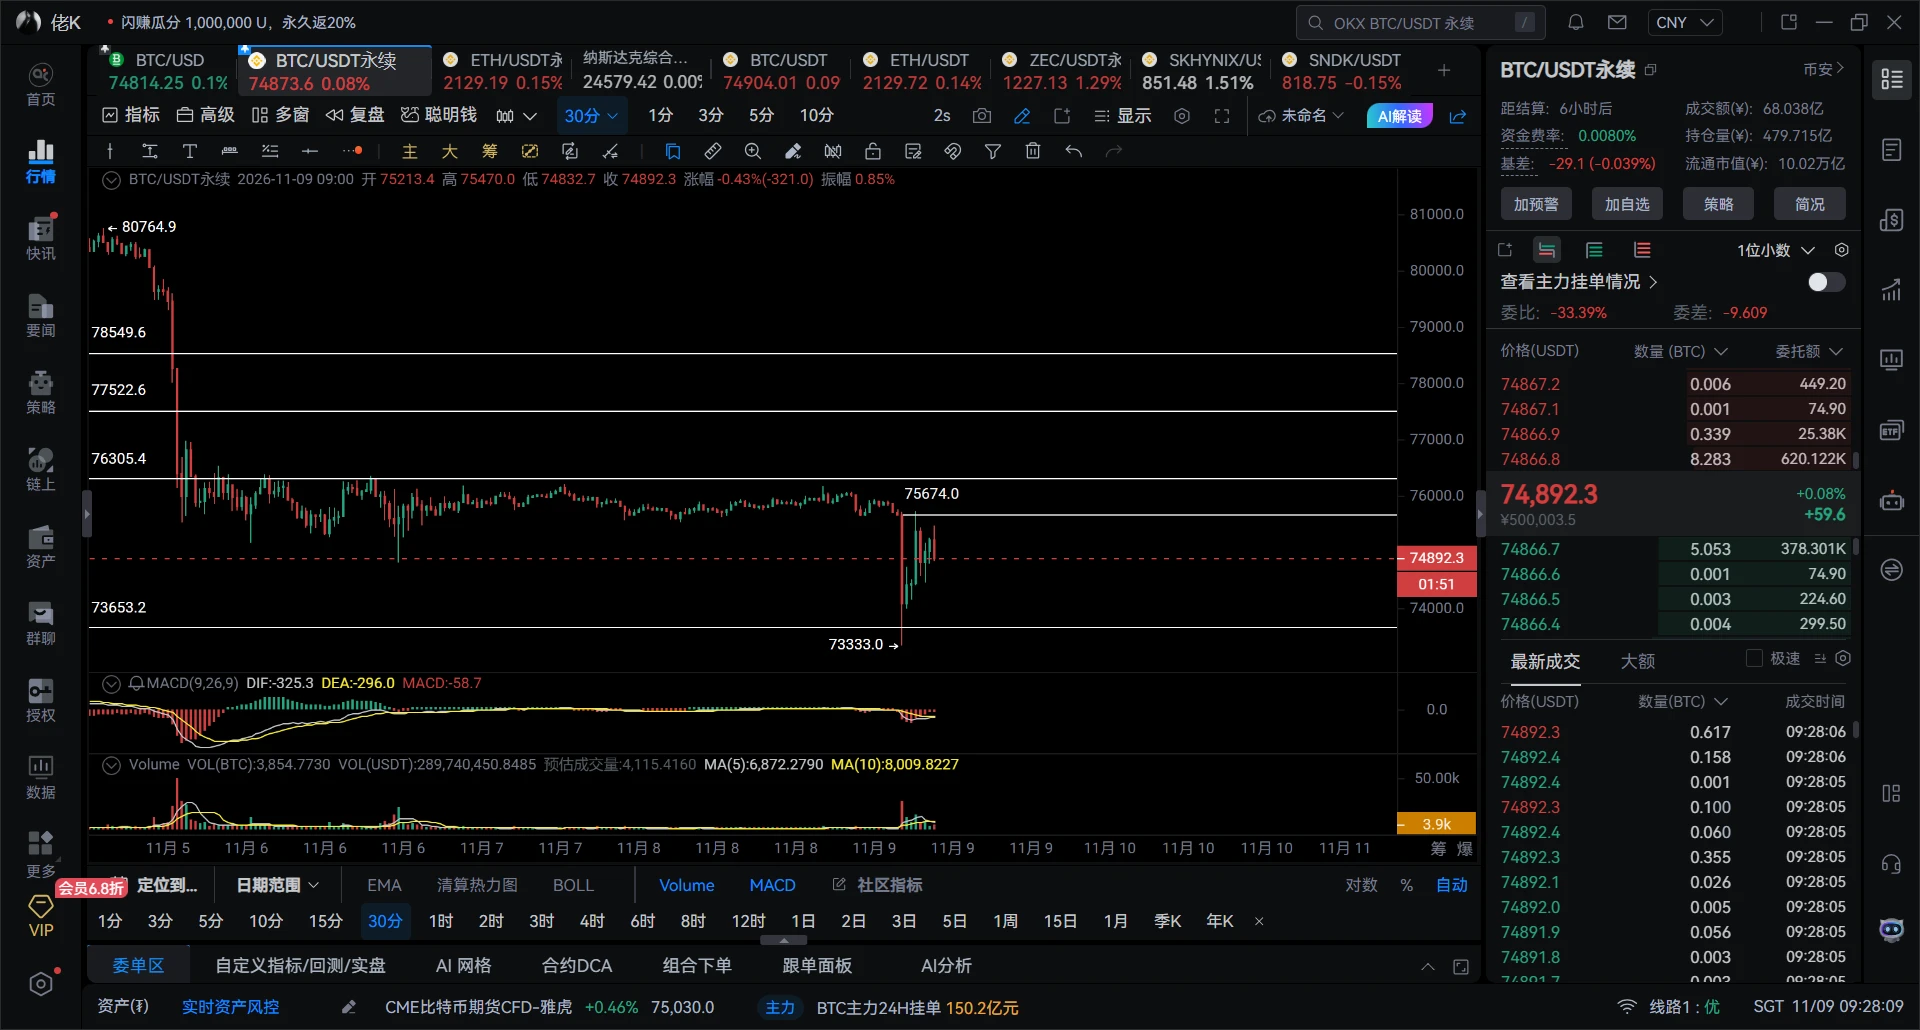
11.9 BTC Market Analysis
Bitcoin monthly hidden divergence; the weekly chart shows a MACD death cross (watch for inversion risk)
5-day/3-day charts: short at highs 2-day chart has fallen below zero This move is mainly a door-shaped selloff driven by the 6/8-hour below-zero rebound 1-hour hidden divergence; intraday, wait for a 15/30-minute setup to form before trading
Intraday resistance: 75674 76300 76800
Intraday support: 74476 73653 72778
‍$BTC
post-image
BTC-0.65%
Load More

Join 40 M users in our growing community

⚡️ Join 40 M users in the crypto craze discussion

💬 Engage with your favorite top creators

👍 See what interests you

Trending Topics

BTCFlashCrash

11.44k Views65.98k Discussing

$BTC suffered a sharp flash crash, briefly falling to $73,510 within 15 minutes before rebounding. Around $745 million in crypto positions were liquidated within one hour, including roughly $715 million in long positions. Was this simply a leverage flush, or the start of another leg lower? The $73K–$75K area could become a key support zone to watch next.

USCPIDataIncoming

21.09k Views1.71k Discussing

USAIStocksHitHard

31.15k Views3.75k Discussing

View More