Share your thoughts
placeholder
Article
crypto market update
live-cover
LIVE703
Good news on employment, but wages aren’t hot—the data alone won’t decide whether the Fed hikes in September
Nonfarm payrolls beat expectations by 3x, sending the probability of a September rate hike from 51% to 62%. But on closer inspection, things aren’t that simple.
The most subtle point is the “mismatch”—good employment news, but wages aren’t hot. Average hourly earnings rose just 3.1% year-on-year, the slowest pace since the COVID-19 pandemic, and have already fallen behind inflation. What is the Fed’s purpose in hiking rates? Inflation. If wages aren’t rising, where would cost-push infla
NVDA+0.87%
#GateEventContractTradeSharingChallenge
#XAU Gold Is Sitting at the Decision Zone
Gold is not giving a clean bullish signal yet.
The interesting part is that buyers managed to recover gold from the early-September selloff, but Friday’s U.S. jobs data immediately reminded the market why the upside is still difficult. Right now, XAU/USD is sitting close to the middle of a very important battle zone.
Current Market Snapshot
Spot gold: $4,429.10/oz
24h change: -0.96%
Latest available range: $4,365.80–$4,491.30
Market status: Weekend closed
Spot volume: Not reliably available while the market is c
post-image
XAU-0.24%
BTC-0.42%
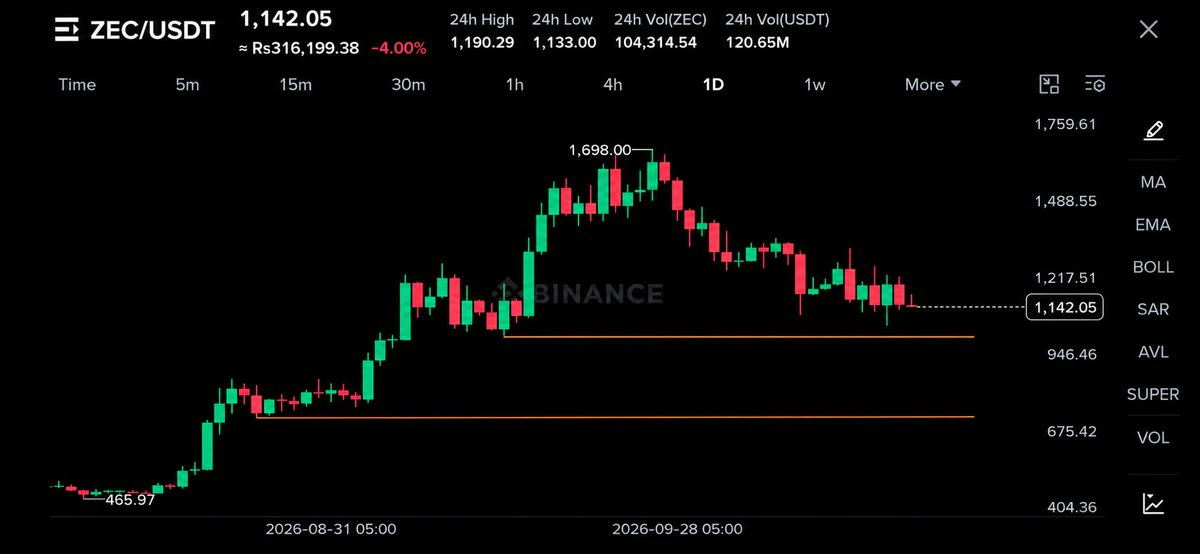
#ZEC How to View ZEC After Breaking Above $1,200

Let’s start with the most compelling point in the bullish narrative: ZEC’s all-time high was actually $5,941 in 2016—the current $1,193 is still about 80% below its ATH. Against the backdrop of continued ETF inflows, the market can fully tell the story that “a decade high is just the beginning, with a return to the ATH ahead.” ZEC’s ETF assets under management have surpassed $400 million, SMA-200 is providing strong trend support near $440, and the daily structure remains healthy.

But in terms of pace, the risk is accumulating rather than di
post-image
ThisIsTranslateContent:
#ZEC How should we view ZEC after it broke above $1,200?
First, the most compelling point in the bullish narrative: ZEC's all-time high was actually $5,941 in 2016—the current $1,193 is still about 80% below its ATH. Against the backdrop of continued ETF inflows, the market can fully tell the story that a ten-year high is only the beginning and that ZEC is returning to its ATH. ZEC's ETF assets under management have surpassed $400 million, while the SMA-200 near $440 provides strong trend support, and the daily structure remains healthy.
But in terms of momentum, the risk is accumulating rather than dissipating:
First, the squeeze fuel is nearing exhaustion. On top of OI tripling from $700M to $2B, shorts have been squeezed for two consecutive days. The remaining horsepower of this engine is rapidly declining—once the shorts are fully cleared out, a vacuum in buying pressure will emerge.
Second, the pace of the rise has shifted from "violent" to "out of control." ZEC broke above $1,000 on Thursday (+20%) and went straight to $1,200 today (+17.8%). A 40% two-day slope has historically almost never occurred without a sharp pullback. The price is tracking a parabola, and every parabola eventually breaks.
Third, sentiment has already overtaken demand. PANews' review of the previous ZEC surge concluded that it "began with demand and ended with sentiment"—the share of privacy transactions fell rather than rose after the surge, indicating that capital speculation, rather than real usage, was driving the price. This round has a stronger demand base thanks to the ETF, but the slope from $1,000 to $1,200 is clearly being driven by sentiment.
Key levels
Upside: $1,200 has just been breached. The next round-number level drawing market attention is $1,500, followed by the 2016 ATH of $5,941 as the "narrative level."
Downside: $1,000 is the lifeline of this rally; a break below it would mean the squeeze-driven move is over. $1,100 is the first short-term support.
Conclusion
The medium-term logic (ETF + privacy narrative + ten-year high) remains intact, and this rally has not been invalidated. But the 40% gain in two days has turned the question of "how much further it can go" into whether it will "pull back first and then continue" or "finish the move directly."
So: Above $1,200 is a high-volatility zone, where the probability of wide-range consolidation or a rapid wick is far greater than that of a continued one-way surge. $ZEC
repost-content-media
ZEC+16.41%
  • 2
  • 1
#‌$NVDA NVDA AT $231: NVIDIA REMAINS ONE OF THE STRONGEST AI STOCKS — FULL MARKET ANALYSIS, NFP IMPACT & TRADING PLAN
NVIDIA remains one of the most powerful names in the global technology market, and in my view NVDA continues to deserve serious attention because the AI infrastructure story is far from finished. With NVDA around the $231 area, the stock is sitting in an important decision zone where momentum, fundamentals, AI demand, macroeconomic pressure and valuation are all coming together. The latest verified Friday close was approximately $230.36, after NVDA traded as high as $234.76 and
post-image
Altcoin Open Interest is picking up again 👀
Part of the overall increase is coming from TradFi linked tickers, but momentum is clearly spreading across the altcoin market.
$SOL , $BNB , $ARB , $XRP , $ETH and $ZEC have all recorded rising OI over the past few days.
Traders are gradually increasing their exposure.
post-image
SOL+2.28%
BNB-3.70%
ARB+38.69%
XRP-0.59%
ETH+0.51%
$ARB Signal】1H bearish engulfing + 4H profit-taking pullback, targeting pullback confirmation
$ARB RSI(4H) 73, buying momentum is easing; macd_1h green bars expanding, valuation correction pressure emerging. Order-book selling pressure imbalance -9.32%, with aggressive buy orders accounting for less than half of trading volume. Signs of fund support appear at 0.1847-0.1853.
🎯Direction: long
⚡Entry/limit order: 0.18476 - 0.18532
🛑Stop-loss: 0.17605
🚀Target 1: 0.19921
🚀Target 2: 0.20616
🛡️Trade management:
- After reaching Target 1, reduce the position by 50% and move the stop-loss up to b
post-image
ARB+38.69%
A few days ago, I was still calculating whether I had enough money for instant noodles this month; this morning, I was already wondering whether to add a sausage. The last thing I saw before bed was $TAO holding steadily at the lows, with volume shrinking while key levels kept moving higher. The funds came in quietly, not with a big commotion.
Following the bullish direction at the time, I placed an order at 225.0. The logic was straightforward: hold above support on the pullback and form a base without breaking down. Positions at this level are easy to hold, the stop-loss is close, losses are
post-image
TAO+8.52%
ADA+0.09%
BTC-0.41%
#SKHynix
SK hynix remains one of the strongest names in the global AI-memory and semiconductor story, and at the current price of 1,285, the stock still has an interesting risk-to-reward setup if the broader technology and semiconductor trend remains supportive. The company is not simply benefiting from a temporary increase in chip demand; it is positioned directly inside the structural expansion of AI data centers, high-bandwidth memory, advanced DRAM and next-generation HBM4.
The fundamental picture is particularly impressive. SK hynix reported record Q2 2026 revenue of 79.3187 trillion won
post-image
SK Hynix+3.19%
MU+5.89%
I wasn’t expecting this move to hold anyway, but the market directly handed me a big gift in the form of a short position. Now that’s what I call great service.
When I checked the charts after lunch, $COLLECT was still stubbornly holding up, but every rebound looked increasingly weak, with volume shrinking each time while the sell orders showed no mercy. With fewer and fewer buyers stepping in, I knew it was time to act. I entered a short around 0.06470 and left the rest to time.
The current price has now slipped to 0.04253, pushing the return to +674.69%. This profit feels great; even the lo
post-image
COLLECT-34.51%
ZEC+16.71%
LAB-2.88%
🚨 $UNI /USDT BULLISH BREAKOUT RETEST & CONTINUATION
📊 TRADE SETUP OVERVIEW
Pair: $UNI /USDT
Direction: LONG / BUY
Leverage (Futures): 3x – 5x
🎯 KEY LEVELS & SIGNAL PARAMS
Entry Zone: $6.850 – $7.000
Take-Profit Targets:
🎯 TP1: $7.480
🎯 TP2: $7.850
🎯 TP3: $8.350
Stop-Loss (SL): $6.500
$UNI ‌#Gate60MillionUsers
post-image
UNI+7.62%
  • 8
  • 2
Robinhood season… Oh yeah😢😭🤣
-98% Can i make a comeback🤣🤣🤣
NFA
post-image
HOOD-2.12%
these paws need love too
post-image
#Gate60MillionUsers
💙 My Gate Journey — An Opportunity That Became a Journey
I joined Gate on January 5, 2025, and at that time, I had no idea how much this platform would become a part of my journey. I started with streaming, and it was a really good time for me. Through content mining, different projects, campaigns, and other opportunities on Gate, I was able to earn while continuously learning and improving my skills. Every new opportunity gave me a reason to explore something different and keep growing.
What I appreciate most is that Gate has continued to create opportunities for its use
post-image
These returns have me feeling nervous, worried that the market will come to its senses tomorrow and blacklist me.
When I opened the chart this morning, it was still grinding sideways. The key was that the bottom held, while volume was quietly picking up and signs of funds entering were all too obvious. With a signal like that right in front of me, not taking it would have been letting all those late nights down. So I entered directly at 91.82, set my stop-loss, closed the software, and went back to work.
When I returned to my computer, the price had already reached 103.5, with the position’s r
post-image
ADA+0.09%
SNDK+0.20%
Financial News, Crypto Updates, Real-World Strategies
live-cover
LIVE1,291
Everyone’s long SNDK while the 4h chart screams one thing they refuse to hear.

$SNDK /USDT - SHORT

Trade Plan:
Entry: 1766.91 – 1771.77
SL: 1792.64
TP1: 1751.87
TP2: 1740.22
TP3: 1722.75

Why this setup?
Don’t fight the range—trade the fade.
- RSI 15m at 41.39 shows early downside momentum, not exhaustion.
- Price pinned at 1769.34, mirroring the 1h reference—this is a liquidity grab zone.
- ATR 1h at 9.7 means moves are tight: TP1 at 1751.87 is a 1% drift, not a dream.
- Why now? The 1D trend is flat, so shorts win when they strike the midpoint, not the edges.

Debate:
Is SNDK f
SNDK+0.20%
$ZIG caught my attention today.
A strong push took it above $0.05, and now it’s holding around that level instead of giving the move straight back.
That’s the part I like.
If buyers step in and $0.055 gets taken out cleanly, I wouldn’t be surprised to see $ZIG start moving much faster. 👀
Not chasing. Just watching closely.
#ZIG @ZIGChain
post-image
ZIG+9.64%
#BTCReclaims80K
BTC Reclaims 80K: Full Market Analysis, September 6 2026
Bitcoin is standing right on the psychological 80,000 line again. Early Saturday September 6, BTC trades near 79,980 on spot markets, up about 0.4 percent in 24 hours after tagging 80,200 earlier in the session. The reclaim story is not clean: BTC broke back above 80K on Wednesday, lost it violently on Friday's jobs report, and is now rebuilding above 79,500. That two-step-forward, one-step-back rhythm says it all: the institutional bid is real, but macro headlines still hold the steering wheel.
The weekly scoreboard put
  • 1
#BTCReclaims80K
Bitcoin Back Above $80K - What The Chart Is Actually Showing
Bitcoin is trading at $79,933.9 after pushing back above $80,000 for the first time since late August. The daily high printed at $80,198.7 and the low at $79,445.6. That leaves a tight $753 range right around the big round number.
Perps are right with spot at $79,900.1, up 0.42%, while spot is up 0.43%. Volume is light at 2.32K BTC with $184.86M turnover. No blow-off, just steady buying into resistance.
The setup on the chart
On the 1-day view the moving averages are stacked bullish. EMA5 is at $79,573.6, EMA10 at $7
post-image
BTC-0.42%
Load More

Join 40 M users in our growing community

⚡️ Join 40 M users in the crypto craze discussion

💬 Engage with your favorite top creators

👍 See what interests you

View More