Square
Following
Hot
News
Notifications
Profile
Share your thoughts
placeholder
Article
Just fed a family of three for $10 at @SamsClub 🍕
post-image
Trenches
mihao
m
bade
b
mihao
4Cxj...pump
Market Cap
$.
Change
.
24h Vol
$.
Holders
.
Snoopy
S
bade
b
Snoopy
7mEh...47Cn
Market Cap
$.
Change
.
24h Vol
$.
Holders
.
IDOL
I
bade
b
IDOL
0x3b...ab07
Market Cap
$.
Change
.
24h Vol
$.
Holders
.
NIO
N
bade
b
NIO
7SL2...pump
Market Cap
$.
Change
.
24h Vol
$.
Holders
.
AGT
A
bade
b
AGT
0x5d...e274
Market Cap
$.
Change
.
24h Vol
$.
Holders
.
$H Now at 0.0179, down 24% over 24 hours, with a low of 0.0177—only two wicks below the current price. The 13.4M trading value shows this isn’t retail investors cutting losses; real money is changing hands.
Intraday action was decisive: some were still holding above 0.022 in the morning, but in the afternoon the price broke down and accelerated. Each rebound was weaker than the last—a classic cascade of panic selling compounded by stop-loss orders. At this level, 0.0177 is the floor that bulls and bears have repeatedly tested today. Trading around it is more reliable than trying to guess the b
  • 1
  • 1
i just arrived in London
who’s there already?
post-image
📊 U.S. initial jobless claims exceed expectations—are hopes for rate cuts back?

Initial jobless claims rose to 200k in the latest week, above expectations of 194k, showing signs of a slight cooling in the labor market.

But the thing is, 200k is still historically low. 👀

📉 Optimists: The labor market is starting to cool, which may ease pressure on the Fed to keep rates high.

📈 Cautious observers: CPI just came in hotter than expected, inflationary pressure remains, and one week of employment data is not enough to change the policy outlook.

With a cooling labor market and stubbornly hig
post-image
BTC-0.67%
$AIO I took a real 7,800U loss on this move, holding from 0.041 all the way down to 0.033 before finally cutting my losses. That tuition hurt. Looking back at the data: down 17.93% in 24h, with a low of 0.0313 and only 3.7M in trading volume—liquidity was so thin that chasing the price higher was asking for trouble. Here’s the turning point: clear buy-side support appeared around 0.0313, and the current price of 0.0322 has moved off the bottom. Signs that the downside may be exhausted are clearer than yesterday. Trading plan: scale in between 0.0315 and 0.0320, keep the position below 20%, and
AIO-3.19%
  • 2
$ENA is currently at 0.1193, down 12.34% over 24H. The 1H trend is weak, with EMA20 at 0.1266 and RSI at 20.5; resistance is at 0.1377 and support at 0.1181. The 4H trend is weak, with EMA20 at 0.1355 and RSI at 13.9; resistance is at 0.157 and support at 0.1181. If it holds above the 0.1377 resistance, watch for a rebound; a break below the 0.1181 support would mean continued weakness. Review whether it can hold above 0.1377 and recover after losing 0.1181. Volume is only 0.17x the average, so confirmation from trading volume is needed. The market is volatile; for observation only.
post-image
ENA+8.04%
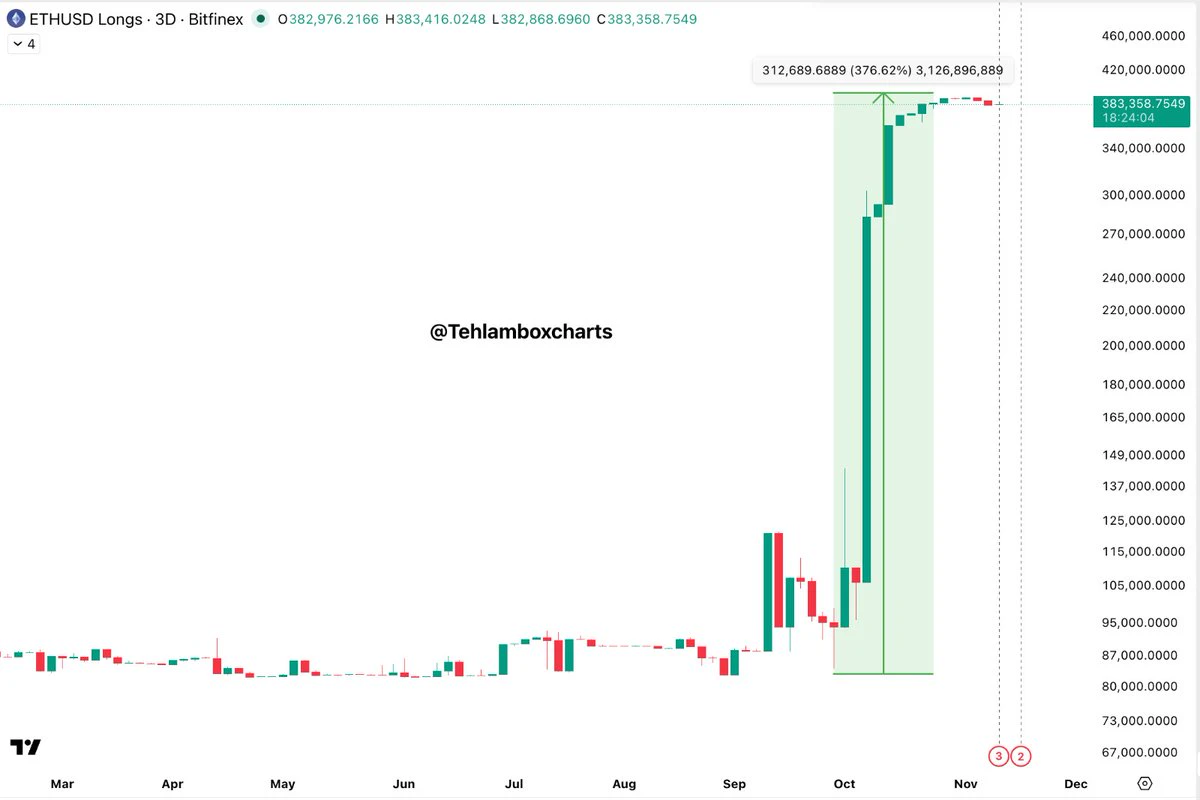
ETH longs are absolutely LOADED
Everyone seems to be betting on $ETH going higher
Either these traders are seeing something the market hasn’t priced in yet, or we’re building a liquidation party
Are you comfortable being long when everyone else is?
post-image
ETH-1.23%
🐋 WHALE WATCH : Moodys ran a testnet credit ratings pilot on Chainlink.
One of the three major ratings agencies tested core financial infrastructure on $LINK . Thats not a partnership announcement or a letter of intent they built something and ran it.
What would move you from watching to holding ?
post-image
LINK-0.18%
Gm everyone ☀️
This market is trash.
post-image
$BOME Finally got to a 4-handle, but unfortunately I sold too early last time and missed a lot of opportunities
post-image
BOME-2.46%
Nuclear Power Developers Attract Fresh Funding From Technology Investors
live-cover
LIVE542
#USJoblessClaimsBeatExpectations

The weekly data on jobless claims in the United States opens with a headline above hopes, yet the whole data shows that the labor market stayed strong against fear, and for this reason the market reads the data not as a sign of decay, but as a sign of resilience.

By the data released on 12 November, initial claims rose by 9,000 to the 200,000 level in the week ending 7 November, the prior week data first shown as 189,000 was revised to 191,000, hopes were at the 195,000 level, and this picture shows that initial claims came in above hopes.

On the continuing
post-image
US500+0.00%
GER40+0.00%
EURUSD+0.00%
USDJPY+0.00%
USDTRY+0.00%
  • 8
  • 1
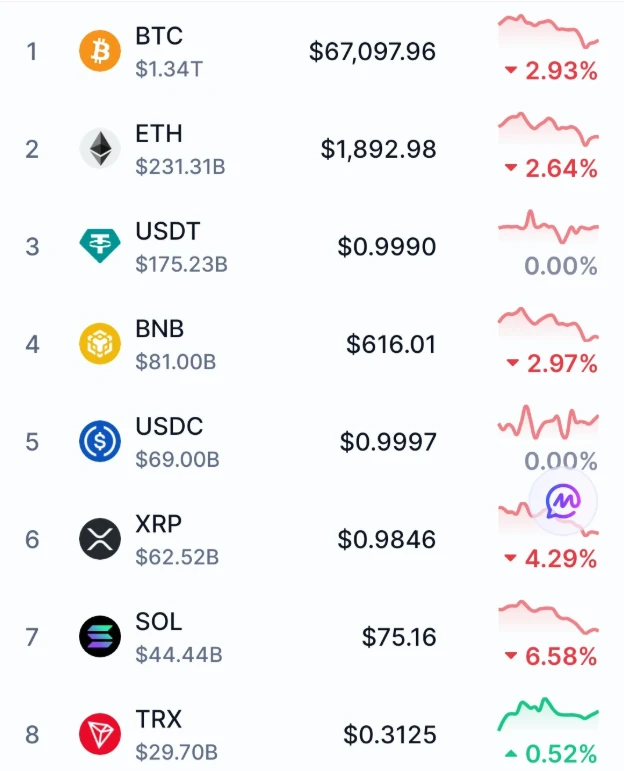
🐋 WHALE WATCH : $BTC broke below $67K. $ETH below $1900. $SOL below $75. $XRP below $1.
$330M liquidated in two hours. Selling pressure is holding.
Stay sharp.
post-image
BTC-0.65%
ETH-1.23%
SOL-0.74%
XRP-1.12%
March, July, November
We have already experienced many moments like this in 2026.
post-image
India sold 52 metric tons of gold during Diwali. Wedding season and a pullback in prices have sent demand surging. With gold at these levels and physical buying this strong, buyers are stepping in on dips, so don’t rush to turn bearish. Maybe I’m wrong and I’ll end up eating my words.
post-image
GLDX-0.40%
PAXG+0.37%
  • 2
  • 2
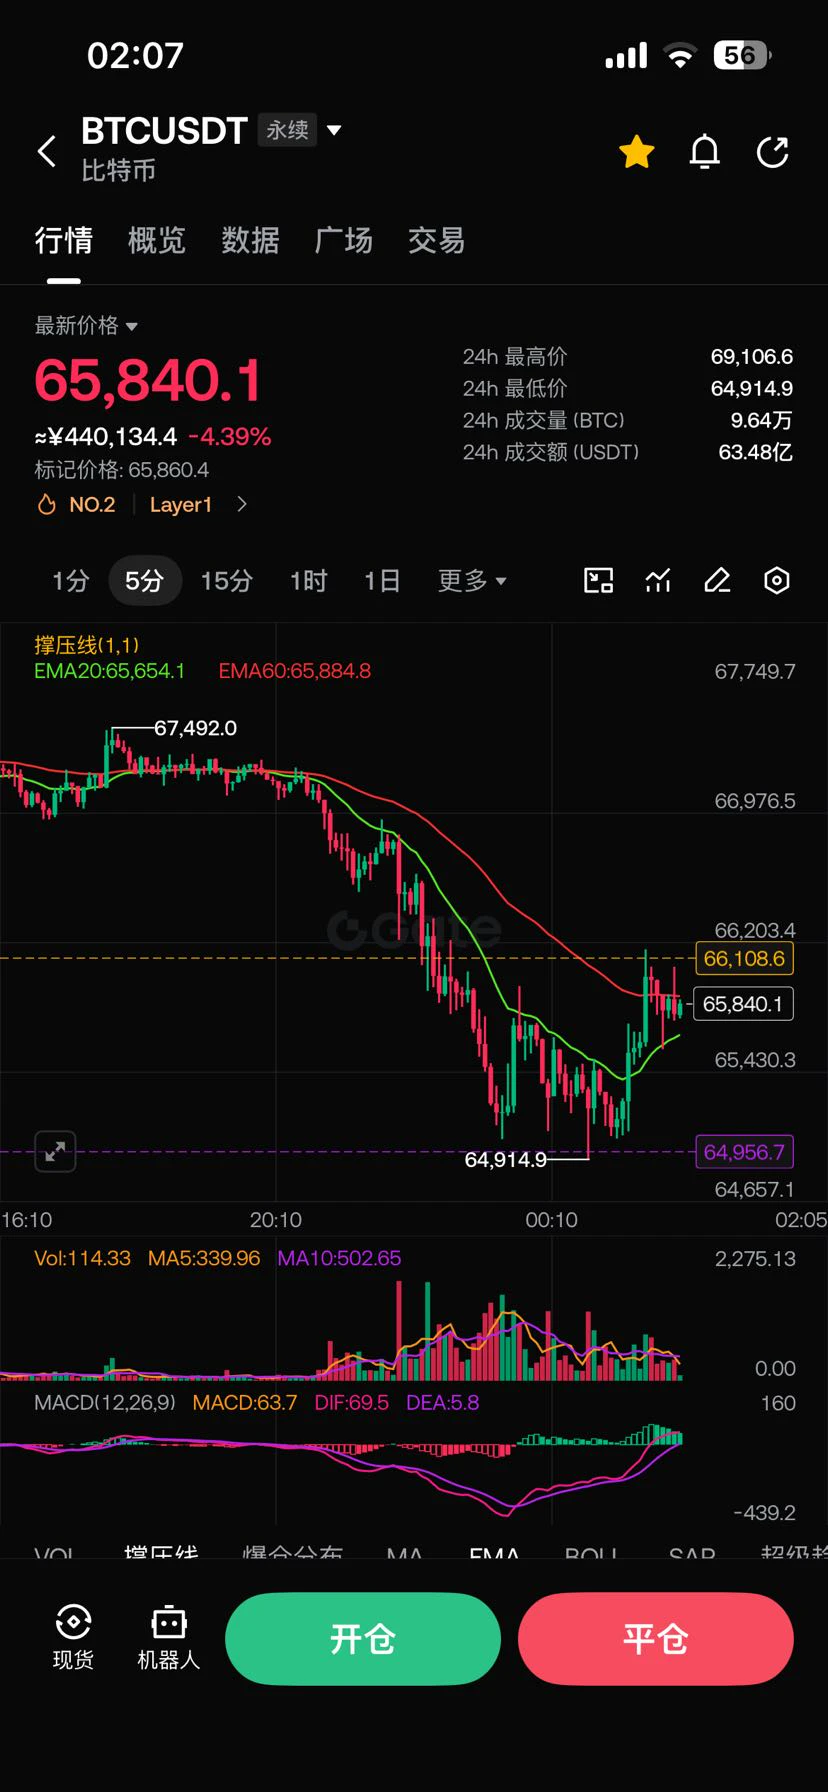
I missed the bottom, so I just think 65000 is a temporary bottom
post-image
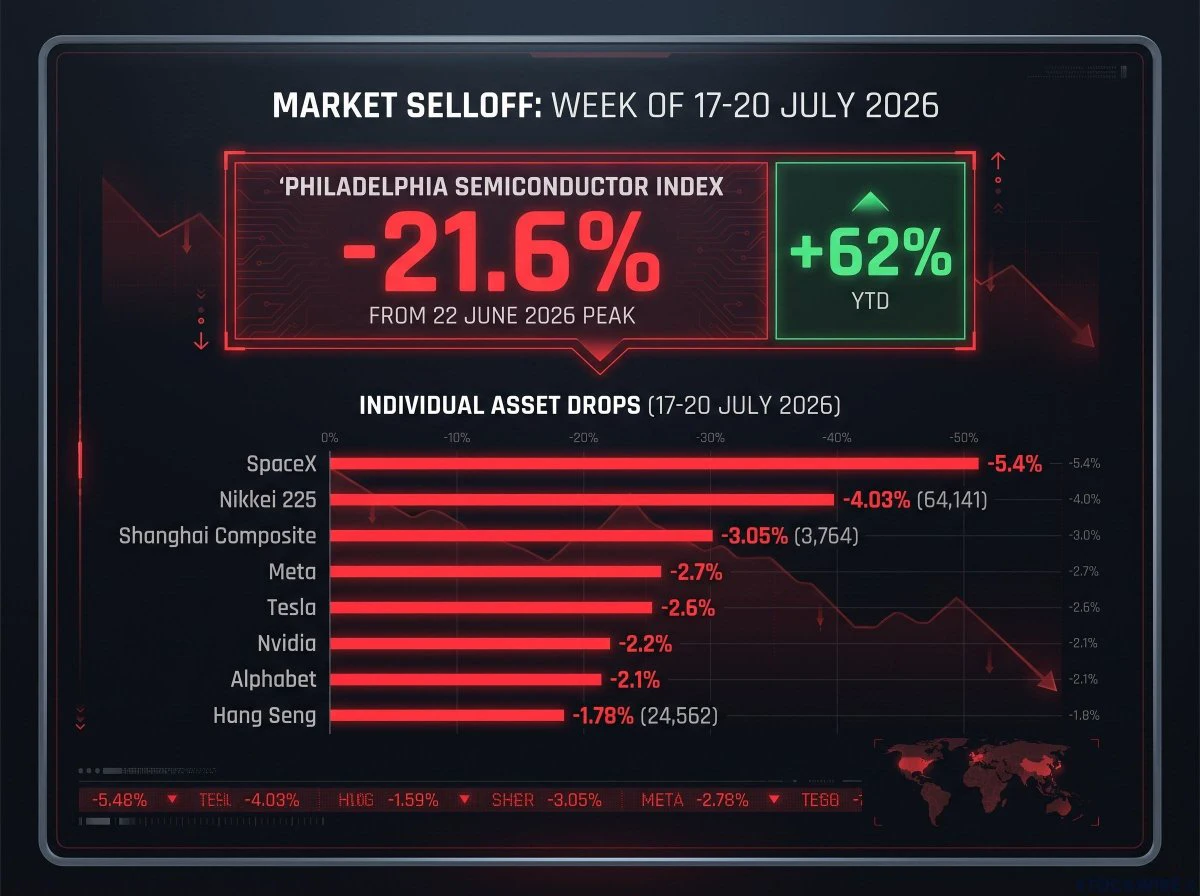
Global Markets Watch Bitcoin and Chipmakers for Signs of Recovery
live-cover
LIVE367
Just Ordered this Strawberry Hipper Sonny $ANGEL 🍓
Isn’t it cute? 🥰
post-image
Load More

Join 40 M users in our growing community

⚡️ Join 40 M users in the crypto craze discussion

💬 Engage with your favorite top creators

👍 See what interests you

Trending Topics