
Square
Following
Hot
News
Notifications
Profile
Share your thoughts
placeholder
Article
#KoreanStocksJumpOver5% KoreanStocksJumpOver5

Korean Stocks Jump Over 5% as Investor Confidence Returns to the Market

South Korea's stock market has attracted significant attention after Korean stocks recorded gains of more than 5%. This strong upward movement has become an important development for investors who are closely watching Asian financial markets. A rally of this size can reflect improving market sentiment, renewed buying interest, and changing expectations about the global economic outlook.

The Korean stock market plays an important role in the global financial system, especiall
  • 4
  • 1
Based on my analysis, it may rebound to the 1,000-point level during a technical recovery. $SNDK
post-image
SNDK-0.18%
Trenches
mihao
m
bade
b
mihao
4Cxj...pump
Market Cap
$.
Change
.
24h Vol
$.
Holders
.
PIEVERSE
P
bade
b
PIEVERSE
0x0e...25a9
Market Cap
$.
Change
.
24h Vol
$.
Holders
.
X
X
bade
b
X
9VZe...pump
Market Cap
$.
Change
.
24h Vol
$.
Holders
.
DacityCoin
D
bade
b
DacityCoin
DKYc...pump
Market Cap
$.
Change
.
24h Vol
$.
Holders
.
Dacity
D
bade
b
Dacity
nxPq...pump
Market Cap
$.
Change
.
24h Vol
$.
Holders
.
market updates
live-cover
LIVE1,518
Feature🎁 New week, climb the rankings and win merchandise worth 150 USDT!
Gate Square's comment challenge with prizes is still underway. Start this week with one thoughtful comment 👇

🏆 Engage to make the weekly rankings and take home merchandise
The weekly top-ranked participant will receive exclusive Gate merchandise worth 150 USDT. This week, show off your skills in the comments!

🎉 First comment wins a prize; start chatting now and get rewarded
After signing up, publish your first valid comment on someone else's post to receive a 10 USDT futures position experience voucher.

If you fe
post-image
  • 4
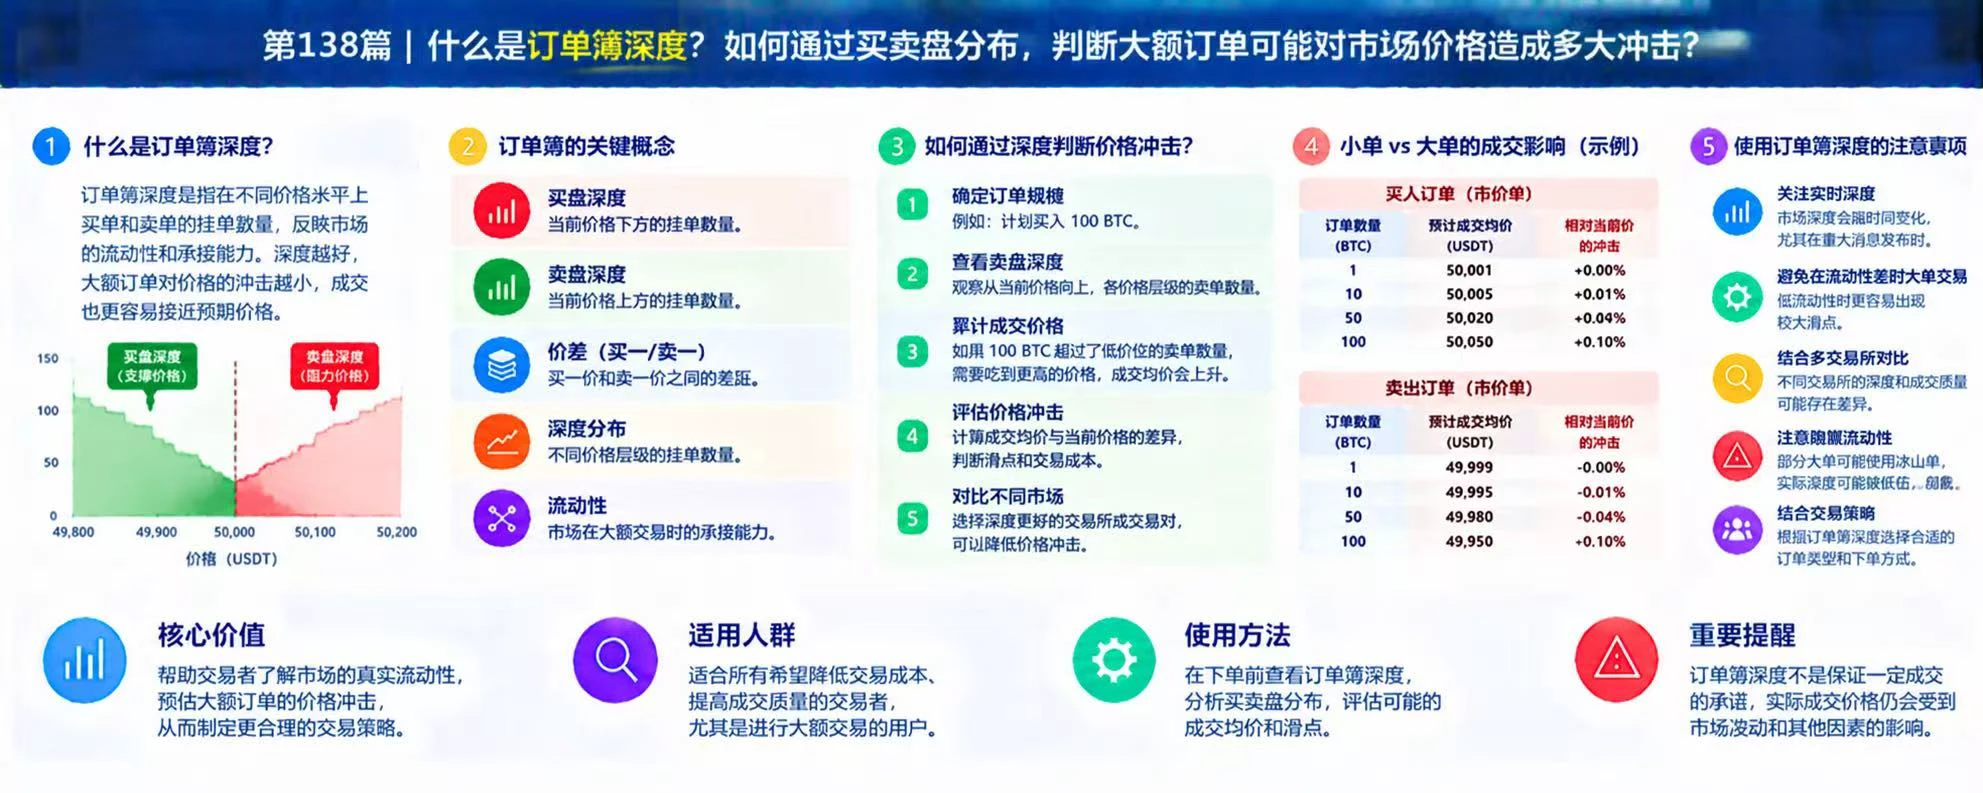
What Is Order Book Depth? How Can the Distribution of Buy and Sell Orders Help Gauge the Potential Price Impact of Large Orders?

In cryptocurrency trading, the latest price shown on screen does not mean all traders can execute at that price. What really affects how large orders are filled is the number of buy and sell orders at different price levels. Order book depth can help traders assess the market’s capacity to absorb trades and the potential price impact of buying and selling.

First, what is order book depth?

The order book records unfilled limit buy and sell orders in the market. Buy
post-image
The model said it had remembered the rules
Put the same constraints in the prompt, and it replied, “Noted.”
[Next round]
Start by asking whether there are any new requirements this time.
[Old rules]
Paste that same passage again.
post-image
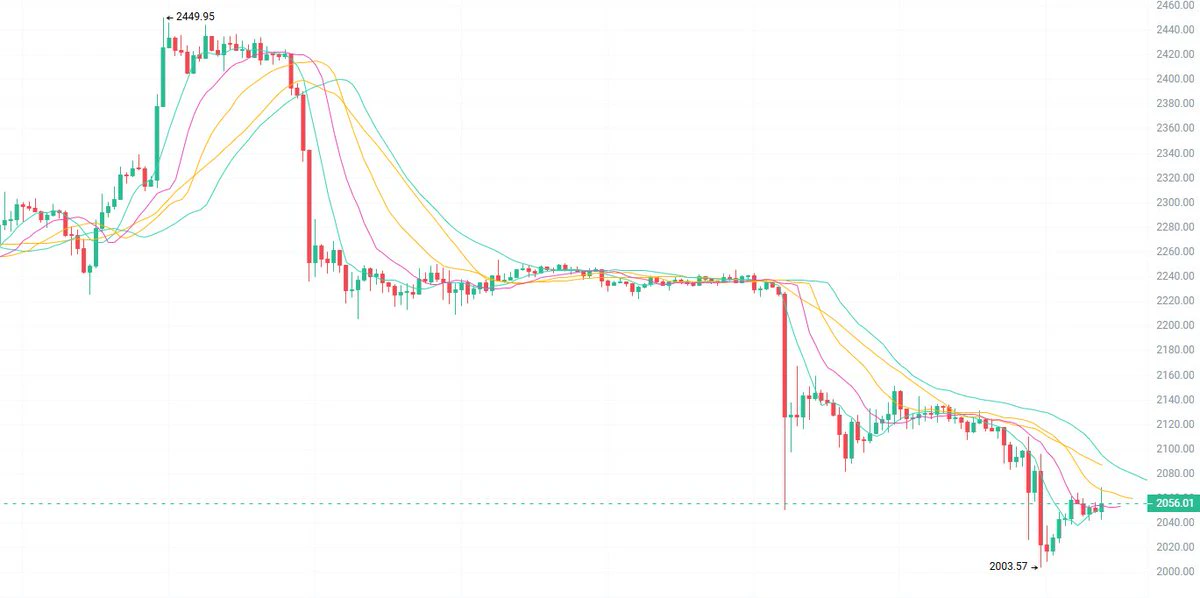
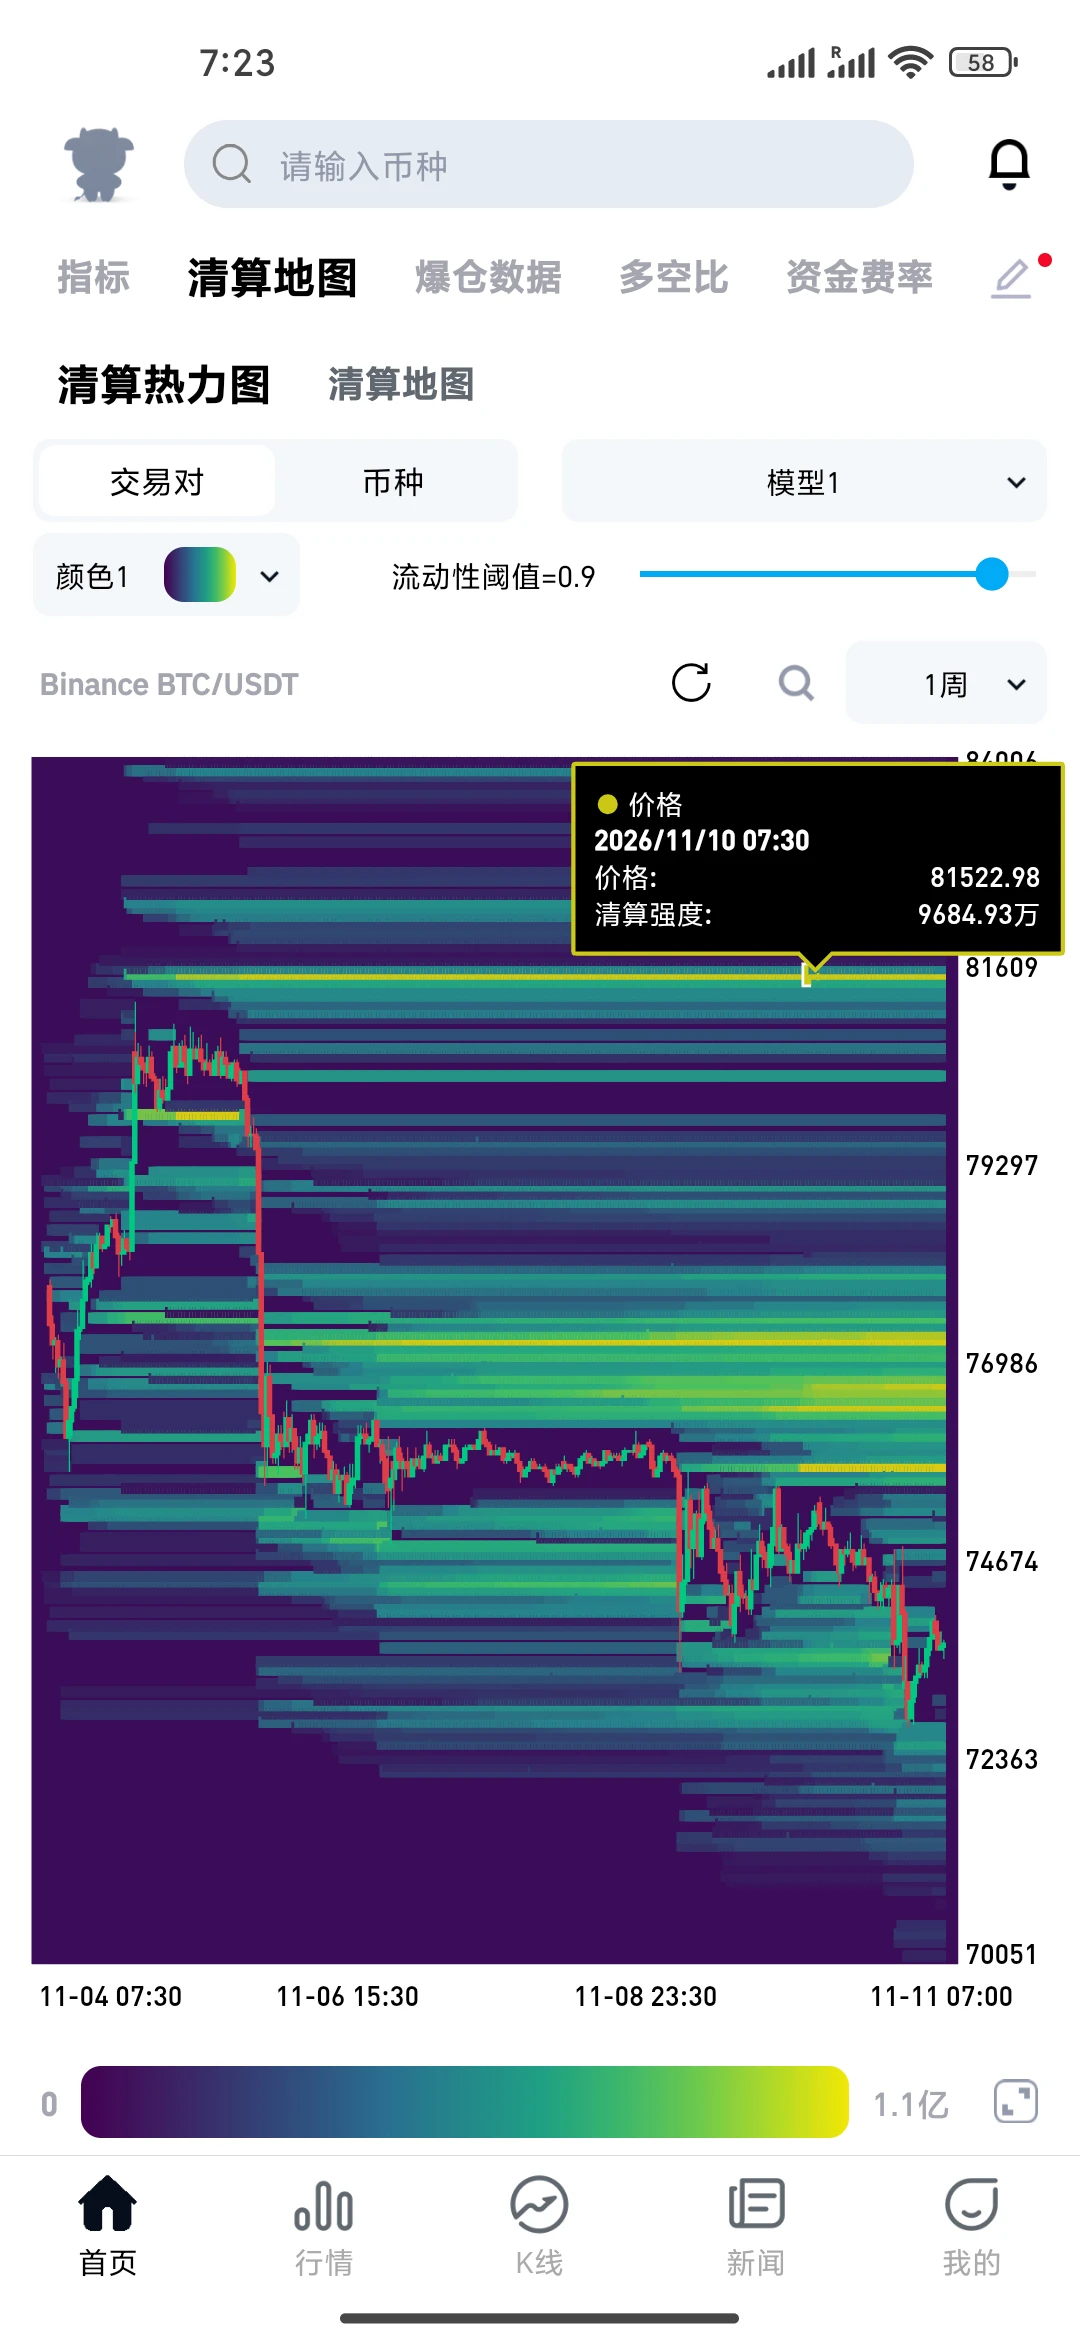
11/11 ETH: The rebound is facing resistance around 2080; look to short, targeting 2020/2000.
For those looking to go long, wait for price to stabilize around 2000 before entering. Risk limit at 1965, targets 2050/2080.
On the 1H chart, price plunged from a high of 2449, then rebounded after a wick down to 2003. It is now consolidating around 2055. The moving averages remain bearishly aligned, with resistance overhead at 2080/2120. Bears still have the upper hand in the short term. $ETH #ETH
post-image
ETH-1.26%
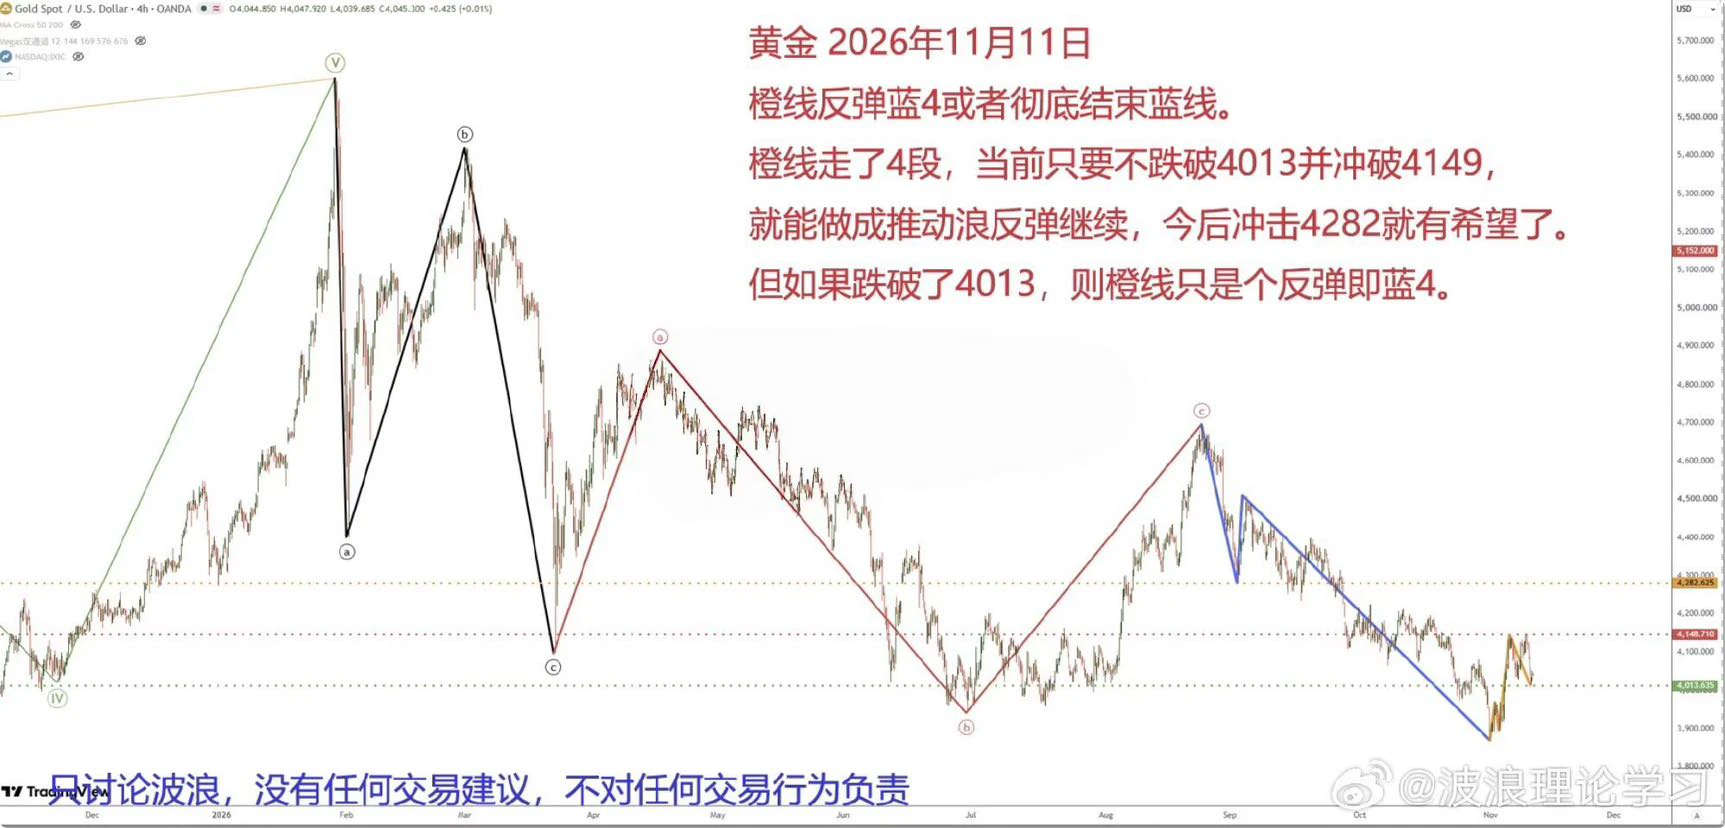
#黄金# Barely held the level last night; it faces another test today. If it can’t hold, it’s still just a rebound. ​​​$XAU
post-image
XAU+0.38%
BTC | ETH | Gold | Crude Oil
live-cover
LIVE1,246
11.11 ETH Silk Road
$ETH
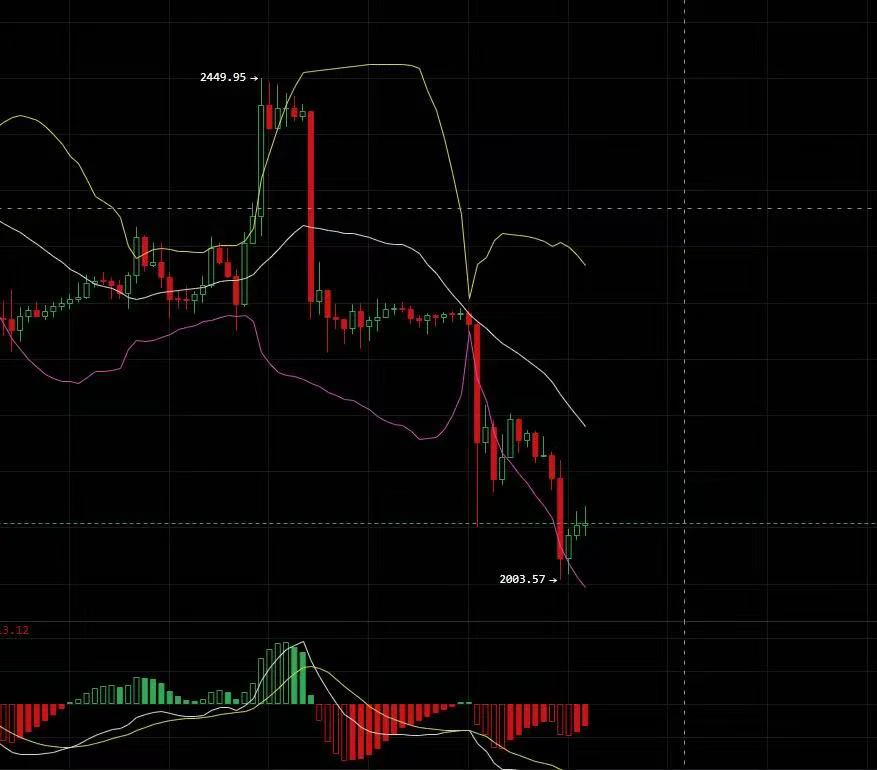
【Market Analysis】
The asset surged to a period high of 2449.95 before coming under pressure and topping out. A long bearish candle broke through the Bollinger midline, completing a direct shift from bullish to bearish structure. The Bollinger Bands opened downward in tandem, and the price continued to decline along the lower band, hitting a low of 2003.57. MACD is below the zero line, with bearish momentum fully unleashed. The current move is merely a slight rebound after a deep decline, a continuation pattern within the downtrend. There is no trend reversal signal on
post-image
ETH-1.23%
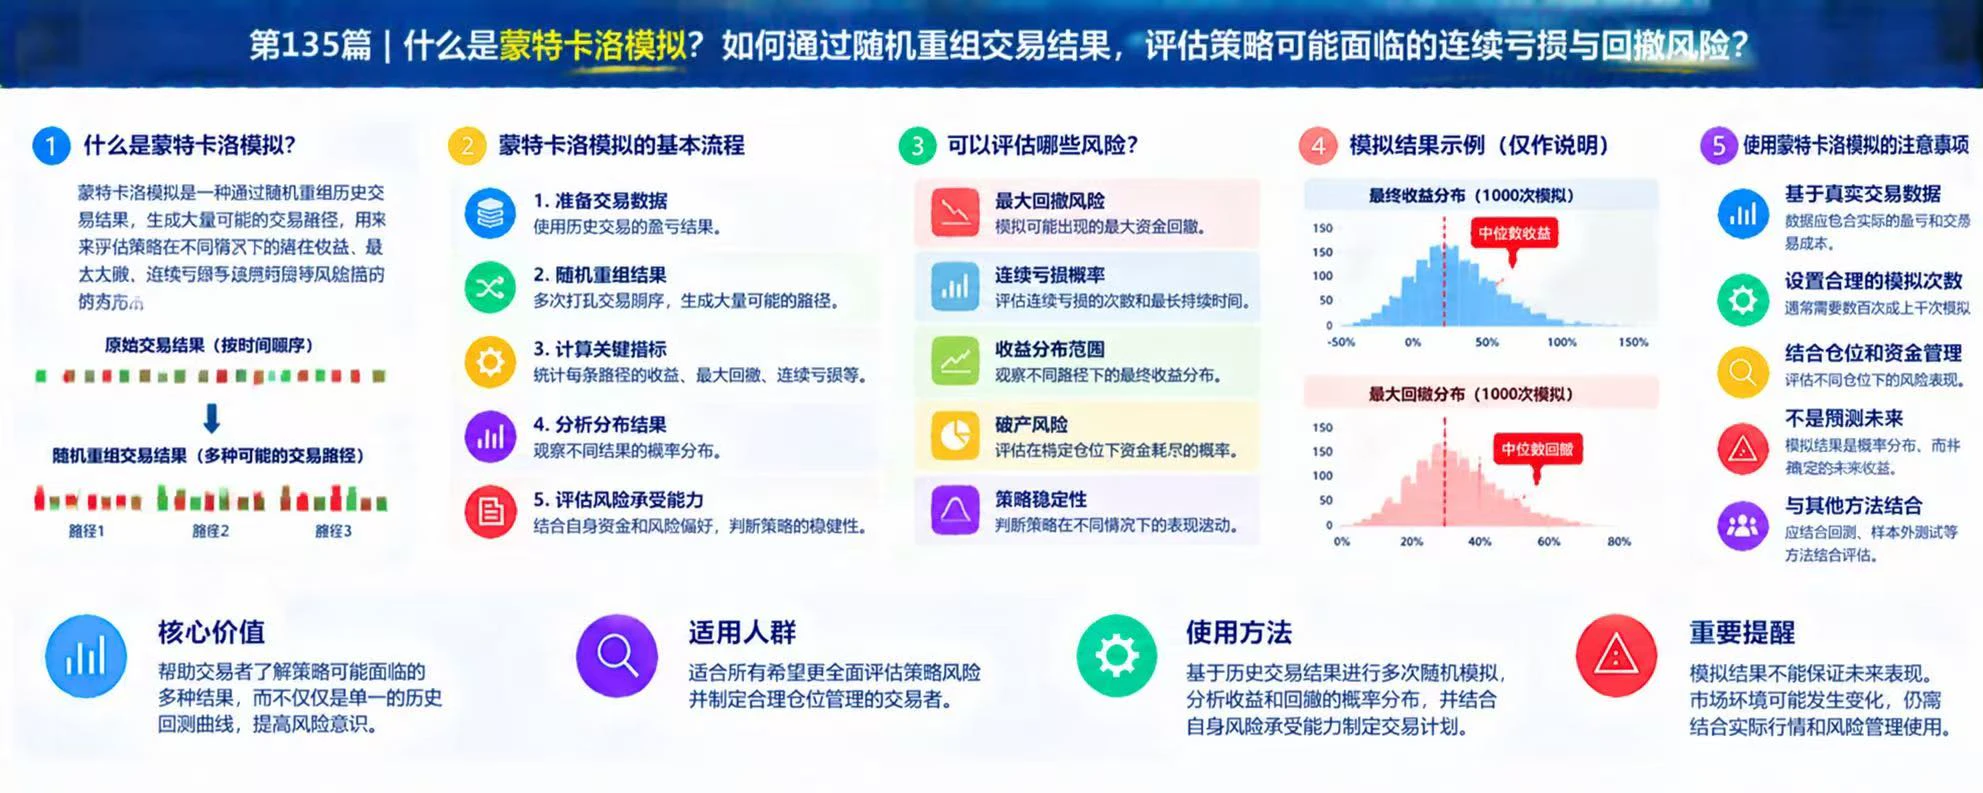
What Is Monte Carlo Simulation? How Can Randomly Reordering Trade Results Help Assess the Risk of Consecutive Losses and Drawdowns?

In cryptocurrency trading, even if a strategy has been backtested and generated positive returns, that does not mean the order of future losses or the equity curve will be exactly the same as in the past. Monte Carlo simulation uses repeated random sampling or reordering of historical trade results to generate many possible trading paths, helping traders understand the risks a strategy may face under different combinations of outcomes.

First, what is Monte Carlo
post-image
NVIDIA: ~$4.1T market cap. AI powerhouse.
$BNB : ~$678. Smart chain king.
$SOL : ~$83. Speed king.
$ETH : ~$2,050. Smart contract king.
$LUNC : $0.000039. 5.5T supply. 2M community.
One of these is not like the others.
post-image
NVDA-5.47%
BNB-0.76%
SOL-0.77%
ETH-1.26%
LUNC-2.74%
  • 1
All those shorts up there must be making a killing, huh? Longs are just fuel? The shorts are absolutely crushing it
post-image
#Gate股票暢聊季 AI hasn’t collapsed; what collapsed is “narrative pricing”

The main shift in this pullback is that AI is moving from a “narrative pricing” framework to “cash flow pricing.” During the transition, the most profitable investments aren’t the purest AI stocks, but the companies that can turn capex into free cash flow.

I. How far have stocks fallen?

The Nasdaq 100 closed at 27,740, down about 14% over three weeks. Last Thursday, it fell 6.36% in a single day, its biggest one-day drop since March 2020; the tech sector shed about $2.5 trillion in a day, and the Magnificent Seven lost a
SPX+0.33%
MSFT-2.15%
NVDA-5.47%
TSM+2.07%
AVGO+3.86%
  • 2
  • 1
#美国10月CPI即将公布 #BTC Bitcoin at $73,416: Inflation Has Changed the Fed Outlook, but Has Buying Demand Returned?

Bitcoin is now facing a different market environment from the one traders expected before the October CPI announcement. The inflation report has arrived, the bond market has reacted sharply, and expectations for another Federal Reserve rate increase have strengthened.

BTC is trading around $73,416** in the latest price snapshot I am using. The important question is no longer simply whether Bitcoin can bounce from $73,000. It is whether buyers have enough conviction to absorb selling
BTC-0.67%
SPX500+0.19%
  • 10
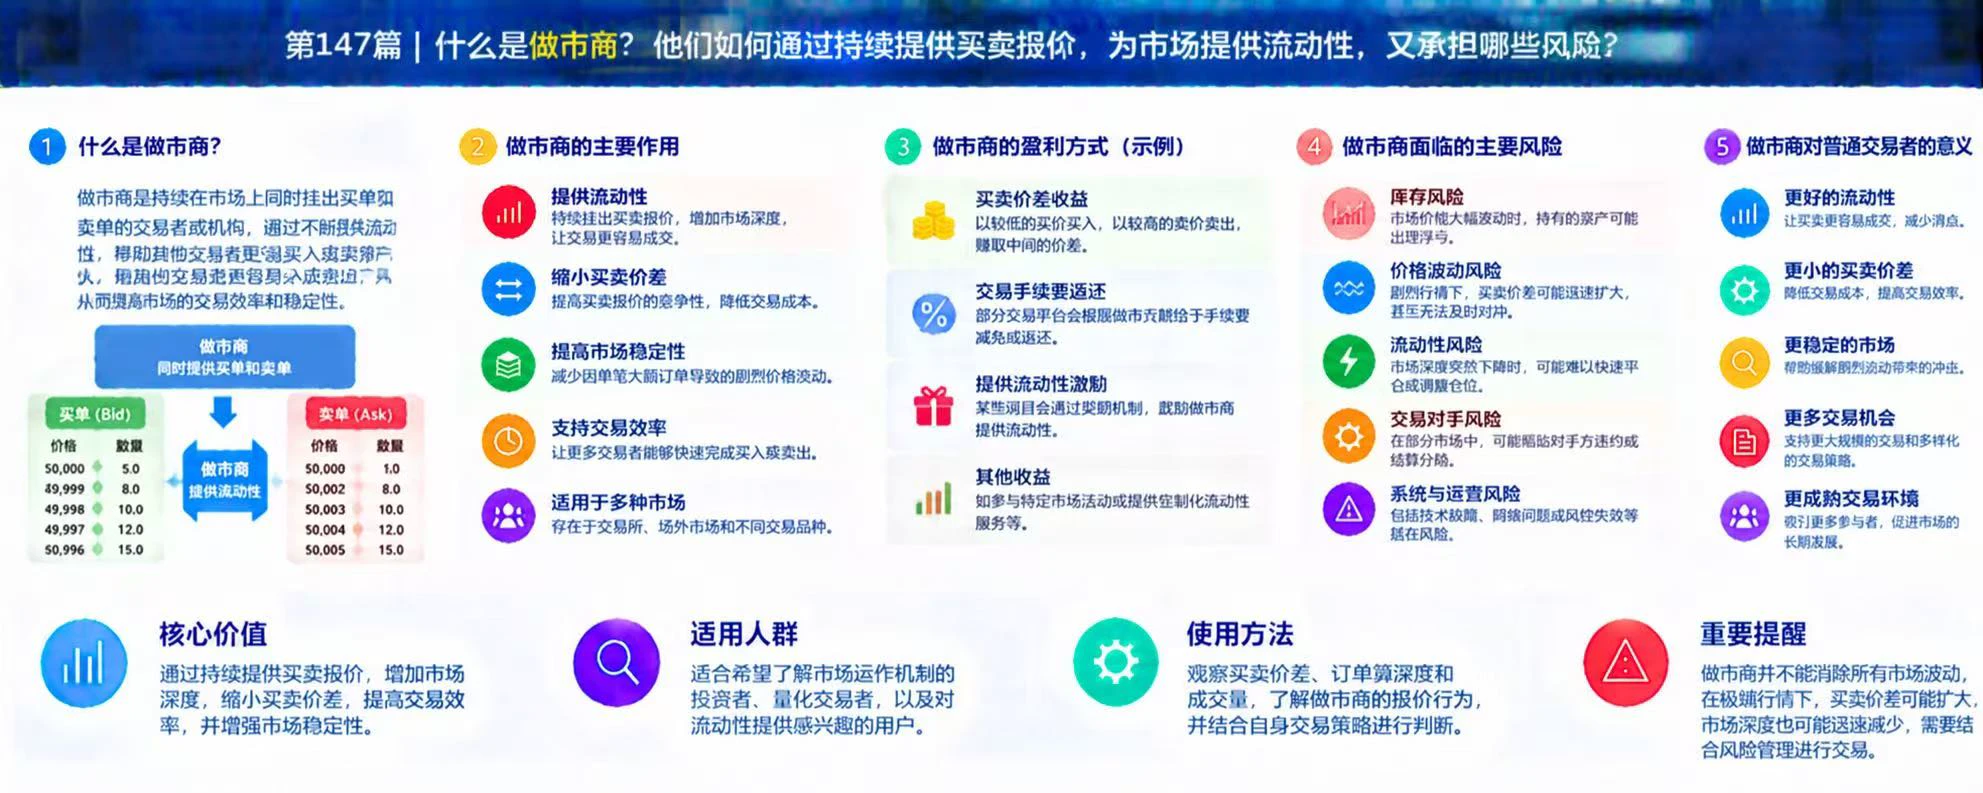
What is a market maker? How do they provide liquidity to the market by continuously offering buy and sell quotes, and what risks do they take on?

In the cryptocurrency market, traders need someone to sell when they want to buy and someone to buy when they want to sell. By continuously offering bid and ask prices, market makers help create more continuous quotes, reduce waiting times for some trades, and improve market liquidity.

First, what is a market maker?

Market makers typically place buy and sell orders in the market at the same time. For example, if an asset has a bid quote of 100 USD
post-image
$BTC , $ETH & $XRP A bullish rebound is ready! The next move could be huge! BTC long trade entry: 73,500 – 73,850 Take profit 1: 74,200 Stop loss: 72,700 ETH long trade entry: 2,045 – 2,065 Take profit 1: 2,085 Stop loss: 2,010 XRP long trade entry: 1.055 – 1.065 Take profit 1: 1.075 Stop loss: 1.038
post-image
XRP-1.15%
#NvidiaCEOUnderInvestigation
⚡ THREE MARKET SHOCKS.
ONE BIG QUESTION: ARE INVESTORS LOSING CONFIDENCE, OR IS THE MARKET PREPARING FOR ITS NEXT OPPORTUNITY?

Markets rarely move because of one headline. Sometimes inflation changes the direction of monetary policy, a sudden liquidation exposes excessive leverage, and a corporate controversy reminds investors that even the strongest companies carry risks.

Today's three trending stories reveal something important: the market is becoming a battle between fundamentals, liquidity, and investor confidence.

Let's look beyond the headlines and exami
post-image
NVDA-5.47%
  • 1
  • 1
$PI ‌
Looking at the 15m chart, PI/USDT had been riding a strong upward trend, testing the upper Bollinger Band (UB: 0.07180) and peaking at a local high of 0.07210. However, a clear market structure change has just occurred; the price faced rejection at the top, printed a series of lower highs, and has now broken below the middle Bollinger Band (MB: 0.07090), currently trading around 0.07078. The K-line analysis shows a transition from bullish momentum to a consolidation/pullback phase, with the recent candles exhibiting longer lower wicks and bearish bodies as the price hunts for support ne
PI-0.60%
  • 9
  • 2
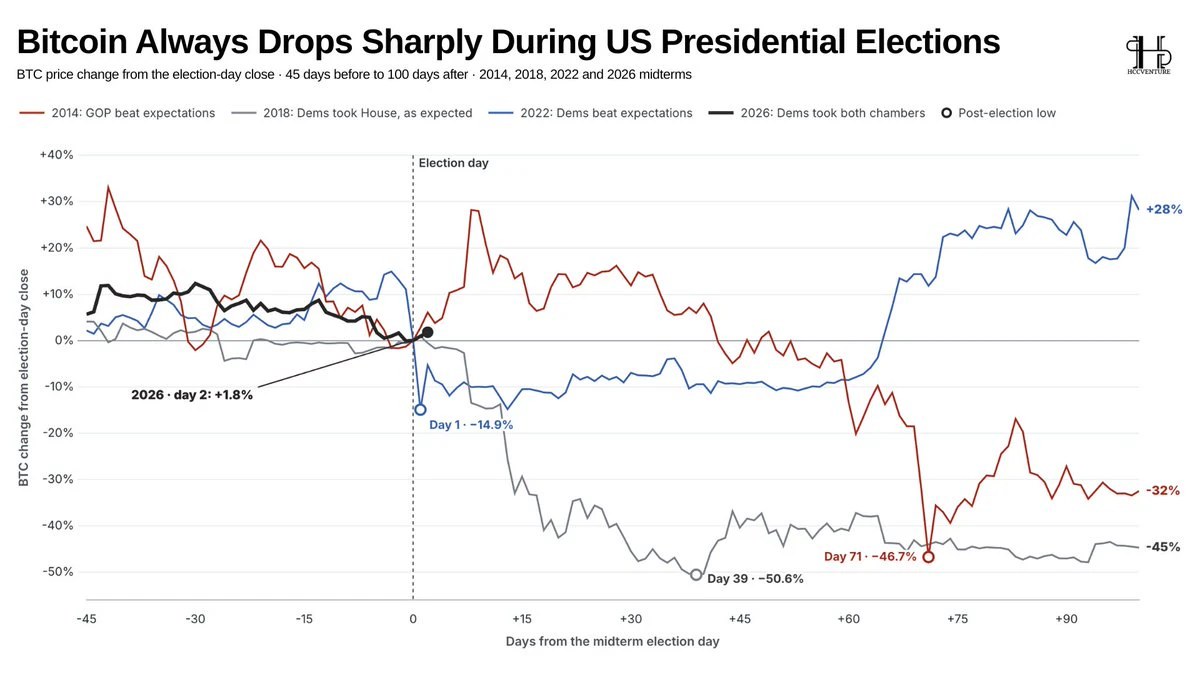
Historical data shows that #Bitcoin has experienced significant corrections after US midterm elections.
In 2014, $BTC experienced its deepest drop of approximately 46.7% in 71 days; in 2018, it recorded a drop of about 50.6% in just 39 days. These two cases demonstrate the risk of prolonged and significant post-election corrections.
However, the events of 2022 offer a different perspective. #Bitcoin fell by about 14.9% on the first day after the election, but then recovered strongly, ending the 100-day period with a gain of approximately 28% compared to the closing price on election day.
For 2
post-image
BTC-0.67%
Load More

Join 40 M users in our growing community

⚡️ Join 40 M users in the crypto craze discussion

💬 Engage with your favorite top creators

👍 See what interests you

Trending Topics

GateGlobalComplianceExpansion

12.05k Views295 Discussing

Gate continues to expand its global compliance footprint, now covering 81 regulated jurisdictions across Europe, North America, Asia, and Oceania. From MiCA and U.S. state-level MTLs to Japan’s FSA, Dubai, and Australia-related regulatory approvals, global exchanges are entering a new stage of compliance competition. Do you think regulatory strength will become as important as products and liquidity for exchanges in the future?

USOctoberCPIBeatsExpectations

78.43k Views2.49k Discussing

AnthropicIPOValuationCouldReach1.4T

9.22k Views1.55k Discussing

View More