Share your thoughts
placeholder
Article
How is this a rebound? This is CPR for my account, isn’t it? $DELL It just hit 522.17, with +727.91% in the bag. I stared at the screen for several seconds to make sure I was looking at the right account.
When I opened the market this morning, buying pressure was clearly getting stronger, and each pullback was becoming smaller. It was obviously not an ordinary dead-cat bounce. Around 453.65, I said it plainly: the risk-reward here was good enough—take the loss if wrong, and if right, it would be a big win.
Looking back now, the timing was perfect. Here’s the position update: I took 75% off the
post-image
DELL+0.65%
SNDK+11.20%
BTC-2.04%
BlackRock says rising government debt and weakening currency strength are driving Bitcoin's rally.
Bitcoin is up 23.4% over the past 30 days, but still down 8.9% year to date.
Meanwhile, gold is up 5.5% over 30 days and 3.5% year to date.
BLK-0.37%
BTC-1.99%
  • 2
Everyone’s staring at gold, but $XAG /USDT just printed a short setup that smells like a trap—or a gift.

$XAG /USDT - SHORT

Trade Plan:
Entry: 66.19 – 66.37
SL: 67.17
TP1: 65.61
TP2: 65.17
TP3: 64.50

Why this setup?
- 4H bias is SHORT (55% confidence), but the 1D trend is *range*—so this isn’t a breakout, it’s a fade.
- Entry pinned at 66.28 with TP1 at 65.61 (a 1% drop) and TP3 at 64.50 (2.7% down).
- RSI on 15m is 50.65—neutral, not oversold, meaning downside room still exists before buyers step in.
- Why now? Price is stalling at range resistance; if 66.95 (invalidation) holds a
XAG-1.09%
Everyone’s watching WLD pump—but the 4H chart just whispered a secret that most retail will ignore.

$WLD /USDT - SHORT

Trade Plan:
Entry: 0.3820 – 0.3846
SL: 0.3960
TP1: 0.3738
TP2: 0.3674
TP3: 0.3579

Why this setup?
- RSI on 15m is at 59.38, not exhausted—but that’s the trap.
- ATR (1H) of 0.00529 shows volatility is compressing, priming a squeeze.
- Price sits at 0.3833 inside a 1D range—this is the exact rejection zone where shorts get funded.
- Why now? The “Waiting” status means the setup is armed; the invalidation at 0.3836 is a hair away, so the next candle decides the flush
WLD-2.53%
Everyone’s staring at the 15m RSI (70.94) while SLX silently prints lower highs on the 4h.

$SLX /USDT - SHORT

Trade Plan:
Entry: 0.07002 – 0.07044
SL: 0.07228
TP1: 0.06869
TP2: 0.06767
TP3: 0.06613

Why this setup?
Why now? The 1D range isn’t your friend—it’s a trap door.
- 4h bias is SHORT (55% conf), but the real tell is the EMA cluster at 0.07023.
- Price is pinned at entry_ref, with TP1 at 0.06869 (a 2.2% drop) and TP2 at 0.06767 (3.6%).
- ATR (0.000855) says volatility is compressed—breakouts get violent.
- The 15m RSI is overheated, but that’s noise. The 4h structure is what
SLX+1.59%
This move is so obvious I don’t even need to think—the account is dancing on its own. During the intraday plunge, $ACE kept falling just short every time it tried to push higher, with a weak rebound and insufficient buying support. I warned against rushing to catch a falling knife and went short instead, entering at 0.1903. Looking at it now, the current price is 0.1722, with a return of +234.52%—the timing was spot-on.

No vision, can’t hold—these profits are paper-thin, but I love it. I’ve taken 80% profit first, putting the bulk in my pocket, and moved the stop-loss on the remaining 20% t
post-image
ACE-5.26%
SOL-1.99%
ZEC+7.58%
$1.025 to 0.24 in just 6 candles 😅
I know most of you are confused: "should you buy the dip" or "take a short position expecting it to fall? more..."
My suggestion is simple - the $CYS price is already near the 22-23 support zone. If we see any bullish candles with a strong comeback and volume, blindly take it. But losing support here would add fuel to further lows, with 16-17 being the next major expansion zone. Further lows are possible if sellers dominate.
post-image
CYS-6.74%
Who is actually buying this shit and why?
post-image
Everyone’s chasing BNB longs—but the 4h tape is quietly flipping against the crowd.

$BNB /USDT - SHORT

Trade Plan:
Entry: 719 – 721
SL: 731
TP1: 711
TP2: 706
TP3: 697

Why this setup?
- 1D trend is **range**, not breakout—so buying tops here is a trap.
- RSI 15m at 61 shows short-term exhaustion right at the 720 supply wall.
- ATR 1h (4.73) is tight—meaning the next push down to TP1 (711) is a fast, low-risk ride.
- Why now? Price is stalling at resistance with a 55% short conviction—waiting for the rejection.

Debate:
Are you fading 720 or buying the dip to 706 first?

⚠️ Persona
BNB-1.00%
Rewards are being distributed! Open your mystery box now and win up to 100 USDT worth of tokens! https://www.gate.com/referral/earn-together/invite/UFRFAQ0M?ref=UFRFAQ0M&ref_type=103&utm_cmp=rXJBDjtJ&activity_id=1788357807948
post-image
Why is $CL /USDT quietly sliding while everyone watches the wrong timeframe?

$CL /USDT - SHORT

Trade Plan:
Entry: 90.61 – 90.95
SL: 92.37
TP1: 89.59
TP2: 88.79
TP3: 87.60

Why this setup?
- 4H bias flips SHORT with 55% confidence—not a screaming sell, but a tactical fade.
- Price sits at 90.78, hugging the 1H pivot; RSI 15m at 46.95 shows zero momentum to the upside.
- ATR 1H (0.66) confirms a tight coil—compression precedes expansion.
- Target ladder: 89.59 → 88.79 → 87.60. Invalidation only if 88.47 cracks (trend1D remains "range," so this is a scalp, not a trend trade).
**Why n
CL-0.45%
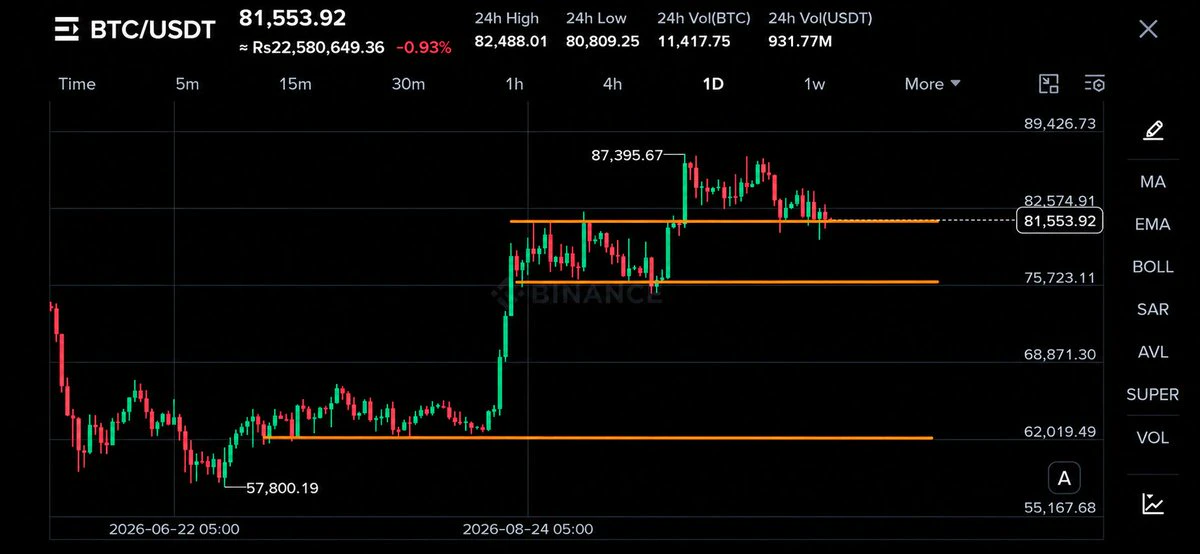
I’m watching $BTC here
Short idea (clean & simple):
BTC had a strong run toward $82.2K, but the move got rejected hard. Price has now lost the $81K area and is struggling to build strength below $80K.
Entry: $79,650–$79,900
Targets:
TP1: $79,250
TP2: $78,700
TP3: $77,500
Stop: $80,350
For me, $80K is the key level. As long as BTC stays below it, I’m leaning toward another move lower. A clean reclaim above $80.3K would make me step away from the short.
#Gate60MillionUsers #BTCReclaims80K
post-image
BTC-1.99%
  • 6
  • 1
Does $BSV Bsv have a trend similar to ZEC? 🤦🤦🤦
BSV+0.35%
Gate News followed According to ETFCheck, South Korea’s leading commodity-tracking platform, oil-linked ETFs posted the highest returns this week as geopolitical tensions escalated. KODEX WTI Crude Oil Futures (Hedged), managed by Samsung Asset Management, rose 9.93% over the past seven days, followed by TIGER Crude Oil Futures Enhanced (Hedged), which gained 9.62%. The surge in ETF returns reflected a sharp rise in international oil prices. On September 2, West Texas Intermediate crude rose to $91.01 per barrel, a weekly gain of 9%; meanwhile, the escalation of the U.S.-Iran military conflict
MU+5.89%
$FHE Signal】4H breakdown + selling pressure dominant, clear short opportunity
$FHE 4H MACD momentum is weakening, with price continuing lower after piercing the Bollinger midline. 1H MACD bearish momentum is expanding, while RSI has fallen below the neutral zone. The Buy/Sell order book is clearly imbalanced, with sell orders dominating. Volume is expanding simultaneously, and selling pressure is being released.
🎯 Direction: short
⚡ Entry/limit order: 2439.48 - 2446.82
🛑 Stop-loss: 2471.29
🚀 Target 1: 2410.12
🚀 Target 2: 2391.77
🛡️Trade management:
- Execution strategy: Reduce the posi
post-image
FHE-0.92%
BTC-1.99%
ETH-2.20%
SOL-2.00%
new stremer
live-cover
LIVE549
$FLOCK Signal】1H pullback complete, bullish funds defend the 0.051 level
$FLOCK Current quote: 0.05125. Three consecutive 1H candles have lower wicks touching the 0.0538-0.0541 zone, with buying pressure quickly absorbing selling pressure. The 4H MACD histogram at 0.0017 is still expanding, while the 1H histogram has contracted to 0.0008, indicating momentum briefly weakened before building again. Order book depth imbalance is -5.88%, with aggressive sell orders slightly dominant, yet the price has not broken below 0.05007, showing genuine support below.
🎯 Direction: long
⚡ Entry/limit ord
post-image
FLOCK+33.33%
BTC-1.99%
ETH-2.20%
SOL-2.00%
Everyone’s watching XRP’s rebound—but this 4h chart is screaming something else entirely.

$XRP /USDT - SHORT

Trade Plan:
Entry: 1.3900 – 1.3976
SL: 1.4300
TP1: 1.3667
TP2: 1.3486
TP3: 1.3215

Why this setup?
- Price is pinned at 1.3938 with a hard ceiling at 1.4057—that’s your invalidation line.
- RSI (15m) at 38.82 shows momentum is fading, not flipping.
- ATR (1h) of 0.015 suggests low volatility = compressed spring, but direction remains SHORT with 55% confidence.
- The range-bound 1D trend means we’re not breaking out; we’re rejecting.
- Why now? Because 1.3900–1.3976 is the l
XRP-3.62%
Load More

Join 40 M users in our growing community

⚡️ Join 40 M users in the crypto craze discussion

💬 Engage with your favorite top creators

👍 See what interests you

View More