Square
Following
Hot
News
Notifications
Profile
Share your thoughts
placeholder
Article
Good night everyone 🌙
There is not much time left for Fungolabs and I still have a few things to complete. Hopefully I can get everything done in time
The team has managed the process really well so far, and I believe things will continue just as smoothly
Still moving forward with @FungoLabs
post-image
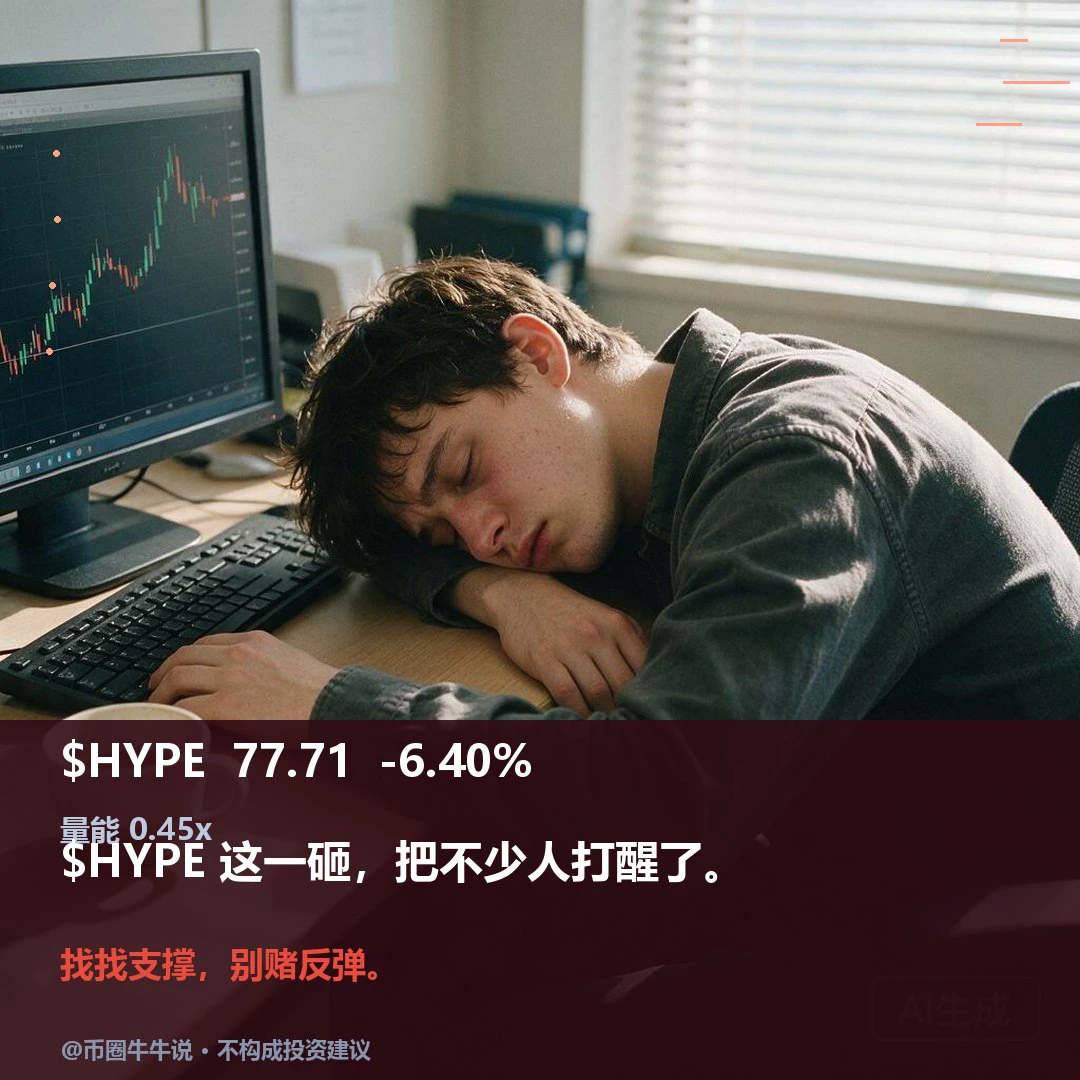
$HYPE Currently at 77.706, down 6.40% over 24H (77.444–84.895). 1H is weak: RSI 19.91, and the current price is below the EMA20 at 80.65; 4H is weak: RSI 22.76, and the current price is below the EMA20 at 83.02. The 1H volume ratio is 0.45. If the price holds above the 84.895 resistance, watch for continuation; if it breaks below the 77.444 support, the short-term outlook weakens. Going forward, review whether the price can hold above 84.895 and whether it can recover after losing 77.444. An oversold RSI only indicates rebound demand; it does not mean the price has bottomed. With volume at 0.4
post-image
HYPE+0.24%
Trenches
ZIG
Z
bade
b
ZIG
0x8c...1145
Market Cap
$.
Change
.
24h Vol
$.
Holders
.
BTC
B
bade
b
BTC
C5xp...pump
Market Cap
$.
Change
.
24h Vol
$.
Holders
.
CORLA
C
bade
b
CORLA
0xba...7777
Market Cap
$
Change
.
24h Vol
$.
Holders
.
STONK
S
bade
b
STONK
6GmA...UNgx
Market Cap
$.
Change
.
24h Vol
$.
Holders
.
LEEROY
L
bade
b
LEEROY
98HE...pump
Market Cap
$.
Change
.
24h Vol
$.
Holders
.
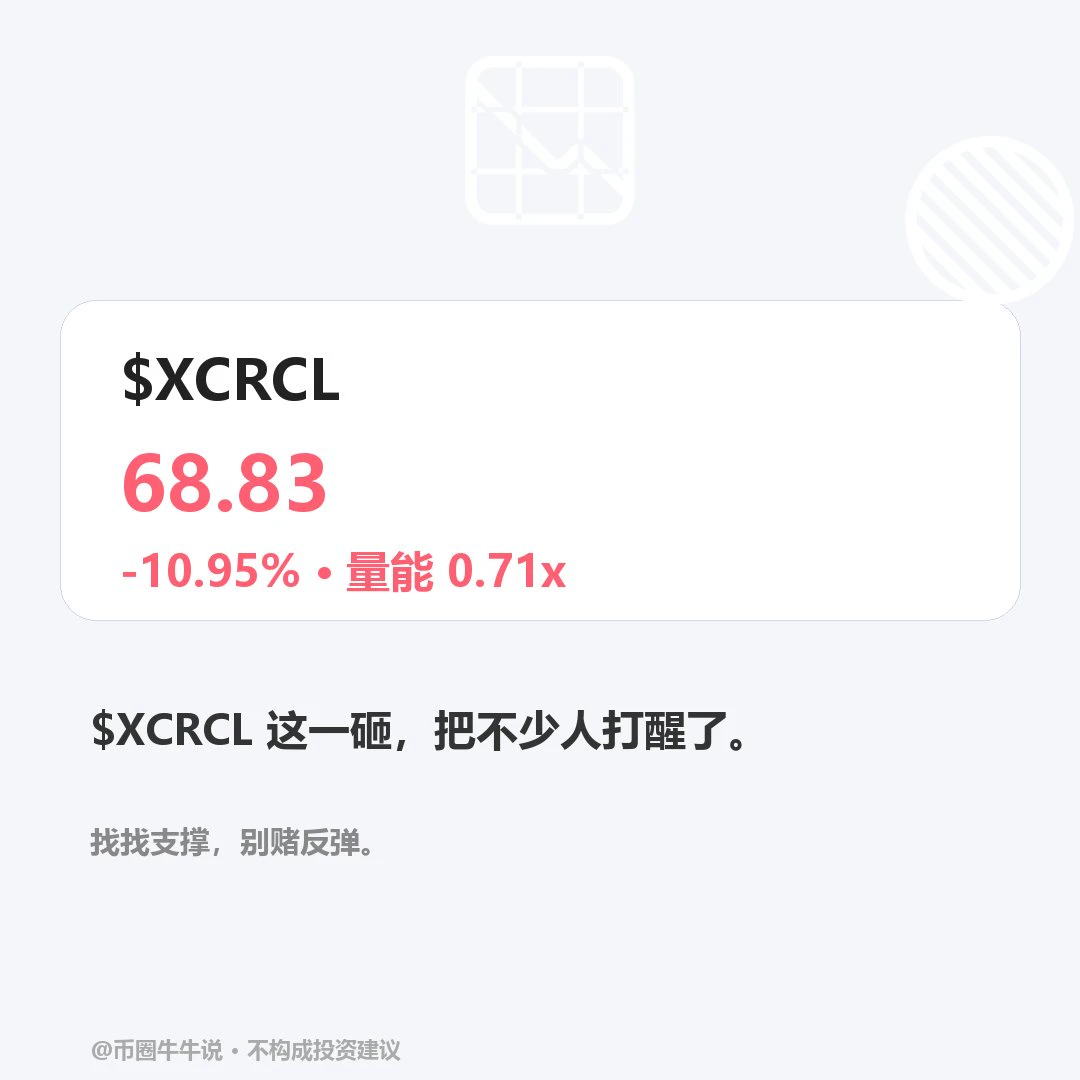
$XCRCL Currently at 68.83, down 10.95% over 24H (65.34–77.31). Weak on the 1H: RSI 27.02, with price below EMA20 at 71.69; weak on the 4H: RSI 36.01, with price below EMA20 at 73.21. 1H volume ratio is 0.71. If price holds above the 76.97 resistance level, continuation is worth watching; if it breaks below the 65.34 support level, the short-term outlook weakens. In the next review, check whether price can hold above 76.97 and reclaim 65.34 if it breaks below. An oversold RSI indicates only potential demand for a rebound, not that the decline has bottomed; a break below that cannot be recovered
post-image
$US has completely stopped falling; loading up on spot at the bottom
US-7.23%
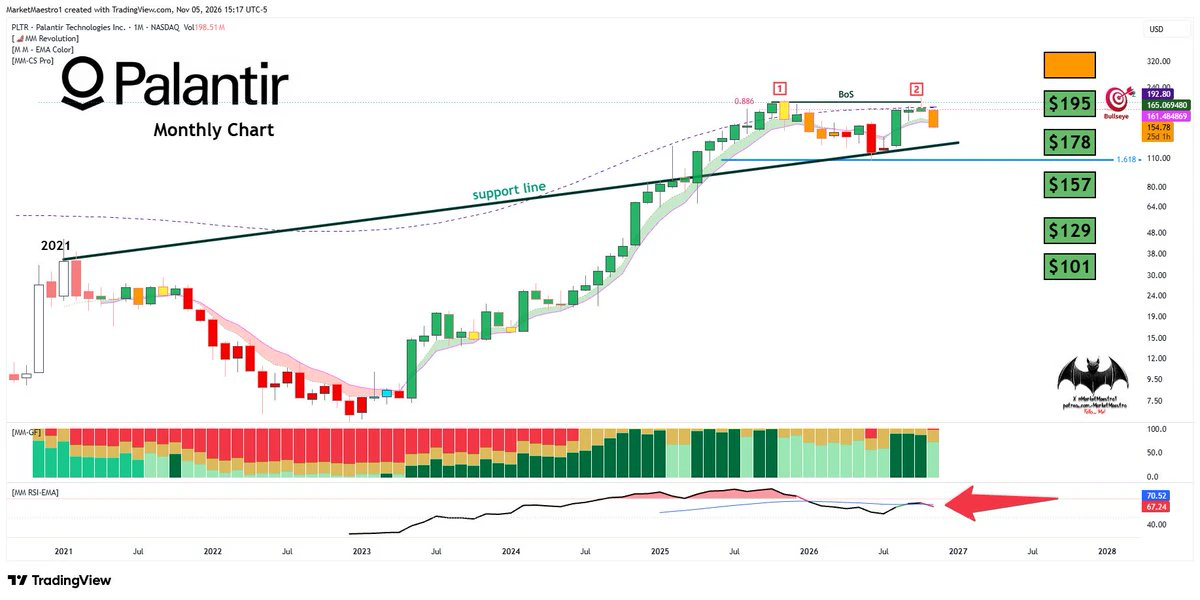
$PLTR
I've started questioning something about Palantir. What if this is a double top? Because the technical conditions now support that possibility
post-image
PLTR-9.79%
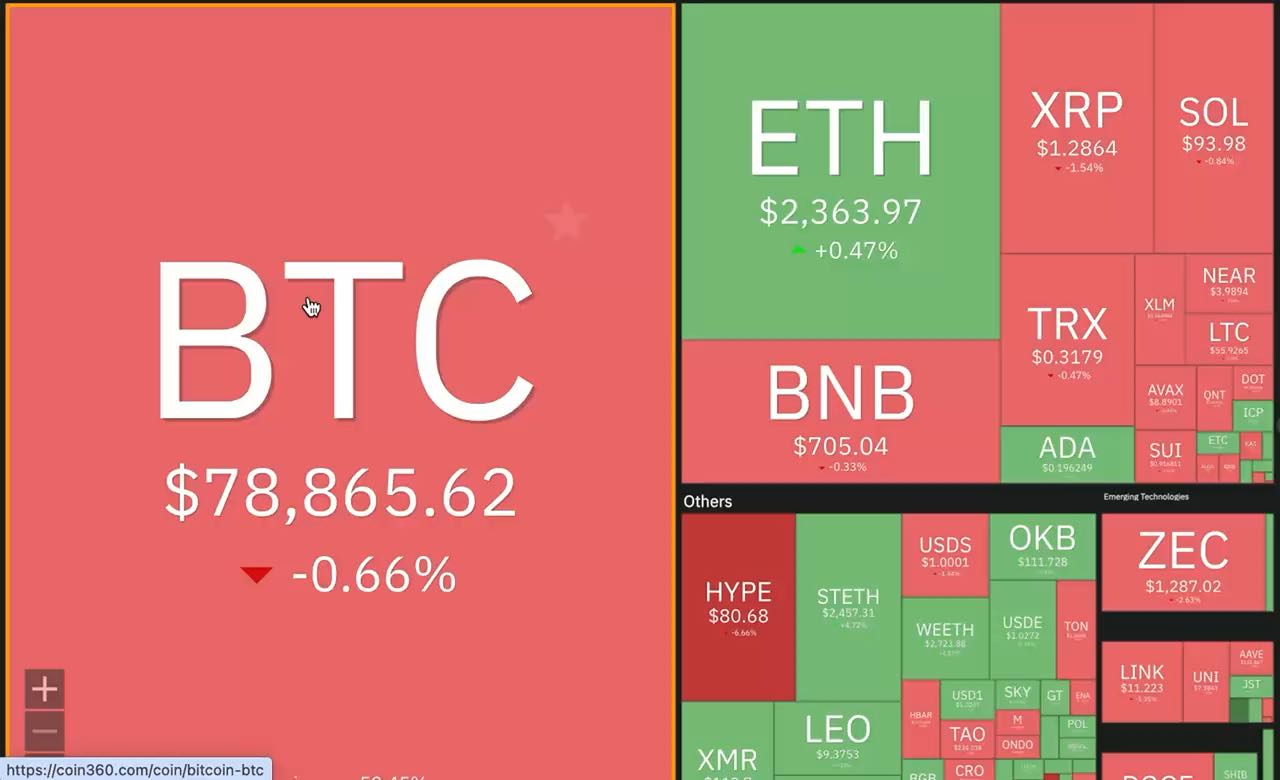
$BTC at $78.8K, $ETH holding green while $SOL , $XRP and $BNB are struggling

What’s your move here fams?

Buying the dip, waiting for confirmation or staying in cash?
BTC-0.67%
ETH-1.26%
SOL-0.77%
XRP-1.15%
BNB-0.76%
We are living in a simulation.
@Grok ratting on Elon Musk is unfathomably ironic.
This is why the Dems are trying to stop AI before it comes for all of them.
post-image
This round only keeps 5 strong signals: JCT, KORU, MUU, and 5 shorts; watch volume and structure before acting. Last round went 6-0, +40.7%, already in the green; the current 13 positions average -0.8%, waiting for confirmation. 🎯 Last round's returns: AAOI entry $50.3300 → exit $48.4400, captured +12.6% at 5.0x; MRVL entry $140.3100 → exit 139.4681, captured +4.4% at 5.0x; SQQQ entry $48.1100 → exit $48.1100, captured +3.6% at 5.0x━━━ Market View ━━━BTC 75,965 -5.3%, with short signals more concentrated; negative funding rate data is temporarily unavailable, and capital is still choosing a d
post-image
JCT-3.26%
KORU-1.22%
MUU-1.34%
AAOI-20.91%
MRVL-16.62%
$HYPE ‌ 's recent recovery has hit a serious resistance wall, and the latest candle shows sellers stepping back in.

Price is around $77.68 after rejection near $84.89. The daily Supertrend remains bullish at $75.21, but buyers need to defend that support to keep the recovery structure alive.

Levels worth watching:

Support: $77.45
Major support: $75.21–$74.41
Resistance: $82.67–$84.89
Next upside zone: $88.20

Holding above $75 could set up another attempt toward $82.67. A break below $74.41 would put the bullish structure under pressure.

HYPE still has a chance to stabilize, but buyers ne
HYPE+0.24%
AMD-17.64%
  • 6
  • 2
Holy shit, holy shit, holy shit—three holy shits. BTC is giving another chance to get into spot; back near 75000, current price 76000. Get into spot in batches. ETH, 2230, got in at the current price. SOL, 90, got in at the current price. SPCX, 123, got in at the current price. The sky is falling, US stocks. $BTC
post-image
BTC-0.67%
ETH-1.26%
SOL-0.77%
SPCX+0.78%
Future fest is not here to play this time around🔥 momentum is already building and I can See party announcements happening already . I’m so ready #FutureFest26
$GT ‌ leans bearish, though there is a possibility of a temporary rebound. The price remains under selling pressure following a sharp decline. The MACD is still in negative territory, signaling bearish momentum. The 9.49 level serves as a key support. If the price fails to break above 9.82, it could weaken again toward 9.49. Conclusion: The downward potential remains stronger. Be wary of a temporary bounce toward 9.82. If the 9.49 support level is breached, the bearish pressure may continue.

Note: Crypto and stock transactions carry the risk of loss. Please conduct your own research (DYOR) b
post-image
GT-2.24%
  • 3
Layout: Bitcoin, Ethereum, Dogecoin
live-cover
LIVE915
  • 1
Spatial Aggregation
live-cover
LIVE20
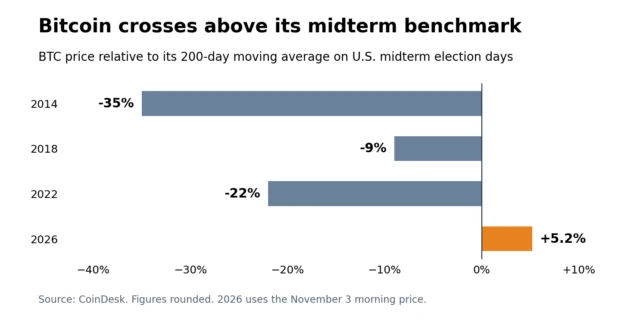
Bitcoin Flips 12-Year Midterm Pattern. Can It Hold Through Friday?
Bitcoin crossed its most telling election-day threshold before a single vote was counted. On the morning of November 3, BTC traded near $76,990, roughly $3,821 above its 200-day moving average. On each of the previous three U.S. midterm election days, Bitcoin was still trading below that line.
That gives investors a more meaningful number to watch this week than $77,000. At roughly $73,169, Bitcoin’s 200-day average marks the level around which its longer-term trend has turned in buyers’ favor. The midterm results and Friday’s
post-image
BTC-0.67%
Risk aversion increased demand for US 10-year bonds. It broke below its long-standing uptrend.
This benefits gold the most.
Falling interest rates are fuel for gold. Because gold pays no interest.
#Altın #XAUUSD #Gold #Quantfury
XAUUSD+0.70%
XAU+0.38%
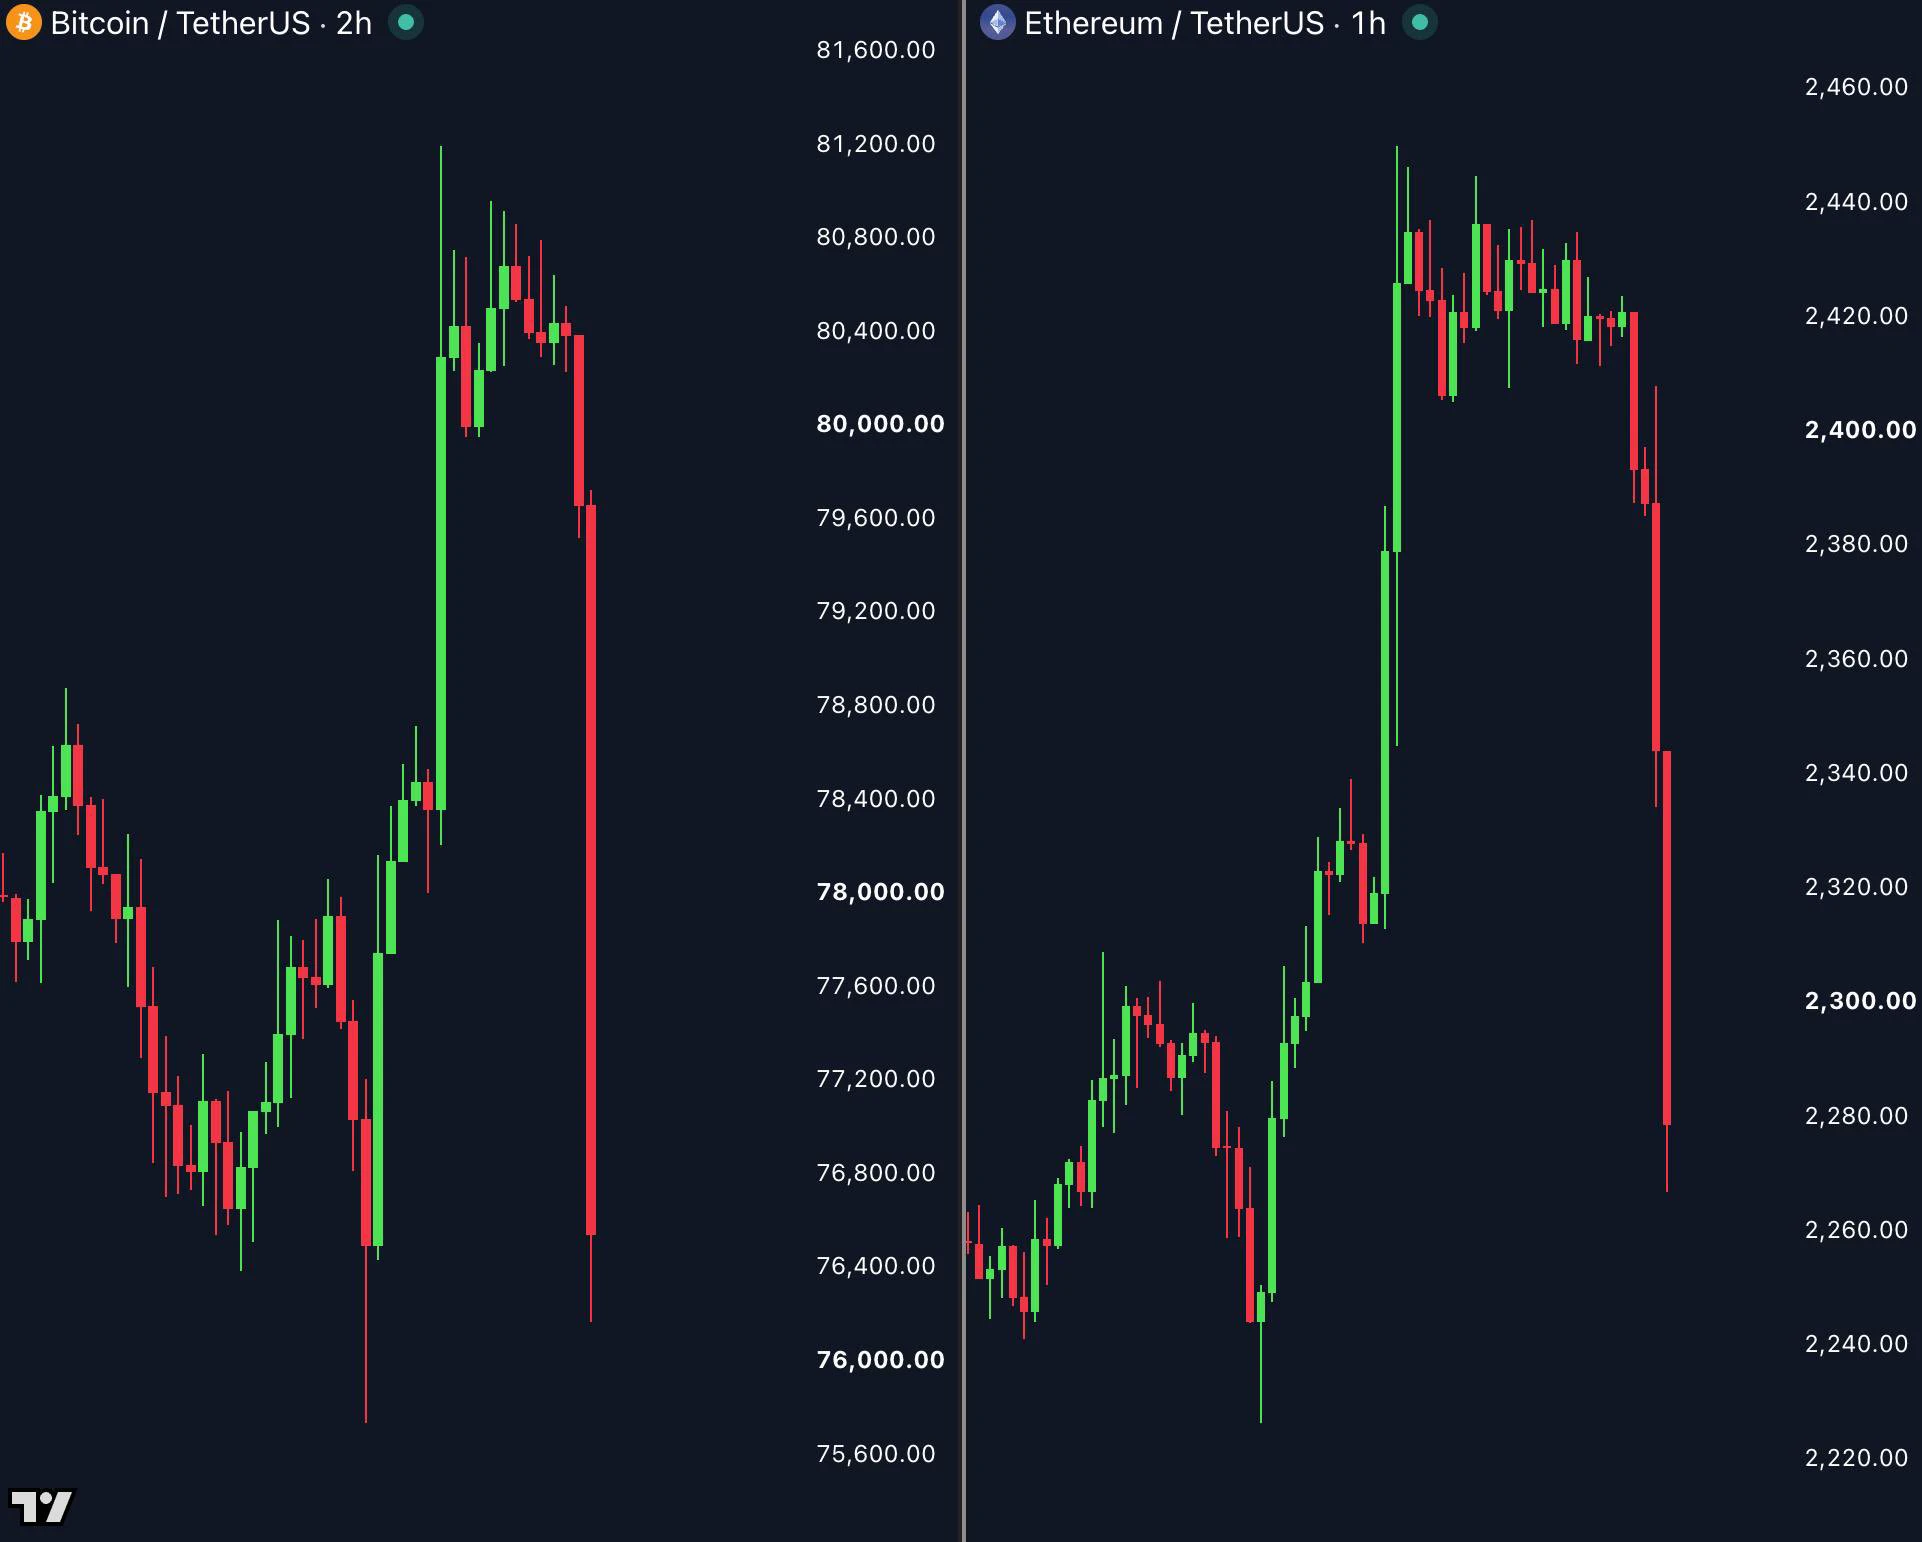
🚨 That crypto pump disappeared fast.

BTC went from $81K to $76.5K, while ETH dropped from $2,440 to $2,280.

All those gains wiped out in just a few candles.

The Bullish Khalifa pattern never disappoints 💀

#DemocratsWinBothChambers
#GateLaunchesTaiwanStockTrading
post-image
BTC-0.67%
ETH-1.26%
  • 4
  • 2
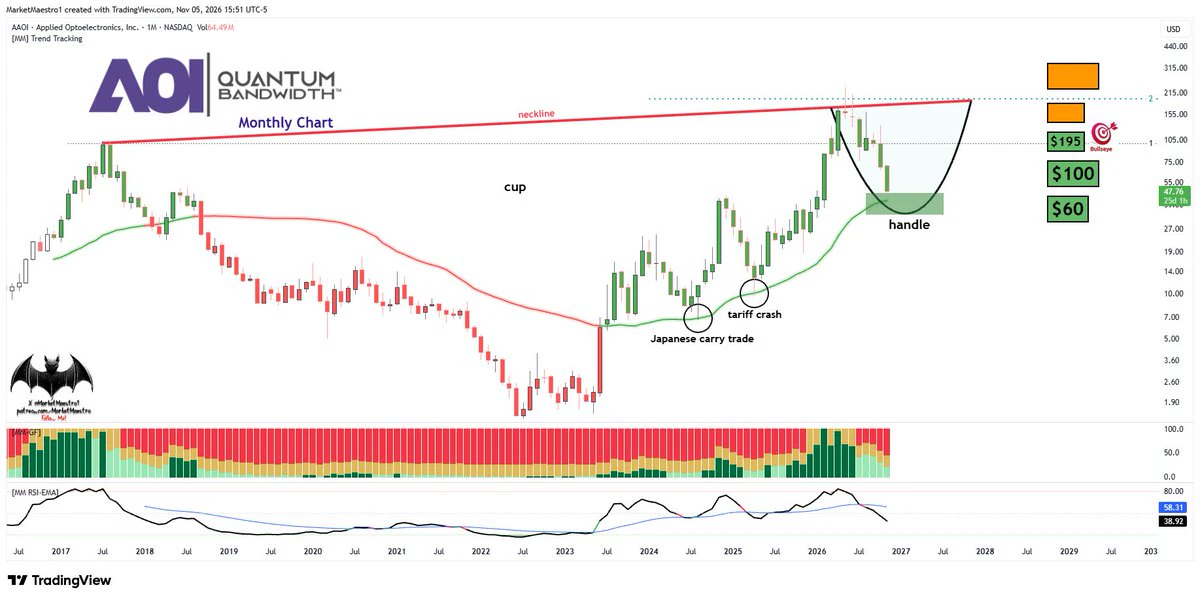
$AAOI
It has almost reached the lows seen during the carry trade fears and the tariff crash. It managed to hold the $46.30-EMA50 support
It could form a bottom in the green zone to build a handle
post-image
AAOI-20.91%
ZEC short positions were opened in the 1330 resistance zone the previous day. Price surged to 1334, met resistance, and failed to break higher before turning lower, dipping to a low of 1212 and locking in a 120-point profit.

From the current chart, after a daily surge and pullback, price has moved back below the Bollinger middle band. The upper band is clearly acting as resistance, bearish MACD signals are gradually emerging, and the overall center of gravity is shifting lower. The broader market remains range-bound with a bearish bias, and overhead selling pressure should not be underestimat
post-image
ZEC+1.29%
#GateLaunchesTaiwanStockTrading #ShareWeekly

Gate's Taiwan Stock Expansion: Connecting Asian Technology Giants With the Global Digital Investment Market

The global investment landscape is entering a new phase where traditional equities and digital assets are becoming increasingly connected. Investors are no longer interested in accessing only one type of financial market. They want flexibility, diversified opportunities, convenient trading tools, and the ability to manage different investments through a single ecosystem.

Gate's latest expansion into Taiwan stock trading reflects this chang
Load More

Join 40 M users in our growing community

⚡️ Join 40 M users in the crypto craze discussion

💬 Engage with your favorite top creators

👍 See what interests you

Trending Topics

GateLaunchesPoSECProofOfSecurity

8.29k Views547 Discussing

Beyond Proof of Reserves, Gate has introduced PoSEC, a new Proof of Security framework focused on how user assets are stored and protected. By disclosing the distribution of assets across cold storage and hot wallets, users can directly understand Gate’s storage structure and risk coverage under extreme scenarios. Gate’s latest cold storage coverage ratio stands at 104.58%, meaning cold-storage assets alone are sufficient to cover all user assets. PoR verifies whether reserves are sufficient, while PoSEC shows how assets are stored and how risks are covered — together forming a more complete asset security framework. Share your results and experience! [👉 Learn more](https://gate.com/proof-of-security)

BTCBackAbove80K

132.11k Views41.59k Discussing

DemocratsWinBothChambers

29.06k Views535 Discussing

View More