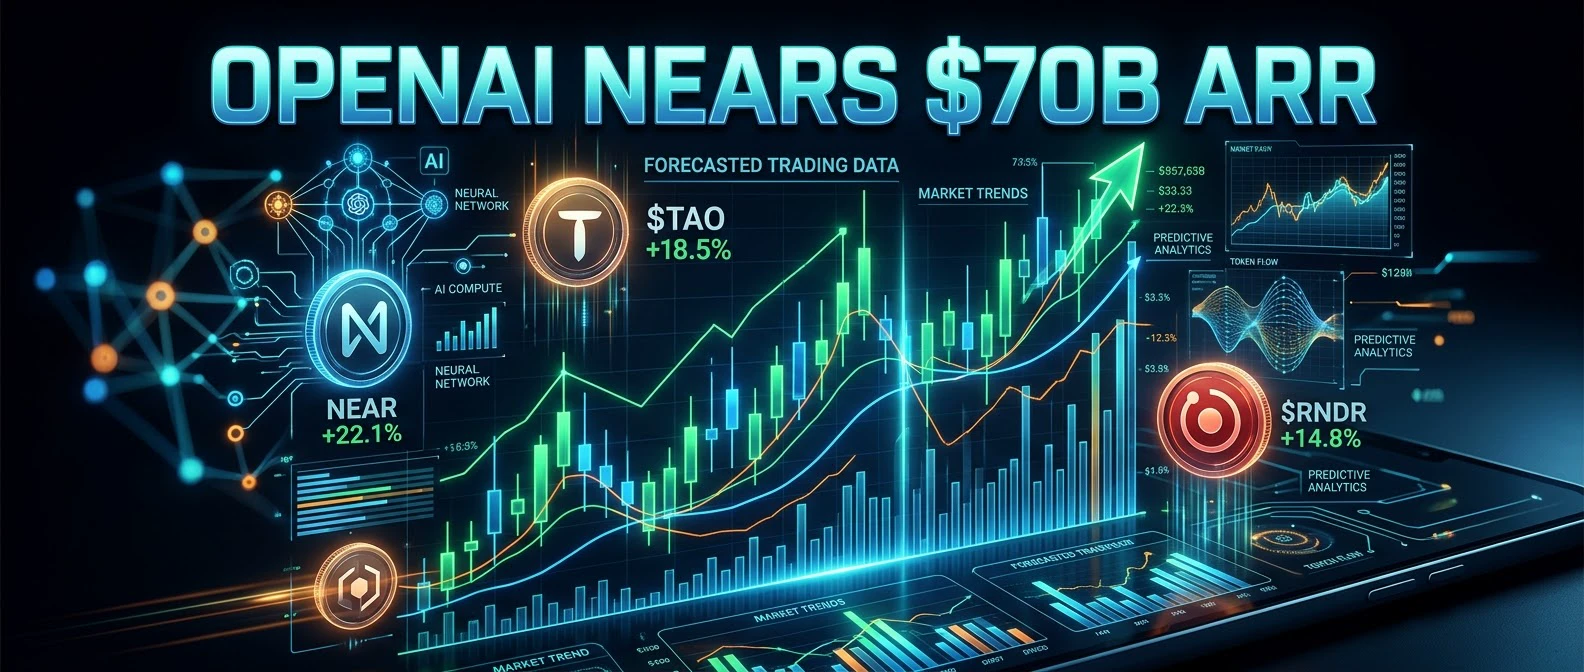
#OpenAIAnnualRecurringRevenueNears$70B OPENAI TIẾN GẦN $70B ARR — BOOM AI ĐANG TRỞ THÀNH MỘT NỀN KINH TẾ THỰC SỰ, NHƯNG NHỮNG TÀI SẢN CRYPTO NÀO THỰC SỰ CÓ THỂ NẮM BẮT ĐƯỢC CƠ HỘI NÀY?
Doanh thu định kỳ hằng năm được báo cáo của OpenAI đang tiến gần khoảng 70 tỷ USD, và với tôi, phần quan trọng nhất không chỉ là quy mô của con số này. Đó là điều con số này cho chúng ta biết về tốc độ AI đang trở thành một nền kinh tế thương mại khổng lồ.
Doanh thu quy đổi theo năm được báo cáo đã tăng hơn 70% kể từ đầu quý 3, doanh số doanh nghiệp được cho là đã tăng hơn gấp đôi kể từ tháng 7, và doanh thu người tiêu dùng phát sinh trong quý 3 được báo cáo đã vượt tổng doanh thu người tiêu dùng phát sinh trong cả năm 2025.
Một điểm khác biệt quan trọng: ARR không phải là doanh thu hằng năm đã được kiểm toán. Đây là ước tính quy đổi theo năm dựa trên tốc độ doanh thu định kỳ hiện tại. Vì vậy, khoảng $70B ARR có nghĩa là nếu tốc độ hiện tại tiếp diễn trong cả một năm, con số tương ứng sẽ vào khoảng 70 tỷ USD.
Điều đó khiến ARR trở thành một thước đo mạnh mẽ về đà thương mại, nhưng không phải sự bảo đảm cho doanh thu tương lai đã được kiểm toán.
ĐIỀU NÀY QUAN TRỌNG VỚI AI VÀ CRYPTO NHƯ THẾ NÀO
Câu chuyện lớn hơn nằm ở cơ sở hạ tầng cần thiết để hỗ trợ tăng trưởng này.
Việc sử dụng AI nhiều hơn đòi hỏi nhiều năng lực điện toán, trung tâm dữ liệu, chip chuyên dụng, mạng lưới, lưu trữ, điện năng và công suất đám mây hơn.
Điều đó tạo ra cơ hội trên toàn bộ chuỗi cung ứng AI, thay vì chỉ dành cho các công ty phát triển mô hình AI.
Đối với crypto, mối liên hệ tiềm năng đến từ điện toán phi tập trung, lưu trữ, cơ sở hạ tầng dữ liệu, tác nhân AI và các mạng lưới dựa trên blockchain.
Tuy nhiên, tôi sẽ không xem $70B tiêu đề này là tín hiệu mua tự động đối với mọi token liên quan đến AI.
Một câu chuyện mạnh có thể thu hút sự chú ý, nhưng nhu cầu token bền vững vẫn đòi hỏi tính hữu dụng, mức độ chấp nhận, thanh khoản, khối lượng, động lực thúc đẩy và cấu trúc thị trường lành mạnh.
Và thị trường hiện tại đã cho thấy dòng vốn đang có sự chọn lọc.
TỔNG QUAN HIỆN TẠI VỀ CÁC TOKEN AI TRÊN GATE
TAO ở quanh mức $304,66, tăng 0,76% trong 24 giờ, với vốn hóa thị trường gần 6,41 tỷ USD.
NEAR ở quanh mức $4,93, giảm 4,86%, với vốn hóa thị trường gần 6,27 tỷ USD.
WLD ở quanh mức $0,5114, giảm 5,33%, với vốn hóa thị trường gần 5,01 tỷ USD.
RENDER ở quanh mức $1,93, tăng 0,93%, với vốn hóa thị trường gần 1,02 tỷ USD.
VIRTUAL ở quanh mức $0,78, giảm 2,01%, với vốn hóa thị trường gần 791,6 triệu USD.
FET ở quanh mức $0,2342, tăng 1,91%, với vốn hóa thị trường gần 624,9 triệu USD.
GRT ở quanh mức $0,0283, giảm 3,02%, với vốn hóa thị trường gần 307,2 triệu USD.
AR ở quanh mức $4,32, tăng 6,58%, với vốn hóa thị trường gần 279,9 triệu USD.
Sự phân hóa này rất quan trọng.
AR tăng khoảng 6,58%, trong khi WLD giảm khoảng 5,33%, tạo ra chênh lệch khoảng 11,91 điểm phần trăm.
Điều này cho tôi thấy câu chuyện AI không đẩy toàn bộ lĩnh vực tăng giảm như một nhóm duy nhất.
Dòng vốn đang luân chuyển có chọn lọc.
TAO — $304,66
Chiến tuyến ngắn hạn chính là $300.
Từ $304,66, $300 tương ứng mức giảm khoảng 1,53%, trong khi $299 thấp hơn khoảng 1,86%.
Ở chiều tăng, $312 cao hơn khoảng 2,41%.
TĂNG GIÁ: Nếu TAO giữ được $300 và lấy lại $312 cùng khối lượng tăng, bên mua sẽ có xác nhận ngắn hạn mạnh hơn.
GIẢM GIÁ: Việc mất dứt khoát $300 sẽ làm suy yếu cấu trúc, với khoảng $295 và $290 trở thành các mốc tham chiếu quan trọng ở phía giảm.
Với tôi, xác nhận từ khối lượng quan trọng hơn việc đơn giản nhìn thấy một nến xanh.
NEAR — $4,93
NEAR đã giảm khoảng 4,86%, khiến mốc tâm lý $5 trở nên quan trọng.
Một nhịp tăng lên $5 tương ứng mức tăng khoảng 1,42%, trong khi $5,52 cao hơn khoảng 11,97%.
Mức đáy $4,74 gần đây thấp hơn giá hiện tại khoảng 3,85%.
TĂNG GIÁ: Việc lấy lại và giữ được $5 cùng khối lượng cải thiện có thể chuyển sự chú ý về phía $5,52.
GIẢM GIÁ: Thất bại tại $5, sau đó phá vỡ xuống dưới $4,74, sẽ cho thấy áp lực bán ngắn hạn tiếp diễn.
WLD — $0,5114
WLD giảm khoảng 5,33%.
Mức cao trong 24 giờ được báo cáo gần $0,5443 và mức thấp gần $0,481 tạo ra biên độ khoảng 13,15%.
Từ giá hiện tại, $0,5443 tương ứng mức tăng khoảng 6,44%, trong khi $0,481 tương ứng mức giảm khoảng 5,94%.
TĂNG GIÁ: Việc giữ được $0,48 và lấy lại $0,5443 cùng khối lượng sẽ củng cố cấu trúc phục hồi.
GIẢM GIÁ: Việc phá vỡ dứt khoát xuống dưới $0,48 sẽ cho thấy bên bán vẫn đang kiểm soát.
RENDER — $1,93
RENDER tăng khoảng 0,93%.
Kháng cự tâm lý chính là $2, cao hơn giá hiện tại khoảng 3,63%. Một nhịp tăng hướng tới $2,10 sẽ tương ứng mức tăng khoảng 8,81%.
$1,90 thấp hơn khoảng 1,55%, trong khi $1,80 tương ứng mức giảm khoảng 6,74%.
TĂNG GIÁ: Một cú bứt phá rõ ràng qua $2 được hỗ trợ bởi khối lượng mạnh hơn sẽ mang lại xác nhận tốt hơn.
GIẢM GIÁ: Thất bại quanh $2, sau đó mất $1,90, sẽ làm suy yếu thiết lập.
VIRTUAL — $0,78
VIRTUAL giảm khoảng 2,01%.
$0,80 tương ứng mức tăng khoảng 2,56%, trong khi $0,85 tương ứng mức tăng khoảng 8,97%.
$0,75 thấp hơn khoảng 3,85% và $0,70 thấp hơn khoảng 10,26%.
TĂNG GIÁ: Việc lấy lại $0,80 và biến mốc này thành hỗ trợ có thể mở ra hướng tăng tới $0,85.
GIẢM GIÁ: Mất $0,75 sẽ làm suy yếu cấu trúc và đưa $0,70 vào tầm ngắm.
FET — $0,2342
FET tăng khoảng 1,91%.
Mức cao được báo cáo quanh $0,2456 cao hơn giá hiện tại khoảng 4,87%, trong khi $0,2234 thấp hơn khoảng 4,61%.
TĂNG GIÁ: Bứt phá lên trên $0,2456 cùng khối lượng tăng sẽ củng cố động lượng.
GIẢM GIÁ: Bị từ chối, sau đó phá vỡ xuống dưới $0,2234, sẽ cho thấy áp lực bán quay trở lại.
GRT — $0,0283
GRT giảm khoảng 3,02%.
$0,030 tương ứng mức tăng khoảng 6,01% và $0,032 tương ứng mức tăng khoảng 13,07%.
Vùng $0,027 thấp hơn khoảng 4,59%.
TĂNG GIÁ: Lấy lại $0,030 cùng khối lượng sẽ cải thiện cấu trúc.
GIẢM GIÁ: Mất $0,027 sẽ cho thấy sự suy yếu tiếp diễn.
AR — $4,32
AR là tài sản có diễn biến mạnh nhất trong tổng quan này, tăng khoảng 6,58%.
$4,50 tương ứng mức tăng thêm khoảng 4,17%, trong khi $5 tương ứng mức tăng khoảng 15,74%.
TĂNG GIÁ: Nếu giá giữ được các mức cao hơn trong khi khối lượng mở rộng, nhịp tăng có thể phát triển thành động lượng mạnh hơn.
GIẢM GIÁ: Sau nhịp tăng +6,58%, việc đuổi theo giá trở nên nhạy cảm hơn với một đợt điều chỉnh. Sự từ chối nhanh chóng và việc mất các mức vừa lấy lại có thể cho thấy sự luân chuyển ngắn hạn thay vì tích lũy bền vững
THANH KHOẢN LÀ YẾU TỐ CỐT LÕI
Vốn hóa thị trường của TAO gần 6,41 tỷ USD, cao hơn khoảng 22,9 lần so với vốn hóa thị trường của AR gần 279,9 triệu USD.
Nhưng vốn hóa thị trường riêng nó không quyết định chất lượng khớp lệnh.
Khối lượng giao dịch, độ sâu sổ lệnh và chênh lệch giá rất quan trọng khi vào hoặc thoát vị thế.
Một token vốn hóa nhỏ hơn có thể biến động nhanh hơn nhiều, nhưng điều đó cũng đồng nghĩa mức độ nhạy cảm với thanh khoản và biến động cao hơn.
Do đó, quy mô vị thế nên phản ánh cả mức độ tin tưởng lẫn thanh khoản.
KHUÔN KHỔ AI-CRYPTO TĂNG GIÁ SO VỚI GIẢM GIÁ
Khuôn khổ tăng giá của tôi không đơn giản là “AI đang tăng trưởng, nên các token AI sẽ tăng.”
Tôi muốn thấy các vùng hỗ trợ quan trọng được giữ vững, các mức kháng cự lớn được lấy lại, khối lượng mở rộng trong các cú bứt phá, thanh khoản duy trì lành mạnh và dòng vốn luân chuyển lan tỏa sang nhiều tài sản.
Nếu tăng trưởng cơ bản của AI tiếp diễn trong khi giá và khối lượng xác nhận, câu chuyện này có thể phát triển thành một đợt luân chuyển rộng hơn trong lĩnh vực crypto.
Khuôn khổ giảm giá của tôi cũng quan trọng không kém.
Nếu các tiêu đề về AI vẫn cực kỳ tích cực trong khi token tiếp tục mất hỗ trợ, các đợt phục hồi liên tục thất bại tại kháng cự và khối lượng suy yếu, điều đó sẽ cho thấy crypto hiện chưa định giá mạnh câu chuyện cơ bản này.
Các đợt tăng mạnh ở những tài sản AI vốn hóa nhỏ mà không có thanh khoản mạnh hoặc khối lượng bền vững cũng cần được thận trọng, vì những nhịp tăng như vậy có thể đảo chiều nhanh chóng.
KẾT LUẬN GIAO DỊCH TRÊN GATE CỦA TÔI
Tôi sẽ xem diễn biến OpenAI $70B ARR là một bộ lọc chủ đề, không phải tín hiệu giao dịch trực tiếp.
Các mức tôi đang theo dõi là:
TAO: hỗ trợ $300 / mốc tham chiếu bứt phá $312.
NEAR: lấy lại $5 / mốc tham chiếu giảm $4,74.
WLD: hỗ trợ $0,48 / mốc tham chiếu tăng $0,5443.
RENDER: kháng cự $2 / hỗ trợ $1,90.
VIRTUAL: kháng cự $0,80 / hỗ trợ $0,75.
FET: kháng cự $0,2456 / hỗ trợ $0,2234.
GRT: kháng cự $0,030 / hỗ trợ $0,027.
AR: mốc tham chiếu tăng $4,50 sau nhịp tăng hiện tại +6,58%.
Điểm mấu chốt là sự xác nhận.
Một cú bứt phá với khối lượng yếu không giống với một cú bứt phá được hỗ trợ bởi sự tham gia mạnh mẽ.
Tôi cũng muốn các trader xác định trước điểm vô hiệu hóa trước khi vào lệnh, thay vì quyết định phải làm gì sau khi giá đi ngược lại với họ.
QUAN ĐIỂM CUỐI CÙNG
Việc OpenAI tiến gần khoảng $70B ARR cho thấy AI đang nhanh chóng trở thành một nền kinh tế thương mại lớn như thế nào.
Nhưng crypto vẫn sẽ quyết định những dự án nào thu hút được dòng vốn đáng kể.
Tôi không nhìn nhận điều này theo hướng “AI tăng trưởng, do đó mọi token AI đều tăng.”
Cách tiếp cận hữu ích hơn là xác định nơi câu chuyện AI gặp tính hữu dụng thực tế, thanh khoản, khối lượng và cấu trúc thị trường đã được xác nhận.
AI cung cấp chủ đề.
Các yếu tố cơ bản tạo ra cơ hội.
Giá cả bộc lộ kỳ vọng.
Khối lượng xác nhận sự tham gia.
Thanh khoản quyết định việc khớp lệnh.
Cấu trúc thị trường cung cấp sự xác nhận.
Với tôi, khuôn khổ này hữu ích hơn nhiều so với việc mua một token AI chỉ vì AI đang thống trị các tiêu đề.
Nền kinh tế AI đang mở rộng.
Giờ đây, thị trường phải chứng minh những tài sản crypto nào thực sự có thể tham gia vào sự mở rộng đó.