Share your thoughts
placeholder
Article
When I was checking the charts after lunch, the price action felt off. When $CTR plunged in the morning session, I stared at the chart for a long while—the buying support was too weak. Every rebound was just feeding fuel to the bears; not shorting this setup would have been doing myself a disservice.
And the result? The short entered at 0.02063 has now dropped to 0.00986, bringing in a juicy +1026.01% profit. It feels so good—the market practically insisted on feeding me, and I simply opened my mouth and took it.
Operationally, 70% of the position has already been taken in profit, while the st
post-image
CTR-2.67%
LAB-0.18%
DOGE-3.31%
Everyone’s long XRP, but the 4h chart just whispered a secret no one’s ready to hear.

$XRP /USDT - SHORT

Trade Plan:
Entry: 1.3947 – 1.4025
SL: 1.4360
TP1: 1.3705
TP2: 1.3518
TP3: 1.3238

Why this setup?
- **Why now?** RSI on the 15m is cooling at 44.45—momentum is fading, not flipping.
- **The trap line:** 1.4057 is the invalidation; we’re sitting at 1.3986 with a ceiling of 1.4025.
- **Range-bound 1D** means breakouts are fake until proven. Short targets are stacked: 1.3705 → 1.3518 → 1.3238.
- **Risk is tight** (SL 1.4360) vs. reward—this is a scalp, not a saga.

Debate:
If 1.40
XRP-3.99%
📊 $ZIG #Hot ⚡ Bullish
🔥 ZIG Spikes to $0.0539, Crashes, and Just Roared Back Above the Highs Second Wind or Fakeout?
ZIGChain staged a violent parabolic spike to $0.0539 before an equally violent collapse down to $0.0341, then chopped near the lows before a sharp fresh green candle just punched price back above short-term MAs. With momentum reasserting itself off the recent base, buyers look ready for another push.
Signal Block
- Pair: $ZIG /USDT
- Type: LONG
- Leverage: 5x
- Entry Zone: $0.0405 – $0.0420
- Take Profit:
TP1 $0.0440 +31.0%
TP2 $0.0460 +45.2%
TP3 $0.0480 +59.5%
TP4 $0.05
post-image
ZIG+2.07%
  • 5
Something about $link that brings back good memories of 2020..
Anyway its leaving the accumulation zone..
post-image
🚨 CATI/USDT SHORT TRADE 🚨
📉 Entry: 0.066 – 0.070 USDT
🛑 Stop Loss: 0.072 USDT
🎯 Take Profit:
• TP1: +50%
• TP2: +100%
• TP3: +200%
• TP4: +300%
⚠️ Risk Management:
Trade with proper position size & always use SL.
Market conditions can change quickly — DYOR.
$CATI #CryptoTrading #ShortTrade #TradingSignals #harrycrypto
CATI+19.82%
With this trend, I don’t even need to think—the account is dancing on its own.
While everyone else was still watching from the sidelines, I kept my eye on those few rebounds. The volume didn’t follow, and the price stayed under pressure—clearly, there was no one willing to take it higher. I quietly entered a short at 0.3043, and it felt great. At the time, I even wondered if I was acting too soon, but the market immediately proved me right.
Now the price has slid to 0.2368, with returns at +435.46%. That was a satisfying bite of profit. The timing was right, and the wait was worth it. I’ve tak
post-image
BNB-0.61%
SNDK+11.77%
Claude just produced the first computer-checked proof of Fermat's Last Theorem, working largely on its own for 11 days.
It wrote 13 million lines of Lean and proved 29,500 intermediate theorems. Full proof is on GitHub.
Would you trust an AI-checked proof more than a year of human referees?
Q Market Projection
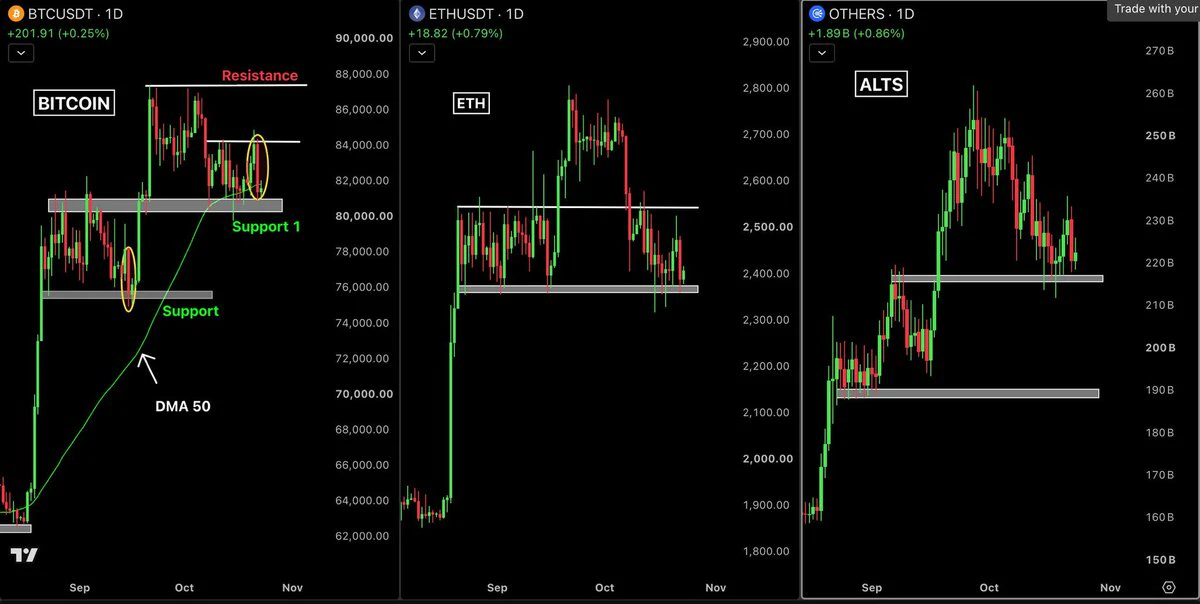
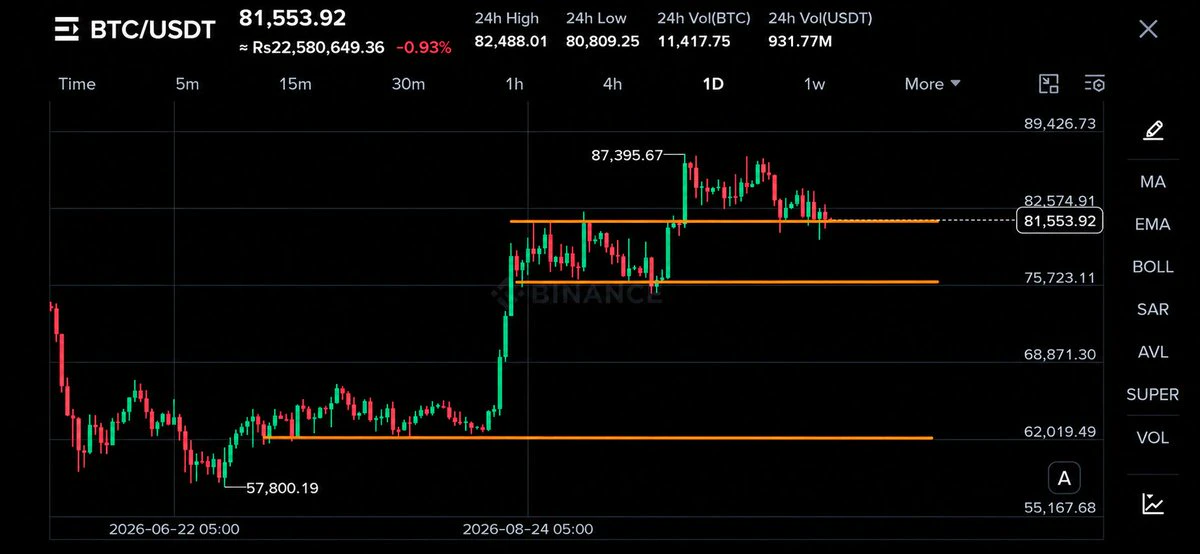
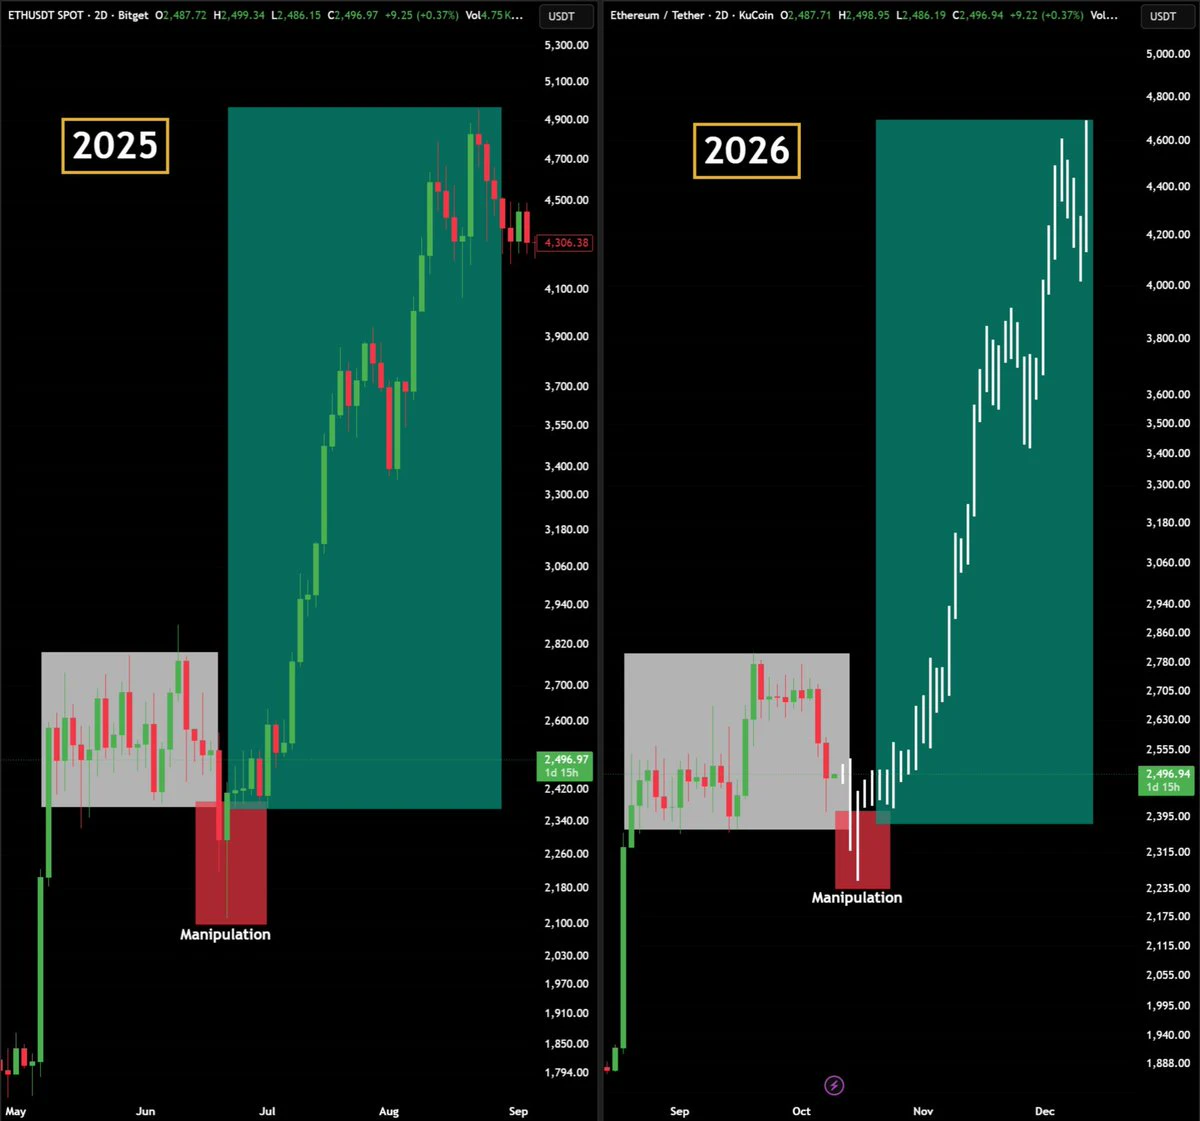
A very good medium- to long-term buying opportunity will form before the end of October.
Figure 1 shows the trading range from October 2025 to March 2026.
Figure 2 shows the recent consolidation range.
The false breakdown and recovery on November 21, 2025, correspond to our false breakdown and recovery on July 29, 2026.
After moving sideways and consolidating for some time, the high of 748 above will most likely see a false breakout before falling back to the lower boundary of the range at 686, then rebounding to the range midpoint at 714. After fluctuating between 686 and
BTC-1.74%
$AKE has shed two zeros—must hold, must hold, 100x, absolutely.
post-image
AKE-14.69%
A few days ago, my hand trembled slightly as I set a stop-loss before bed. When I checked this morning, I realized I had just scared myself. $ZORA When the price plunged intraday, I saw that the pullback held above support, so I knew someone was buying the dip below.

With the pullback holding and buying gradually strengthening, it would have been unreasonable not to take part in this setup. I opened a long at 0.00793, set my stop-loss, and stopped watching the chart.

Now the market has given me the answer: it surged straight to 0.00877, with +256.84% unrealized profit sitting there. Feels
post-image
ZORA+15.90%
XRP-3.99%
DOGE-3.31%
No action, no analysis, just pure luck—this result is embarrassing even to talk about. A few days ago, I took one last look before bed and saw $ETH consolidating at the bottom around 2086.30. It had been grinding sideways for several days without breaking down, so I thought, wasn’t this the perfect time to pick up a bargain? I opened a long and placed the order. When I opened the chart in the morning, it was at 2453.28, up +3057.29%—that was a satisfying chunk of profit. Staying out of the market isn’t a sin; opening positions recklessly is. I took profit on 80% of the position first, and mov
post-image
ETH-1.89%
BTC-1.78%
SOL-2.29%
$MEMECOIN bleeding
post-image
MEMECOIN-46.79%
USELESS TROLL PUMPING
$TROLL will follow $USELESS
The only 2 memes I'm gambling on right now. Been sharing double bottom entries with the subscribers.
USELESS at $0.34-0.4
TROLL at $0.015 and the higher low $0.04
Not financial advice
Meme coins are high risk gambles
USELESS+30.65%
TROLL+38.17%
MEME+1.87%
crypto market trend
live-cover
LIVE34
Everyone’s staring at the 4h chart, but the 15m RSI just flashed 32.89—nobody sees the trap HYPE is setting.

$HYPE /USDT - LONG

Trade Plan:
Entry: 83.751 – 84.255
SL: 81.587
TP1: 85.815
TP2: 87.023
TP3: 88.835

Why this setup?
- 1D trend is bullish, yet price is coiled at 84.003 with a 95% long confidence—this is textbook accumulation before expansion.
- ATR (1h) at 1.006 suggests volatility is compressing; the breakout from 83.751–84.255 will be violent.
- TP1 at 85.815 is only a 2.1% move, but the real fuel is momentum: RSI oversold on low timeframe + high timeframe trend = mean rev
HYPE-2.03%
$ETH Signal】Bearish pressure + 1H breakdown
$ETH 1H Bollinger Bands are opening downward, the MACD histogram is weakening continuously, and 4H bullish momentum is contracting. Bids are weak around 2442, with sell orders pushing price down to 2451.
🎯Direction: short
⚡Entry/limit order: 2444.27 - 2451.62
🛑Stop-loss: 2476.14
🚀Target 1: 2414.85
🚀Target 2: 2396.46
🛡️Trade management:
- Reduce the position by 50% at Target 1 and move the stop-loss up to breakeven. If the price falls back to the entry level, exit automatically to protect the principal.
In-depth logic: The funding rate of 0.0025
post-image
ETH-1.89%
BTC-1.74%
SOL-2.23%
Who’s riding the $MARSCOIN rocket to the final target? 🚀
post-image
CryptoSat
$MARSCOIN is already up 100%+ today, but the chart is still holding a bullish structure.
Price is currently staying above the short-term moving averages, and if buyers keep defending the pullbacks, I’m watching for another leg higher.
For those who want to take a long bet, here’s my setup:
Entry: 0.120 – 0.108
Stoploss: 0.104
Targets: 0.13, 0.144, 0.156, 0.17, 0.20, 0.30
Key area to watch is 0.12-0.11 If it holds as support, the upside targets remain in play.
Keep the position size small and don’t chase green candles.
Let’s see if the bulls have another move left. 👀
repost-content-media
MARSCOIN+75.27%
I didn't do anything—just went to the bathroom, and when I came back, the candlestick chart had already done the work for me. 🙂
While the market was bottoming intraday, funds quietly entered. Volume wasn't large, but buying strengthened—a classic accumulation pattern. While everyone else was still waiting, I gave the direction outright.
This move $INTC went straight from 90.88 to 95.83, securing +386.75%. It was truly sluggish at first, but the breakout feels great; those already on board should be grinning in their sleep.
As for the trade: take 80% off the table first, and set the remaining
post-image
INTC+4.76%
SNDK+11.77%
ETH-1.89%
No trades, no analysis, just pure luck—this result is embarrassing even to talk about. But a review is still necessary. The moment I opened the chart this morning, I could see that the resistance above was clearly strong. Volume failed to follow, and selling pressure was intense—isn't this textbook helplessness?
I decisively placed a short at 0.01052. I just took a glance: 0.00739, with a +1437.41% return. Staying up wasn't in vain; I nailed this move.
I'm closing the position with the +1437.41% gain now and locking in the profits. I'll move the stop-loss on the remaining 20% up to the entry p
post-image
LAB-0.18%
BTC-1.78%
Load More

Join 40 M users in our growing community

⚡️ Join 40 M users in the crypto craze discussion

💬 Engage with your favorite top creators

👍 See what interests you

View More