Share your thoughts
placeholder
Article
Everyone’s long $CL /USDT at 91.78—but the 4h tape just whispered a secret the crowd missed.

$CL /USDT - SHORT

Trade Plan:
Entry: 91.69 – 91.87
SL: 92.66
TP1: 91.12
TP2: 90.68
TP3: 90.02

Why this setup?
Why now? The 1D range is your cage, not your launchpad.
- RSI (15m) at 52.42 = dead center, no fuel for a breakout push.
- ATR (1h) at 0.3665 means the next leg is violent—but direction favors the path of least resistance: DOWN.
- Entry ref 91.78 sits perfectly under resistance; TP1 at 91.12 is a 0.7% gift, TP2 at 90.68 is where the real crowd gets rekt.
This is a low-conviction s
CL+1.09%
$1000 to $100,000 Crypto Trade Challenge Today
live-cover
LIVE1,407
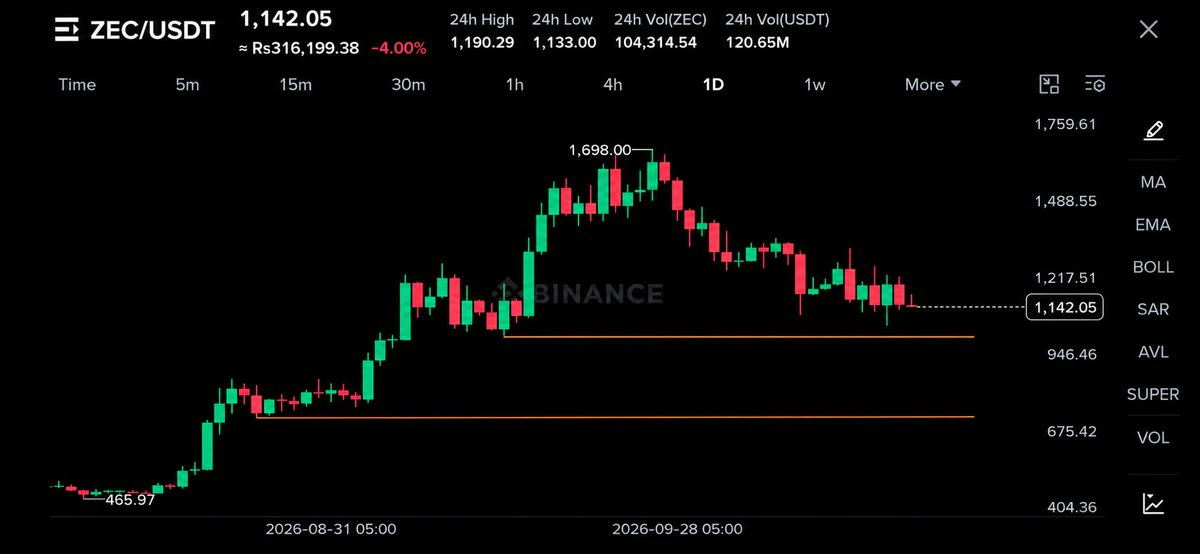
Everyone’s staring at BTC—but ZEC just printed a 95% confidence LONG signal that nobody sees yet.

$ZEC /USDT - LONG

Trade Plan:
Entry: 1011.11 – 1018.97
SL: 977.33
TP1: 1043.32
TP2: 1062.18
TP3: 1090.46

Why this setup?
Why now? The 4h timeframe is screaming bullish while the 1D trend confirms it. RSI on the 15m sits at 47.77—not overheated, just coiled. ATR (1h) is 15.71, giving us room to run toward TP1 at 1043 without breaking a sweat. Entry zone: 1011–1019. This isn’t a gamble; it’s a high-probability setup with invalidation at 874.71. The market is waiting—but the clock is ticking.
ZEC-0.33%
$ETH Signal】Long + 1H MACD histogram widening / 4H golden cross
$ETH The 1H MACD histogram widened to 3.81, with the price holding just below the upper Bollinger Band. The 4H golden cross continues, and the previous 4H bullish candle had a volume of 464,000. The 1H RSI is 65.24, and the funding rate is 0.0078%, so longs are not overheated. The order book depth ratio is 0.20, with sell orders placed deeper, creating slippage costs for short-term chasing. The risk-reward ratio is 1.5, the direction is clear, and execution should follow the specified levels.
🎯Direction: Long
⚡Entry/Limit order:
post-image
ETH+1.20%
BTC+0.18%
SOL+1.66%
$4 Signal】Long: 4H bullish trend intact, 1H low-volume pullback
$4 4H MACD histogram at 0.0015 continues expanding, price above the upper Bollinger Band at 0.0324, closing at 0.033275. 1H RSI 69.79, 4H RSI 79.72, volume declined from 470 million lots to 53 million lots, 1H EMA20 at 0.0291 remains intact. Order book imbalance -0.58%, funding rate 0.0582%, OI stable.
🎯Direction: Long
⚡Entry/Limit Orders: 0.03309242 - 0.03319200
🛑Stop Loss: 0.03153240
🚀Target 1: 0.03568140
🚀Target 2: 0.03692610
🛡️Trade Management:
- Execution strategy: Reduce the position by 50% upon reaching Target 1, and
post-image
4+33.96%
Gold’s 4h chart is screaming short at 4438—but the daily range says don’t trust it yet.

$XAU /USDT - SHORT

Trade Plan:
Entry: 4436.95 – 4439.87
SL: 4452.40
TP1: 4427.92
TP2: 4420.92
TP3: 4410.43

Why this setup?
- RSI 15m at 52.4 = no momentum fuel, just a lazy drift into resistance.
- ATR 1h at 5.83 means a 10 move is nothing—our TP1 at 4427 is a 0.24% scalp, not a trend.
- Daily range kills the conviction: 55% confidence is a coin flip, so we’re selling the 4h rejection, not the macro.
- Why now? Entry zone 4436.95–4439.87 is a tight 0.07% box—wait for a 15m close below 4438 to tr
XAU+0.09%
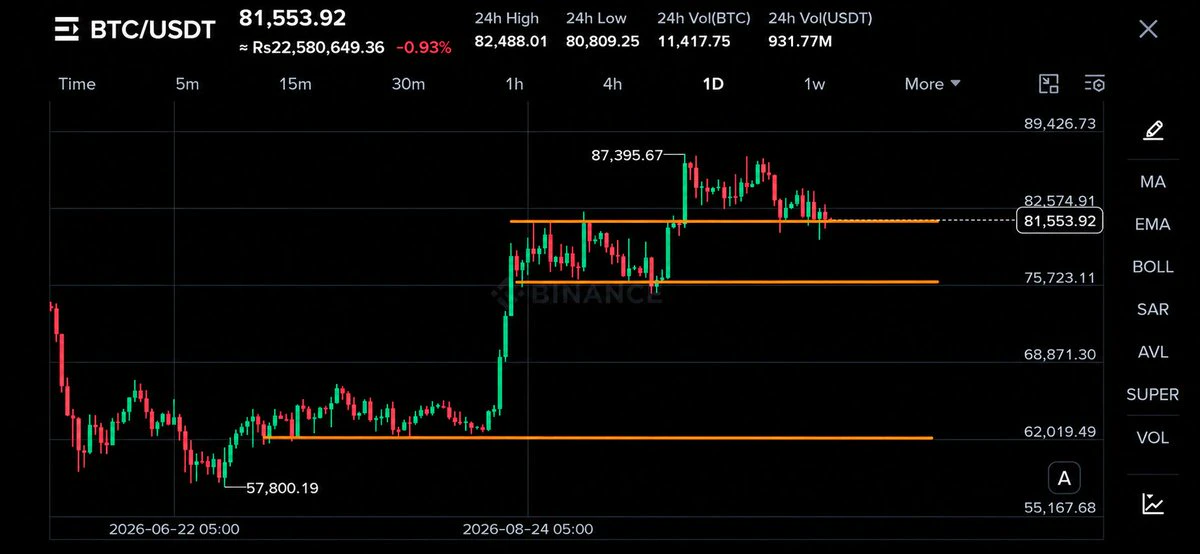
Nonfarm payrolls dump BTC back below 80,000; long-term direction unchanged, still targeting 84,000💛
After the nonfarm payrolls data was released, Bitcoin was once again dumped back below $80,000.
Even amid the impact of adverse macro factors, my long-term target remains unchanged, with the next target still at 84,000.
Let's clarify the current market contradiction:
August employment growth came in well above expectations, prompting the market to raise expectations for Fed rate hikes and creating clear macro-level pressure.
On the other hand, the BTC spot ETF still maintained net inflows of ap
post-image
BTC+0.19%
Crypto Signals and Trding Insights
live-cover
LIVE1,373
BREAKING: Algorand has signed over 1,000,000 post-quantum transactions on mainnet, more than any leading Layer 1.
post-image
ALGO+5.92%
Profits are worth showing off, but losses are even more worth reviewing! The Gate event contract challenge is here
I used to love posting profit screenshots from my trades—sharing them on social media when I made money, and wishing I could just turn off my phone when I lost.
But what I find interesting about Gate’s event contract screenshot-sharing challenge this time is that it not only asks everyone to share the results, but also encourages them to share their trade direction, basis for their judgment, and review process.
That is actually closer to real trading.
For example, if I predict tha
BTC+0.19%
  • 14
I was just about to go to the forum and start cursing, but then I looked at my balance and thought, never mind—the market is always right. I placed the order before bed a few days ago and thought it would go to waste, but today $SUI gave the answer directly—entered at 0.7362, now at 0.8054, with an unrealized gain of +452.99%. Feels great, guys.
I didn’t use any fancy analysis this time; I just looked at whether the buying support was strong enough. Before the market had fully started moving, every pullback held the level, which meant someone was buying underneath. Since someone was buying, I
post-image
SUI+6.14%
BTC+0.19%
ADA+4.53%
I originally planned to cut my losses as a sacrifice to the heavens, but the ritual never happened—the meat roasted itself.
With green filling the screen, $XAU kept oscillating around 4474.29, while the sell walls grew thinner each time. There was clearly no big money looking to take the other side. The rebound lacked volume and support, so I followed the trend and entered a short.
I switched over casually and saw it had already dropped to 4438.98, giving me a full +72.11% on paper. That was real meat on the table. It dragged its feet earlier, but the result tastes just as good.
Take profits
post-image
XAU+0.09%
XRP+1.47%
BNB+7.18%
Everyone’s watching Bitcoin—but $LAB /USDT is quietly setting up a 95% confidence trap.

$LAB /USDT - SHORT

Trade Plan:
Entry: 0.07477 – 0.07525
SL: 0.07728
TP1: 0.07331
TP2: 0.07217
TP3: 0.07046

Why this setup?
Why now? The 4H chart screams exhaustion.
- 1D trend is bearish, and price is hugging the 0.07501 reference—a classic dead-cat bounce zone.
- RSI (15m) at 55.95 shows weak momentum, not strength—buyers are fading.
- ATR (1h) at 0.000947 means volatility is compressed; the next expansion usually follows the path of least resistance: down.
- Targets are stacked: TP1 at 0.073
LAB+2.21%
Candlestick charts can lie, but your trading logic must not fool you!
The Gate event contract trade-sharing challenge is underway. Seeing more and more users share their trading views, I find this more interesting than simply watching prices rise or fall.
Because what is truly worth watching has never been the phrase “BTC is going up,” but rather the question that follows: Why?
My trading habit is to first determine the forecast period, then identify the key variables. For short-term trades, I look at price structure and market sentiment, while for the medium term, I focus more on macro data,
BTC+0.19%
  • 13
Seems like Christmas 🎁⛄🎄
$TROLL
post-image
TROLL-23.05%
  • 1
Liquidation at its peak 🥺😂
post-image
Can HYPE still be chased after breaking above $88? What’s really worth watching now isn’t the price
HYPE broke above $88 to hit a new all-time high, and the market has started asking the familiar question again: “Can it keep rising?”
My view is that instead of guessing the top, it’s better to observe the market structure after the breakout.
A truly healthy strong market usually won’t rely on a single large bullish candle. After breaking through the previous all-time high, if the price can consolidate at elevated levels to absorb profit-taking and then gradually form higher lows, that indicates
HYPE+1.66%
  • 39
$FONE fully closed my short as price can't break a 1 hour resistance and large traders starting to build long positions while price is heavily oversold.
I expect at least a slight pullback from here, or even change of trend.
Slowly building my long positions too now.
#FONE
post-image
FONE-5.55%
Don’t just show your profits! What’s really interesting is why you dared to bet on this side.
Recently, after taking part in Gate’s event contract P&L-sharing challenge, I found that the most interesting part of this format isn’t simply showing how much you made, but laying out your full market judgment.
The biggest appeal of event contracts is that every choice is based on a clear question: up or down? Breakout or pullback? Will a certain event ultimately happen?
My approach has always been fairly simple: look at the macro picture first, then price, and finally market sentiment. For example,
BTC+0.19%
Is HYPE’s new all-time high just the beginning? The real test comes after $88!
HYPE broke through $88 and set a new all-time high, and this kind of move is most likely to ignite market sentiment.
Why does a new high matter? Because once the price breaks above all previous highs, the pressure from holders trapped at higher levels is significantly reduced, and the market begins to enter a new phase of “price discovery.” At this point, the market’s focus also shifts from “Can it break through?” to “Where is the next stop?”
But the stronger the rally, the less you should focus solely on the gains.
HYPE+1.66%
  • 48
Load More

Join 40 M users in our growing community

⚡️ Join 40 M users in the crypto craze discussion

💬 Engage with your favorite top creators

👍 See what interests you

View More