Share your thoughts
placeholder
Article
If you just sold your $CATS
Just hold. It'll be fun. I mean, look at the chart!
post-image
The left side connected to $CRCL , and it’s a bit shaky.
Let’s see what the GENIUS Act says.
post-image
CRCL-7.76%
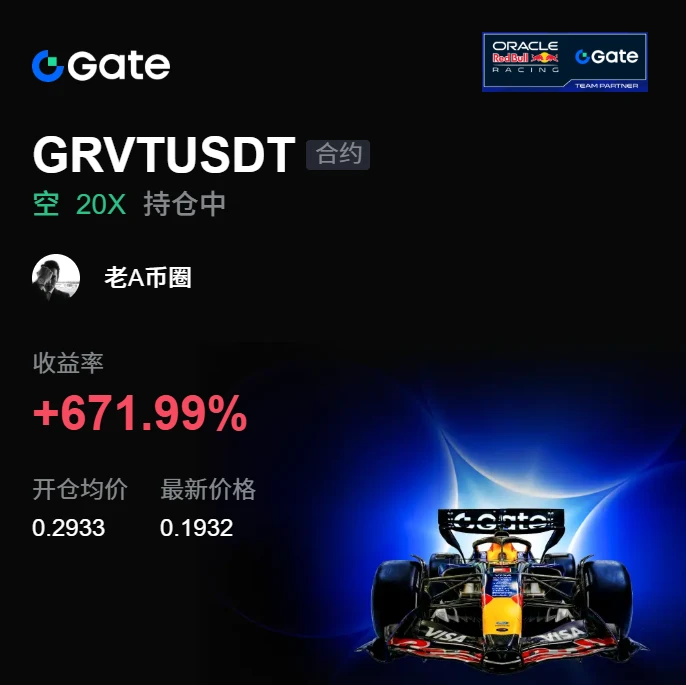
On Gate, I decisively went long $PONS USDT with 20x leverage. The average entry price was 0.5326, the latest price is 0.6347, and the return is locked at +377.73%. As a professional trader, accurately identifying underlying value and capital flows is a core skill.
Recently, PONS fundamentals have exploded, with leading exchanges listing related futures and renowned institutions purchasing tokens to deepen cooperation. In addition, the Pons platform has repeatedly set new records for daily fee revenue, strongly surpassing leading projects in the same sector, further solidifying its leading posi
post-image
PONS+10.91%
BTC-3.18%
ETH-3.62%
Most traders are about to get blindsided by a quiet breakout in SYMBOL.

$ZEC /USDT - LONG

Trade Plan:
Entry: 1126.63 – 1137.25
SL: 1080.95
TP1: 1170.18
TP2: 1195.68
TP3: 1233.92

Why this setup?
Why now? The daily trend is bullish, but the 1h price is holding at 1131.81 just above the entry zone of 1131.94, which means the long setup is perfectly aligned with the higher timeframe. The 15m RSI sits at 47.83, showing room to run before overbought exhaustion, while the 1h ATR of 21.245891 confirms enough volatility to push toward the first target at 1170.18 and then the bigger test at 1195.6
ZEC-1.97%
RWA perpetual contract monthly trading volume reaches $64.7 billion! Gate's “second growth curve” is taking shape
If the 667% growth rate in CryptoQuant's report is Gate's report card in the crypto asset sector, then another set of data disclosed in CoinDesk's August report reveals Gate's real “second growth curve”—RWA perpetual contracts.
Let's look at the data first. CoinDesk's August report shows that Gate's monthly RWA perpetual contract trading volume reached $64.7 billion, up 158% month-on-month. Its market share more than doubled from 5.32% in July to 12.6%, ranking third globally. Duri
GT-1.87%
Nobody is talking about the 1h setup forming under 2442 right now.

$ETH /USDT - LONG

Trade Plan:
Entry: 2436.49 – 2444.83
SL: 2388.62
TP1: 2479.69
TP2: 2505.71
TP3: 2544.75

Why this setup?
Why now? The daily trend is bullish, which gives the long bias structural backing, the 15m RSI sitting at 59.8 shows room to run without being overbought, and the 1h ATR of 16.68 confirms enough volatility for a clean move. The entry zone at 2440.66 aligns with the 1h price, targeting TP1 at 2479.69 and TP2 at 2505.71 for a layered exit, while 2388.62 is the hard stop. The line in the sand is the inval
ETH-3.62%
I still remember how quickly a chart can punish anyone trying to call the bottom while sellers are still dominating every bounce, and BRUSDT is a perfect example right now. Price is sitting around 0.26230 on the 15m chart, down a brutal 48.82%, after collapsing from the 0.57 area and continuing to print lower highs and lower lows. The 24h high is 0.58252 and the low is 0.25316, while volume stands at 9.28M BR with 3.98M USDT in turnover. The chart also shows an 8.34% drop within 15 minutes, confirming just how aggressive the selling pressure and volatility have become.
The critical level is 0.
post-image
BR-50.53%
  • 2
Insiders are calling HYPE the next 10x but the charts say something else.

$HYPE /USDT - LONG

Trade Plan:
Entry: 79.064 – 79.530
SL: 77.055
TP1: 80.978
TP2: 82.099
TP3: 83.780

Why this setup?
Why now? The daily trend is bullish, the 1h ATR is 0.933961, and the 15m RSI sits at 58.34, all pointing to a controlled breakout rather than a blind squeeze. The entry zone between 79.064 and 79.530 aligns perfectly with the 1h price of 79.317, giving precision to the long bias. TP1 at 80.978 and TP2 at 82.099 project a measured move that respects the current volatility, while the invalidation level
HYPE-2.72%
Crypto Market Leaders Back to RED 🩸
JUST correction, righttttt??
post-image
Layout for Bitcoin, Ethereum, and Dogecoin
live-cover
LIVE2,420
  • 2
Federal Reserve (Thursday), everyone pay attention‼️
Strong resistance is right here; the decline since Monday has already reached 2,000 points.
I personally expect further downside. The market does not move all at once, so those who have already entered should simply hold patiently.
The overall direction remains bearish. Those entering later may consider setting up short positions around 78.
#Gate增速全球第一 #美联储即将公布利率决定 #GateUS全美合规牌照增至37张 $BTC $ETH $XRP
BTC-3.13%
ETH-3.55%
XRP-0.78%
#Gate增速全球第一
From a participant’s perspective, one noteworthy signal is that Samsung is accelerating its pace on HBM4E. Samsung announced on May 29, 2026, that it had begun supplying HBM4E samples, while SK hynix did not provide samples to major customers until June 18, about three weeks later. Samsung has led the market in product launches for two consecutive generations—after being the first in the industry to begin HBM4 mass production in February, it has once again taken the lead with HBM4E.
However, SK hynix’s moat remains its customer relationships. NVIDIA has allocated approximately 70%
SK Hynix-0.41%
SKHY+0.17%
SKHYNIX+0.16%
NVDA+0.59%
SAMSUNG+1.34%
The moon waxes and wanes, and so does the market.
Today is the Mid-Autumn Festival. I looked up at the moon and suddenly felt that the way the moon and the market move are actually quite similar.
BTC fell from 82,000 to around 76,500 this month, a drop of roughly 7%. If you say it was disastrous, it really wasn't, considering it was even lower in July. But if you say it's no big deal, those who chased in at 82,000 are certainly feeling uncomfortable now. Rise and fall, ebb and flow—isn't that just like the moon's waxing and waning?
I remember vividly that someone on the square wrote: “Just as
BTC-3.18%
Why I Insist on Writing a Trade Review Every Day
Someone asked me, isn’t it tiring to spend time writing a trade review every day? It is. But I think it’s worth it.
I use a fixed template for my trade reviews, but I adjust the focus each time based on the day’s specific circumstances. For profitable trades, I focus on “what I got right”; for losing trades, I focus on “where I went wrong.” Whether I make or lose money, I always end by writing a section on “what to pay attention to tomorrow.”
I’ve kept up this habit for more than a year, and the results have been obvious.
The first change is tha
USDJPY+0.50%
I'm on the HoodMiners whitelist.
One chassis. Every grade sealed until mint.
Free mint on Robinhood Chain. #HoodMiners
post-image
On the one-hour chart this evening, Ethereum has been pulling back throughout the day and is now around 2450, with downward momentum gradually weakening. MACD bearish volume has not continued to expand, indicating limited strength; KDJ has turned upward from a low level, suggesting potential for further upside. This pullback is a secondary retracement within an uptrend. As long as 2437 below is not effectively broken, the overall structure can first be viewed as setting up for a rebound.
ETH reference: Long at 2446, target 2486, defense 32 points$ETH #btc
post-image
ETH-3.62%
#GateUSExpandsTo37StateLicenses
Gate’s expansion in the United States marks an important step in its broader global growth strategy. Reaching 37 state licenses represents continued progress toward building a more compliant, accessible, and trusted presence in one of the world’s most important financial and digital-asset markets.
For a global crypto platform, entering the U.S. market is not simply about launching products. It requires navigating a complex regulatory environment where requirements can vary significantly from one state to another. Building a presence across multiple jurisdiction
post-image
BREAKING: Bitcoin crashes to $75,500 while Ethereum falls below $2,400.
Over $180 million worth of crypto longs liquidated in the past 4 hours.
The CLARITY Act dump is insane.
post-image
BTC-3.18%
ETH-3.62%
Swear to defend SOXL to the death
Hold on, brothers—victory belongs to the bulls$SOXL
post-image
SOXL+1.13%
Would you bet on SOL at $100?
First, look at the surface: sideways action, dead quiet.
SOL is grinding back and forth between 100.5-101.3, briefly touching exactly 100 today. Market cap and trading volume are both listless. The candlesticks tell you: the symmetrical triangle is converging toward its endpoint, with the upper boundary at 104-105 and the lower boundary at 98-100. The tighter the range gets, the more dangerous it becomes.
First point: on-chain activity is quietly improving, but the price refuses to acknowledge it.
Network revenue was $45.35 million last week, up from $32 million t
post-image
BTC-3.13%
ETH-3.55%
SOL-2.68%
Load More

Join 40 M users in our growing community

⚡️ Join 40 M users in the crypto craze discussion

💬 Engage with your favorite top creators

👍 See what interests you

Trending Topics

CLARITYActKeyVoteAhead

147.05k Views6.61k Discussing

The U.S. Senate will hold a key procedural vote on the CLARITY Act on September 15, requiring 60 votes to advance with Republicans holding 53 seats. Kalshi data shows the odds of passage this year have fallen to 25%, with ethics provisions and stablecoin yield still unresolved. What would advancing the bill mean for crypto markets?

GateTopsGlobalGrowth

23.46k Views992 Discussing

FedAnnounceRateDecisionSoon

30.87k Views3.27k Discussing

View More