







#USEarningsSeason
#ShareWeekly
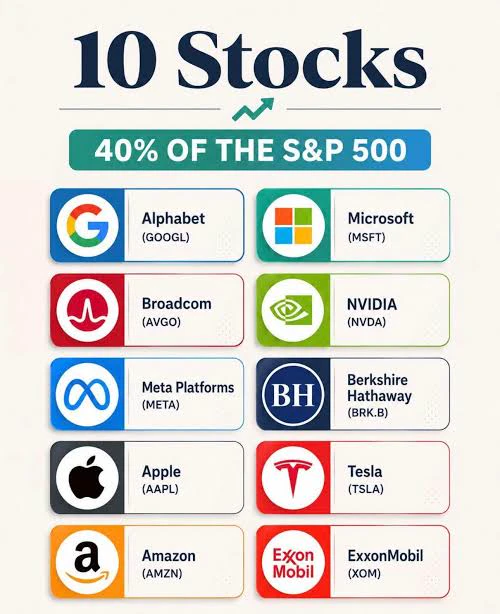
Four major tech earnings reports are due over the next two weeks. The common thread is not revenue growth itself, but whether massive AI capital expenditure is translating into measurable returns. Below is why each report matters and the specific metrics that will determine the market reaction.
Oct 28 (after close) — Microsoft (MSFT)
Microsoft guided first-quarter fiscal 2027 capex above $50 billion and committed to positive free cash flow for the full year. The stock trades near 29 times earnings but far higher on free cash flow, meaning the market is not pricing demand skepticism — it is pricing the return on that spending. Azure is the single most critical revenue driver over the next decade, and management guided constant-currency growth of 44%–45% after posting 43% last quarter. Morgan Stanley notes that roughly 47% would be needed to support the stock. The risk is not a demand miss; it is whether cloud gross margin (65% last quarter) holds as Azure mix rises.
Oct 28 (after close) — Alphabet (GOOGL)
Alphabet has beaten revenue expectations in each of the past eight quarters, so a beat alone may no longer be sufficient. Options are pricing a 5.07% one-day move, above the historical average of 4.02%. Google Cloud is the most promising growth driver, with BofA forecasting 93% growth versus an 89% consensus, driven by expanding capacity and incremental TPU sales. The critical question is whether TPUs can lower computing costs and improve cloud profitability, rather than simply fuel another round of capital-intensive expansion. Adjusted net income is expected to decline 7.6% even as revenue grows 28.9%, putting non-operating items and profitability drivers under scrutiny.
Oct 29 (after close) — Amazon (AMZN)
Consensus expects revenue of $202.08 billion (up ~12%) but EPS of just $1.96 versus $1.95 a year ago — essentially flat. This divergence highlights compressed operating leverage. Deutsche Bank forecasts operating income of **$26.9 billion**, 3.5% above consensus, and raises its AWS growth estimate to 41% from 40%, accelerating from 37% in Q2 despite a higher comparison base. The market will test whether operating income lands in the guided range without another one-time benefit, after Q2's EPS was roughly 81% paper gains from Anthropic valuation adjustments.
Nov 2 (after close) — Apple (AAPL)
Apple guided gross margin to 47%–48%, down from 50.1% in the June quarter, which had benefited from a roughly two-percentage-point tariff refund. UBS expects 47.5%, citing higher memory chip costs and estimating an underlying year-over-year decline of about 70 basis points. iPhone revenue growth is forecast at about 14%, a slowdown from 22%–23% in each of the previous three quarters. Services revenue is expected at $31.6 billion (10% growth), with App Store growth in low single digits. Citi also flags the lack of a base model at this autumn's launch and the impact of agentic AI as additional concerns.
Nov 18 (estimated) — NVIDIA (NVDA)
NVIDIA guided Q3 revenue to $108.0 billion ±2%, with non-GAAP gross margin at 74.0% ±50 basis points. The company has exceeded the high end of its revenue guidance in each of the past 12 quarters, averaging 3.1% above the high end over the past four — a trend that would imply revenue near $113.6 billion. Data center revenue was $89.0 billion last quarter (+117% YoY), and management has said it expects fiscal 2028 revenue growth of approximately 70%, well above the roughly 45% analyst consensus. The key risk is supply, not demand, and whether the Vera Rubin ramp proceeds on schedule.
Discussion
Which of these five are you watching most closely, and is your plan to position ahead of the report or wait for the post-earnings reaction?
$NVDA $MSFT $NVDA $AMZN $GOOGL
#ShareWeekly
Four major tech earnings reports are due over the next two weeks. The common thread is not revenue growth itself, but whether massive AI capital expenditure is translating into measurable returns. Below is why each report matters and the specific metrics that will determine the market reaction.
Oct 28 (after close) — Microsoft (MSFT)
Microsoft guided first-quarter fiscal 2027 capex above $50 billion and committed to positive free cash flow for the full year. The stock trades near 29 times earnings but far higher on free cash flow, meaning the market is not pricing demand skepticism — it is pricing the return on that spending. Azure is the single most critical revenue driver over the next decade, and management guided constant-currency growth of 44%–45% after posting 43% last quarter. Morgan Stanley notes that roughly 47% would be needed to support the stock. The risk is not a demand miss; it is whether cloud gross margin (65% last quarter) holds as Azure mix rises.
Oct 28 (after close) — Alphabet (GOOGL)
Alphabet has beaten revenue expectations in each of the past eight quarters, so a beat alone may no longer be sufficient. Options are pricing a 5.07% one-day move, above the historical average of 4.02%. Google Cloud is the most promising growth driver, with BofA forecasting 93% growth versus an 89% consensus, driven by expanding capacity and incremental TPU sales. The critical question is whether TPUs can lower computing costs and improve cloud profitability, rather than simply fuel another round of capital-intensive expansion. Adjusted net income is expected to decline 7.6% even as revenue grows 28.9%, putting non-operating items and profitability drivers under scrutiny.
Oct 29 (after close) — Amazon (AMZN)
Consensus expects revenue of $202.08 billion (up ~12%) but EPS of just $1.96 versus $1.95 a year ago — essentially flat. This divergence highlights compressed operating leverage. Deutsche Bank forecasts operating income of **$26.9 billion**, 3.5% above consensus, and raises its AWS growth estimate to 41% from 40%, accelerating from 37% in Q2 despite a higher comparison base. The market will test whether operating income lands in the guided range without another one-time benefit, after Q2's EPS was roughly 81% paper gains from Anthropic valuation adjustments.
Nov 2 (after close) — Apple (AAPL)
Apple guided gross margin to 47%–48%, down from 50.1% in the June quarter, which had benefited from a roughly two-percentage-point tariff refund. UBS expects 47.5%, citing higher memory chip costs and estimating an underlying year-over-year decline of about 70 basis points. iPhone revenue growth is forecast at about 14%, a slowdown from 22%–23% in each of the previous three quarters. Services revenue is expected at $31.6 billion (10% growth), with App Store growth in low single digits. Citi also flags the lack of a base model at this autumn's launch and the impact of agentic AI as additional concerns.
Nov 18 (estimated) — NVIDIA (NVDA)
NVIDIA guided Q3 revenue to $108.0 billion ±2%, with non-GAAP gross margin at 74.0% ±50 basis points. The company has exceeded the high end of its revenue guidance in each of the past 12 quarters, averaging 3.1% above the high end over the past four — a trend that would imply revenue near $113.6 billion. Data center revenue was $89.0 billion last quarter (+117% YoY), and management has said it expects fiscal 2028 revenue growth of approximately 70%, well above the roughly 45% analyst consensus. The key risk is supply, not demand, and whether the Vera Rubin ramp proceeds on schedule.
Discussion
Which of these five are you watching most closely, and is your plan to position ahead of the report or wait for the post-earnings reaction?
$NVDA $MSFT $NVDA $AMZN $GOOGL