Share your thoughts
placeholder
Article
Pi Coin Life, opening trading soon!
🇺🇸 Republican senators do NOT expect the CLARITY Act to advance in the Senate next week.
This is RIDICULOUS.
Act is like STALLED!
post-image
After a high-volume long bearish candle at the highs, MAGMA entered a slow decline, with most rebounds stalling around $MAGMA . I did not chase the move midway, waiting instead to short after the price retraced below a key level, with a tight stop-loss.

The short was filled around 0.41077, using a small stop-loss in exchange for room to capture a pullback from the highs. After entry, the price closed lower consecutively. There were some wicks along the way, but the protection level was placed ahead of time and I was not stopped out.

After the first pullback reached its target, I closed most
post-image
MAGMA+6.64%
LAB-4.34%
SOL+1.58%
U.S.-Iran Conflict Keeps Escalating! Brent crude approaches $100.
live-cover
LIVE2,167
Cool cases for iPhone Ultra!
post-image
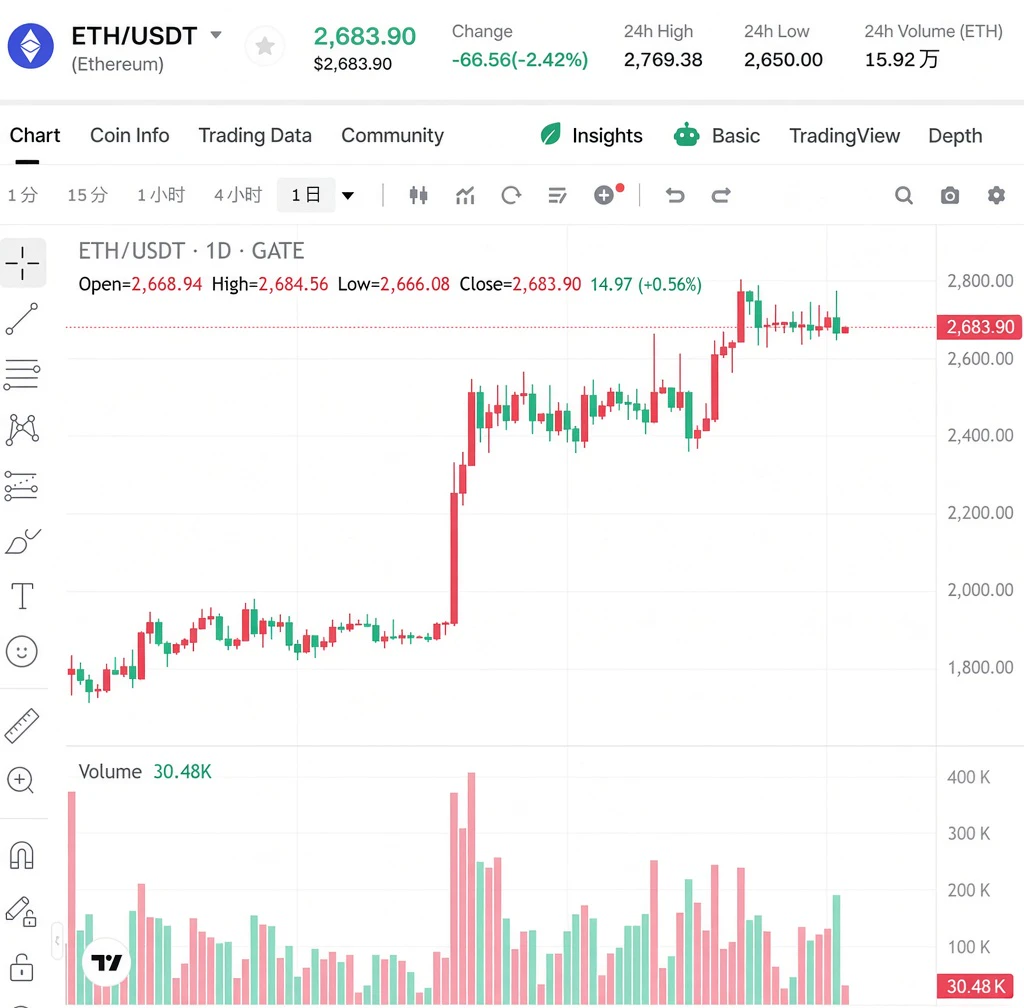
Insiders are whispering that $ETH /USDT is about to explode past 2540.

$ETH /USDT - LONG

Trade Plan:
Entry: 2487.85 – 2495.93
SL: 2453.09
TP1: 2520.99
TP2: 2540.39
TP3: 2569.48

Why this setup?
Why now? The daily trend is firmly bullish, setting the stage for a continuation move. The 1h price sitting at 2491.89 is right inside the entry zone, offering a precise trigger. A 15m RSI of 39.25 signals room for upward momentum before overbought territory, while the 1h ATR of 16.165198 confirms enough volatility to push toward the first target of 2520.99. The second target at 2540.39 aligns with
ETH+1.13%
Why can some people make money with just two lines, while you lose money using a pile of indicators?
The difference isn’t in the quantity, but in the logic.
Tonight (Wednesday) at 20:00, this episode of *Gate Live Trading Academy* invites technical streamer Carter Says Analysis to explain the combined use of Bollinger Bands + MA moving averages in one session.
🎯 Topic: “Indicator Study: Practical Application of Bollinger Bands + MA Moving Averages”
— Use channels to determine trends and moving averages to filter out noise — two classic indicators, one complete system.
Packed with practica
post-image
GateLiveChinese
Why can some people make money with just two lines, while you lose money using a pile of indicators?
The difference isn’t in the quantity, but in the logic.
Tonight (Wednesday) at 20:00, this episode of *Gate Live Trading Academy* invites technical streamer Carter Says Analysis to explain the combined use of Bollinger Bands + MA moving averages in one session.
🎯 Topic: “Indicator Study: Practical Application of Bollinger Bands + MA Moving Averages”
— Use channels to determine trends and moving averages to filter out noise — two classic indicators, one complete system.
Packed with practical insights. See you there 👇
https://www.gate.com/live/video/55b0ea48f9e5427dbdebee21a2f713af?type=live
repost-content-media
# 🚀 MEME TRADERS, ASSEMBLE! | Unlock New On-Chain Trading Experiences With Gate Trenches
The world of cryptocurrency moves fast, and meme coins have become one of the most exciting and rapidly evolving parts of the digital asset ecosystem. From viral communities to emerging tokens and fast-changing market trends, meme trading continues to attract traders looking for new opportunities. Gate Trenches brings a fresh focus to this exciting environment by offering users a new way to explore the world of on-chain trading.
🔥 Meme traders, assemble! The market is driven by community energy, creativi
post-image
MEME-0.28%
⚖️ GERMANY MAY END THE 1-YEAR CRYPTO TAX BREAK!
➥ Proposed flat 25% tax on crypto gains
➥ Could apply to assets bought after Dec. 31, 2026
➥ Proposal targets 2027/28
post-image
🚀 Big changes at StablecoinX! Christopher Jensen now controls 20% of ENA tokens as CEO. What does this mean for the future of the stablecoin? 💼👇 $ENA #CryptoLeadership
ENA+2.76%
Brent Oil:
👉 March 2026 breakout was indicated ✅
👉 March 2026 resistance near $120 was indicated ✅
👉 June 2026 price gap and a support near $75 were highlighted ✅
👀 It bounced off the price gap and is heading toward the earlier rejection zone near $120.
STOP WAR!
#Oil #Commodities #Inflation #Economy
post-image
BZ+1.14%
35$ and a dream
let's try $35 to $500 first lol 😂
not trading publicly, tysm
post-image
Beijing welcomes you
A little autumn get-together
A relaxing day
No more sitting around
Come out for a meal~
post-image
JUST IN: States pause AI data center tax incentives; Ohio eyes about $1.6B hit to 2025 revenue as approvals stall. Could slow new AI infra projects and affect capex timing. $BTC ? $ETH ?
post-image
BTC+1.44%
ETH+1.12%
Everyone Thinks $83K Ended the Bear Market — Exit The Slaughterhouse NOW!
Watch now 👉
Watch summary 👉
Bitcoin's 1-hour and 4-hour breakout faces daily resistance, with retail driving the move while open interest lags. The Trading Parrot analyzes key levels, RSI targets up to $92K, and warns of two retail narratives that could lead to a slaughterhouse trap. Watch to learn the decisive exit levels and how to avoid being caught in the wrong trade.
00:00 Bitcoin 1H/4H Breakout, Daily Still Resisting
01:42 Massive Liquidation and Open Interest Flip Preview
03:29 Open Interest Resistance and Ret
post-image
BTC+1.43%
I didn’t do anything—just went to the restroom, and when I came back, the candlestick chart had already done the work for me. While everyone else was running, I actually smiled as I watched the market: a sell-off on no volume, but increasingly clear buying support, with funds quietly entering. I know this rhythm all too well. $SNDK pulled back to 1586.74, and I immediately shouted: Go long, don’t hesitate. Now at 1724.87, +622.51%—I timed this rhythm so well I almost want to applaud myself. Those already on board must have laughed themselves awake; the sleepless nights were worth it. Don’t le
post-image
SNDK-1.04%
ZEC+9.22%
DOGE+2.35%
My hand trembled slightly when I set the stop loss a few days ago, only to realize this morning that it was unnecessary concern. 😅 The whales really cooperated—I almost wanted to bow down to the candlestick chart.
$TRUMP hit resistance above 2.566 several times a few days ago but just couldn’t break through; the overhead pressure was too obvious. Before going to bed, I simply placed a short order, thinking the worst that could happen was getting stopped out. And the result?
When I got up this morning, I saw that the price had dropped straight to 2.241, with floating profit at +901.46%. I got
post-image
TRUMP+1.11%
DOGE+2.35%
ZEC+9.22%
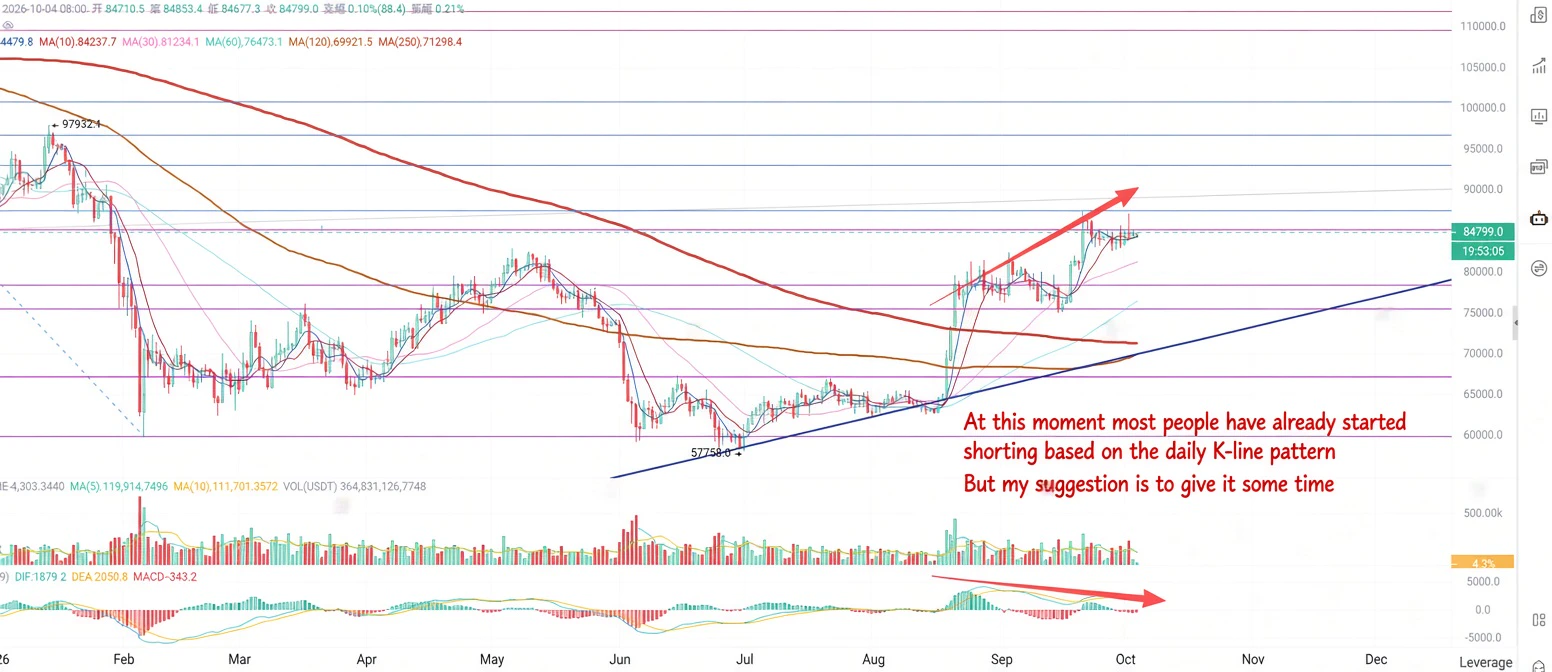
The one-hour chart is still oscillating within the range. Every time the move at four shows its head, it gets pushed back down. There is heavy resistance around 80500, and without any news catalyst, it will not be able to rise anytime soon. Retail traders alone cannot move the market either.
So, with the market unable to move up or down, isn't selling high and buying low the most suitable strategy? Then let's continue trading within the middle of the range. I also posted this afternoon that 79200-79400 could be shorted once, then cover the short and go long when it reaches support. Nothing wro
post-image
BTC+1.43%
ETH+1.13%
Life with Pi Coin—trading is about to begin!
Load More

Join 40 M users in our growing community

⚡️ Join 40 M users in the crypto craze discussion

💬 Engage with your favorite top creators

👍 See what interests you

View More