Futures
Accédez à des centaines de contrats perpétuels
CFD
Or
Une plateforme pour les actifs mondiaux
Options
Hot
Tradez des options classiques de style européen
Compte unifié
Maximiser l'efficacité de votre capital
Trading démo
Introduction au trading futures
Préparez-vous à trader des contrats futurs
Événements futures
Participez aux événements et gagnez
Demo Trading
Utiliser des fonds virtuels pour faire l'expérience du trading sans risque
Lancer
CandyDrop
Collecte des candies pour obtenir des airdrops
Launchpool
Staking rapide, Gagnez de potentiels nouveaux jetons
HODLer Airdrop
Conservez des GT et recevez d'énormes airdrops gratuitement
Pre-IPOs
Accédez à l'intégralité des introductions en bourse mondiales
Points Alpha
Tradez on-chain et gagnez des airdrops
Points Futures
Gagnez des points Futures et réclamez vos récompenses d’airdrop.
Investissement
Simple Earn
Gagner des intérêts avec des jetons inutilisés
Investissement automatique
Auto-invest régulier
Double investissement
Profitez de la volatilité du marché
Staking souple
Gagnez des récompenses grâce au staking flexible
Prêt Crypto
0 Fees
Mettre en gage un crypto pour en emprunter une autre
Centre de prêts
Centre de prêts intégré
Promotions
Centre d'activités
Participez et gagnez des récompenses
Parrainage
20 USDT
Invitez des amis et gagnez des récompenses
Programme d'affiliation
Obtenez des commissions exclusives
Gate Booster
Développez votre influence et gagnez des airdrops
Annoncement
Mises à jour en temps réel
Blog Gate
Articles sur le secteur de la crypto
AI
Gate AI
Votre assistant IA polyvalent pour toutes vos conversations
Gate AI Bot
Utilisez Gate AI directement dans votre application sociale
GateClaw
Gate Blue Lobster, prêt à l’emploi
Gate for AI Agent
Infrastructure IA, Gate MCP, Skills et CLI
Gate Skills Hub
+10K compétences
De la bureautique au trading, une bibliothèque de compétences tout-en-un pour exploiter pleinement l’IA
GateRouter
Choisissez intelligemment parmi plus de 40 modèles d’IA, avec 0 % de frais supplémentaires
Traders Face A Fragile Setup
Ethereum is consolidating between $2,250 and $2,450 as the market searches for the catalyst or the structural shift that forces a decisive move in either direction. The price is holding but not breaking — and CryptoQuant analyst MorenoDV has identified a divergence in the derivatives data across two of the largest exchanges in the world that adds a specific risk dimension to the current setup that most participants are not watching.
Related Reading
The analysis examines the Estimated Leverage Ratio — the measure of how much derivatives exposure is being built on top of the ETH reserve base held by each exchange. A higher ratio does not automatically signal danger, but it does describe a more sensitive market structure: more open positions relative to available reserves means more potential volatility per unit of the underlying asset, and a lower tolerance for adverse price movements before liquidation dynamics begin to take hold.
Since the October 10 crash, Binance’s ETH reserves have declined approximately 5.9% — from 4.037 million to 3.8 million ETH. Over the same period, OKX reserves have collapsed by approximately 82.3%, falling from 861,000 to just 152,600 ETH. Despite that dramatic reserve reduction, OKX’s Estimated Leverage Ratio now sits at approximately 5.6 — meaning derivatives exposure on that venue is 5.6 times the ETH reserve base supporting it. Binance, by contrast, maintains its leverage ratio well under 1x.
Ethereum Estimated Leverage Ratio – Binance | Source: CryptoQuant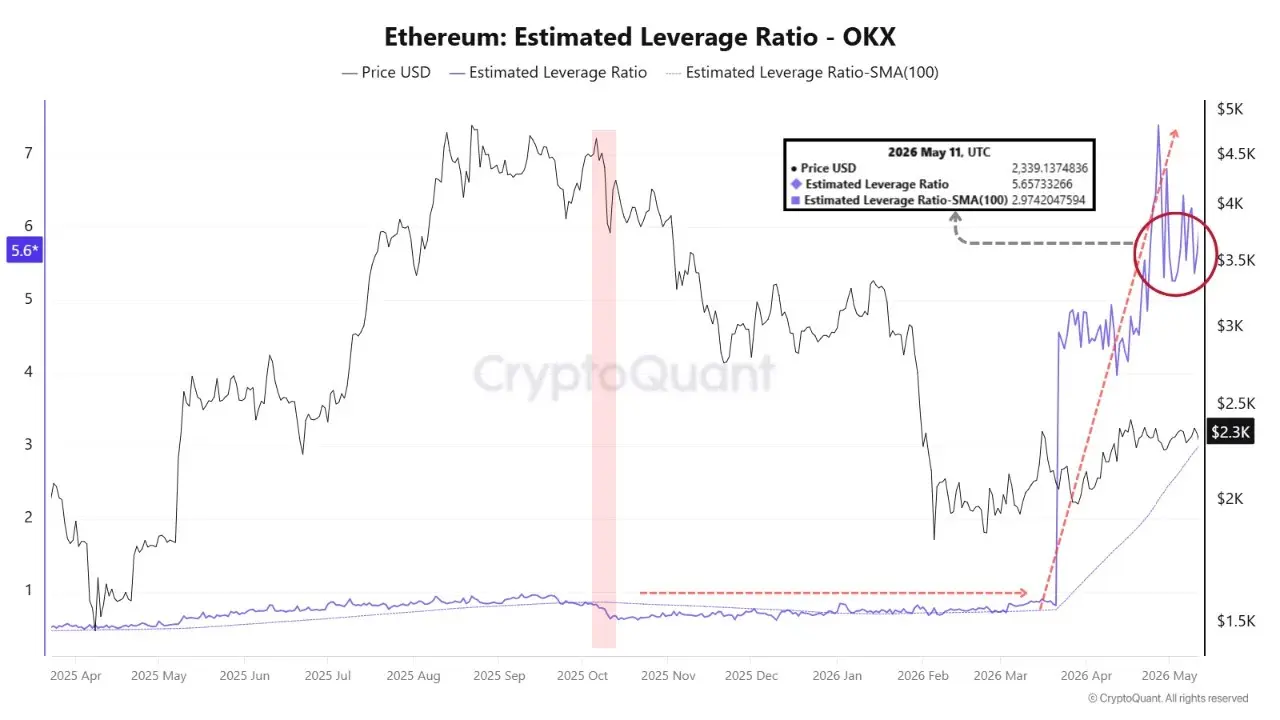 Ethereum Estimated Leverage Ratio – OKX | Source: CryptoQuantThe same Ethereum price. Two very different risk structures. MorenoDV’s analysis examines what that divergence means for the market — and who benefits from it and who is exposed by it.
The Exchange That Criticized Binance Is Now Running the More Extreme Leverage Imbalance
MorenoDV’s analysis names the structural risk with precision. When the Estimated Leverage Ratio rises because open interest is expanding while reserves are simultaneously shrinking — which is exactly what the OKX data describes — the market structure becomes fragile in a specific and documented way.
Liquidation cascades become more likely. Sharp wicks appear with less provocation. Forced deleveraging can accelerate a move that would otherwise be orderly. The issue is not that traders are using leverage — leverage is a permanent feature of derivatives markets. The issue is that the leverage is sitting on a reserve base that has shrunk by 82% since October, leaving far less underlying ETH to absorb stress when it arrives.
The narrative dimension MorenoDV identifies adds a layer that the numbers alone do not capture. Following the October 10 crash, Binance faced significant scrutiny — including from OKX leadership. Today, based purely on the ETH Estimated Leverage Ratio, OKX is the venue carrying the more extreme derivatives imbalance relative to its available reserves. The exchange that pointed fingers is running the more stretched structure.
Related Reading
The honest calibration of the analysis matters. ELR is not a solvency metric. A high ratio does not mean OKX is in danger or that a crisis is approaching. What it means — specifically, from a market-risk perspective — is that Ethereum’s derivatives market on OKX is significantly more sensitive to adverse price movements than the equivalent structure on Binance.
When volatility arrives, the venue with 5.6x leverage on a depleted reserve base will feel it differently than the one holding under 1x.
Ethereum Price Action Holds Critical Support
Ethereum continues trading in a narrow consolidation range near $2,260 after failing to produce a decisive breakout above the $2,400 region. The daily chart shows ETH entering a period of compression, with price action flattening after the strong recovery from February lows around $1,800. Momentum has clearly cooled, and traders now appear to be waiting for a catalyst capable of forcing direction.
Related Reading
However, upside progress remains constrained. The 50-day and 100-day moving averages are converging around current price levels, while the long-term 200-day moving average above $2,600 continues to slope downward, signaling that the broader market structure has not fully transitioned back into a bullish regime.
Volume also remains relatively muted compared to the surge seen during February’s capitulation and subsequent rebound. Lower participation during consolidation often precedes expansion. For ETH, the market appears to be coiling around support while waiting for confirmation of its next major move.
Featured image from ChatGPT, chart from TradingView.com