Square
Following
Hot
News
Profile
Share your thoughts
placeholder
Article
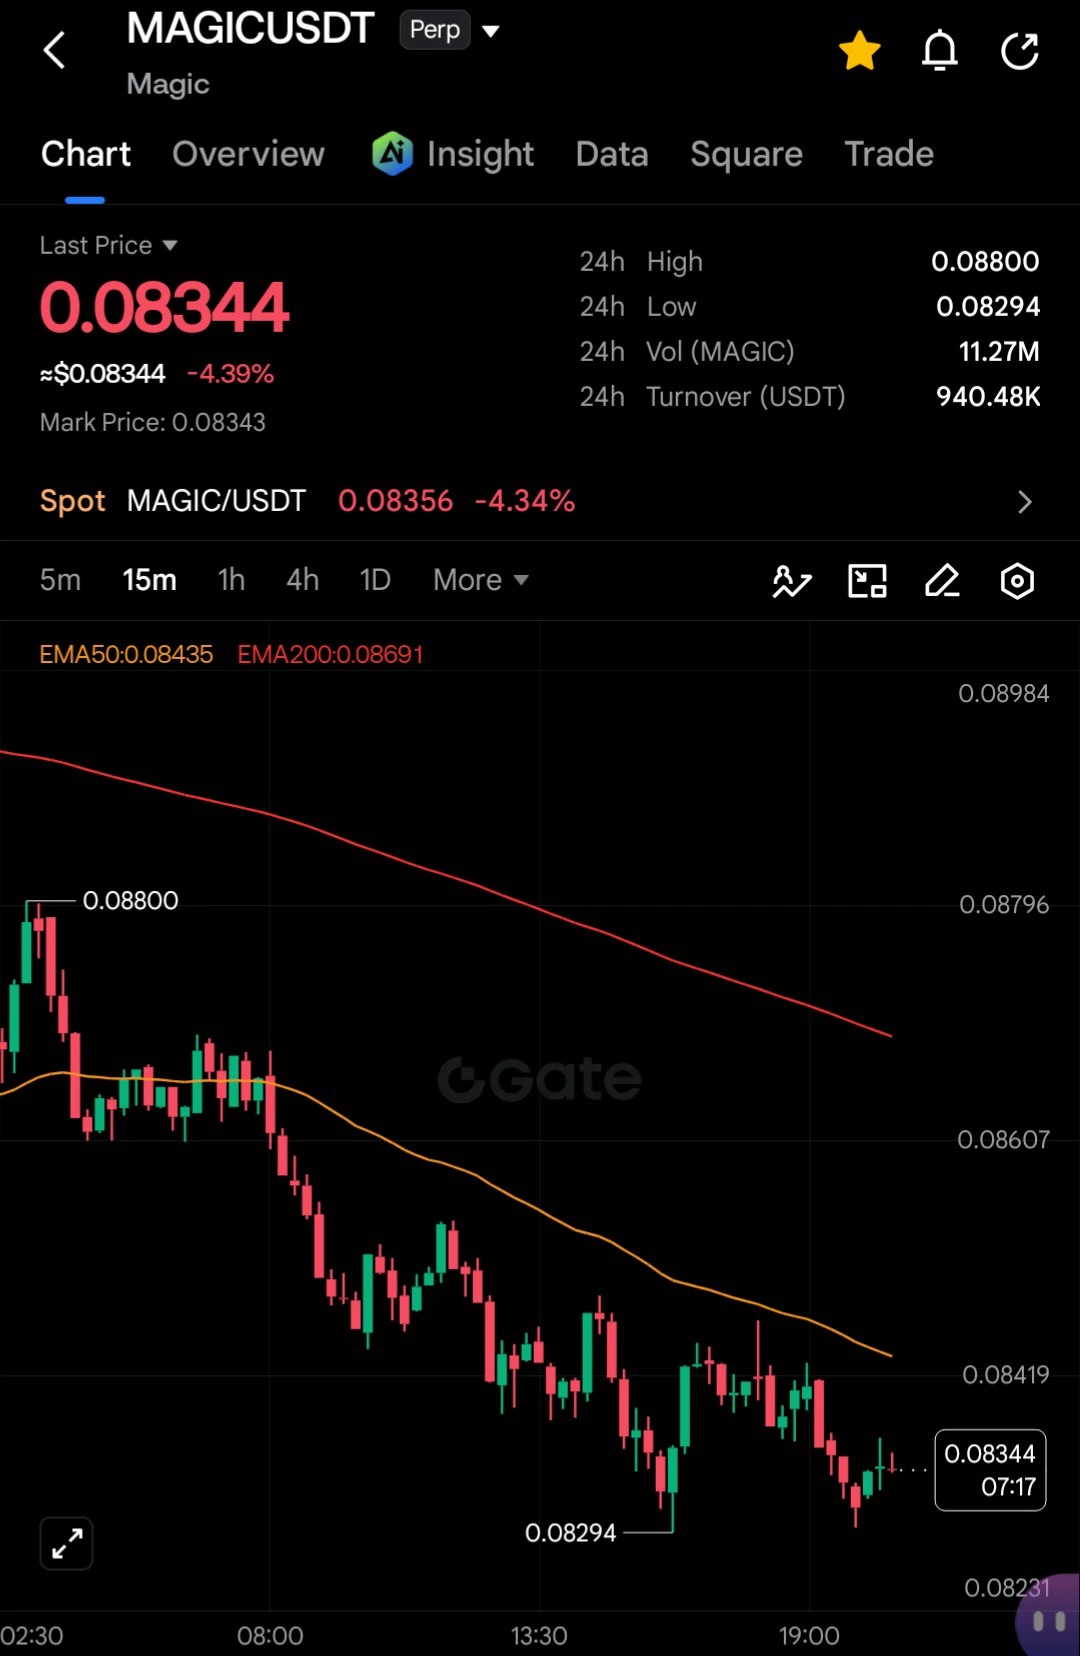
MAGIC/USDT
​Trading Scenarios & Opportunities
​Given that the short-term trend remains bearish, the most sensible approach is to follow the trend (trend-following) or wait for confirmation of a reversal at a strong support area.
​Scenario 1: Short / Sell on Strength (Following the Main Trend)
​Reason: The price is below the 50 EMA and 200 EMA, indicating that the downtrend remains strong.
​Entry Opportunity: Wait for an upward correction (pullback) toward the 50 EMA (around 0.0843 – 0.0845) or the nearest resistance area if a rejection candle (rejection / bearish candle) appears.
​Take Profi
post-image
MAGIC-2.93%
  • 1
10.25 Jinying Gold Weekly Outlook: Gold prices lose the 4,000 level! Bears take full control; sell rallies with the trend!
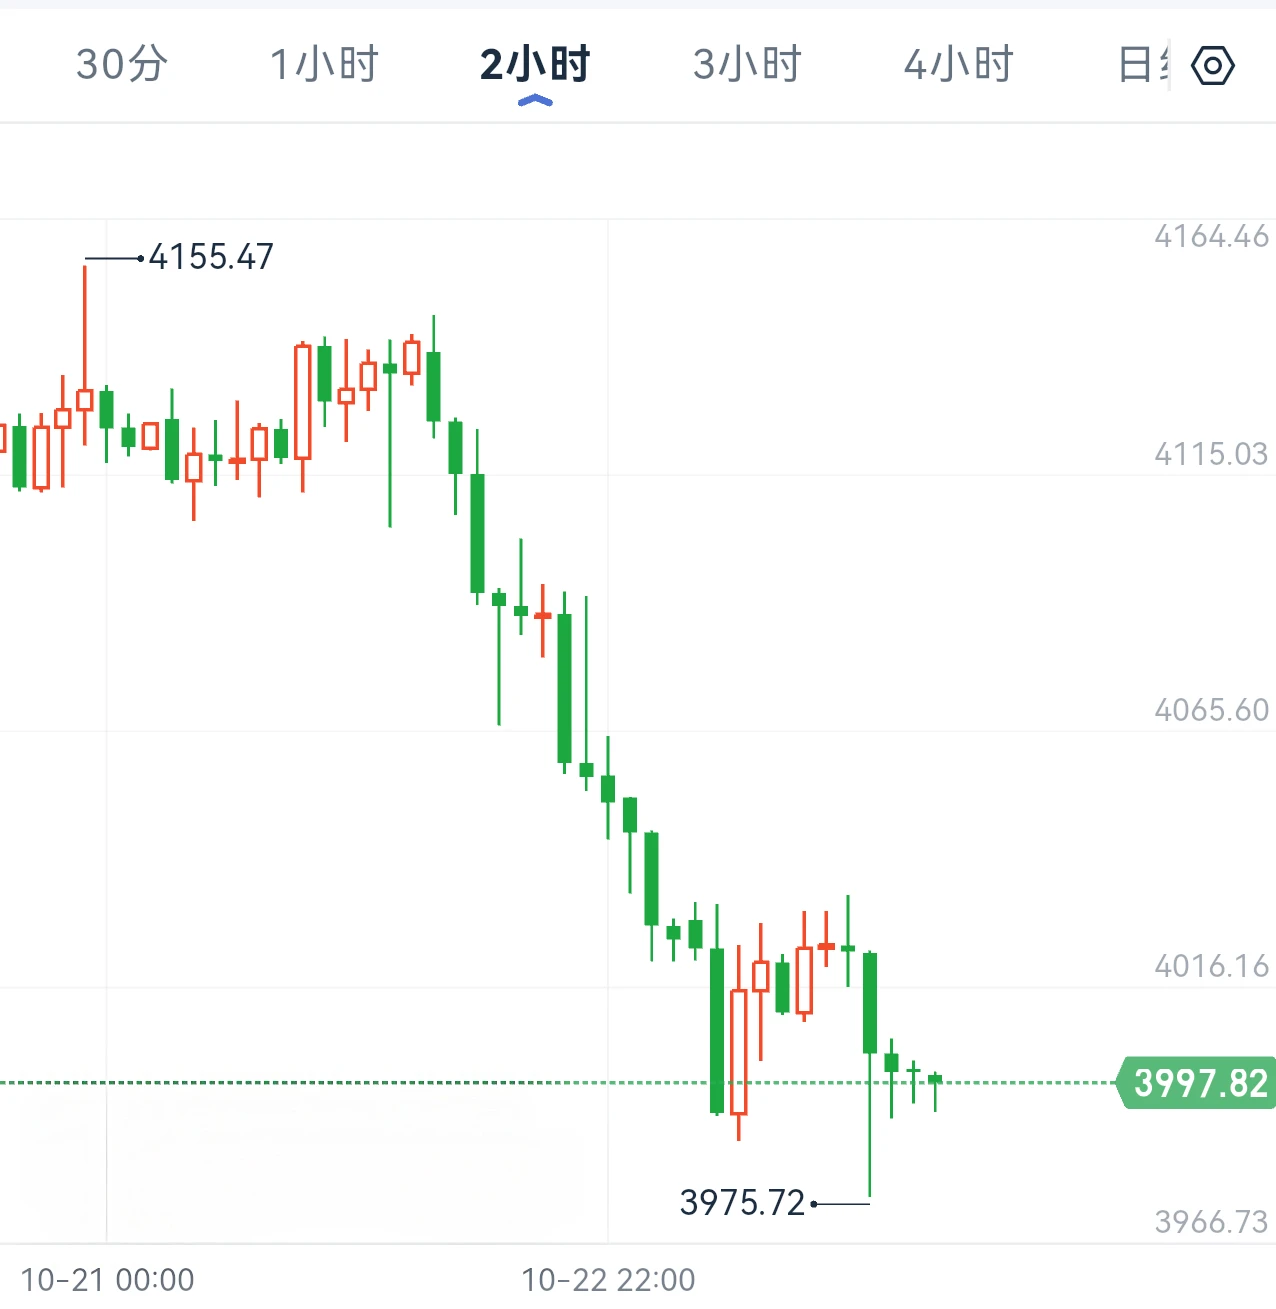
Spot gold fell steadily from this week's high of 4,198, weakening in stages and successively breaking through multiple support levels. The decline accelerated at the end of the week, breaking below the 4,000 mark and reaching a low of 3,975, its lowest level in this phase. It is currently consolidating weakly around 3,997, with bears fully in control of the market.
On the news front, expectations for Fed rate cuts continue to cool, while rising Treasury yields and a strong
post-image
BTC+1.21%
ETH+1.39%
Trenches
STONK
S
bade
b
STONK
6GmA...UNgx
Market Cap
$.
Change
.
24h Vol
$.
Holders
.
BTC
B
bade
b
BTC
C5xp...pump
Market Cap
$.
Change
.
24h Vol
$.
Holders
.
CNPY
C
bade
b
CNPY
0xc6...ddd2
Market Cap
$.
Change
.
24h Vol
$.
Holders
.
ZIG
Z
bade
b
ZIG
0x8c...1145
Market Cap
$.
Change
.
24h Vol
$.
Holders
.
LIGHT
L
bade
b
LIGHT
0x47...3c0e
Market Cap
$.
Change
.
24h Vol
$.
Holders
.
What Is the Break-Even Line?
For beginners just starting to trade futures, a common question is: Why hasn’t my account fully broken even when the price returns near my entry price? This has to do with the “break-even line.” Simply put, the break-even line is the price at which an account reaches a “neither profit nor loss” state after factoring in costs such as trading fees and funding rates. Since both opening and closing a position may incur fees, the actual break-even price usually won’t be exactly the same as the entry price. For example, in futures trading, if the price only returns to th
post-image
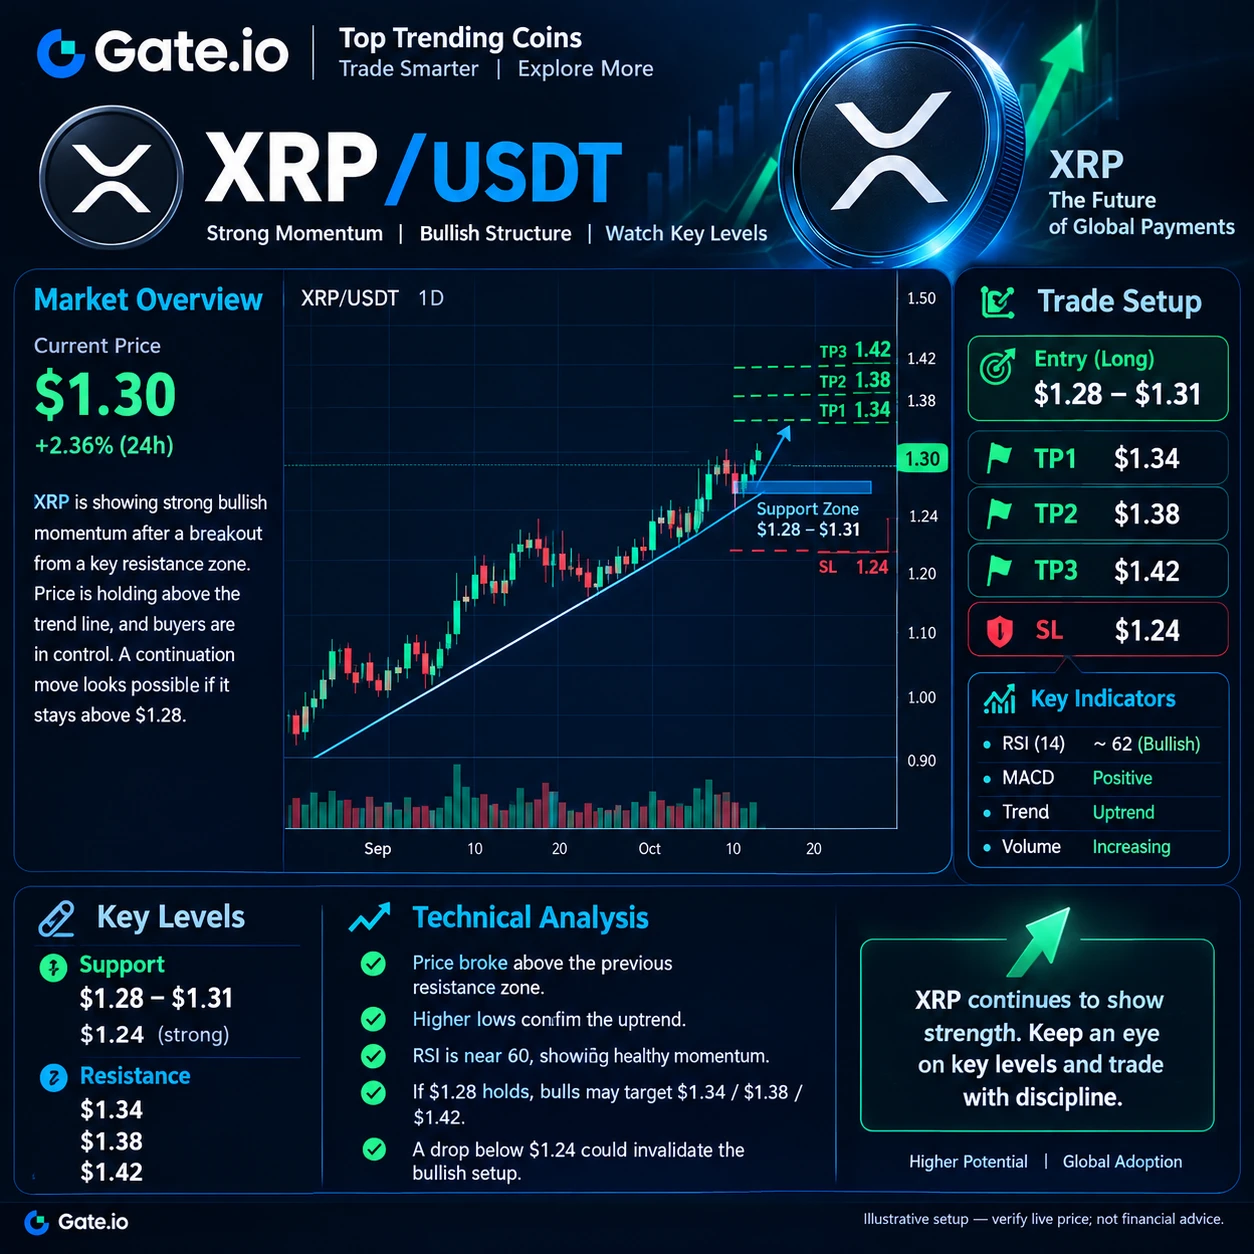
XRP/USDT Technical Analysis — Can Buyers Push Higher?
XRP is trading near $1.30, with the $1.34 resistance level acting as the first upside target in this illustrative setup. Holding the $1.28–$1.31 area could help maintain bullish momentum. If support breaks, traders should watch for a possible correction rather than assuming the uptrend will continue.
Trade Setup (Illustrative)
- Entry Zone: $1.28–$1.31
- TP1: $1.34
- TP2: $1.38
- TP3: $1.42
- Stop Loss: $1.24
- Support: $1.28 / $1.24
- Resistance: $1.34 / $1.42
A breakout supported by volume would improve the bullish case. Confirm the lates
post-image
XRP+2.75%
  • 1
The largest on-chain short position for HYPE is valued at $54.57 million, with an unrealized profit
live-cover
LIVE1,932
#USEarningsSeason #ShareWeekly
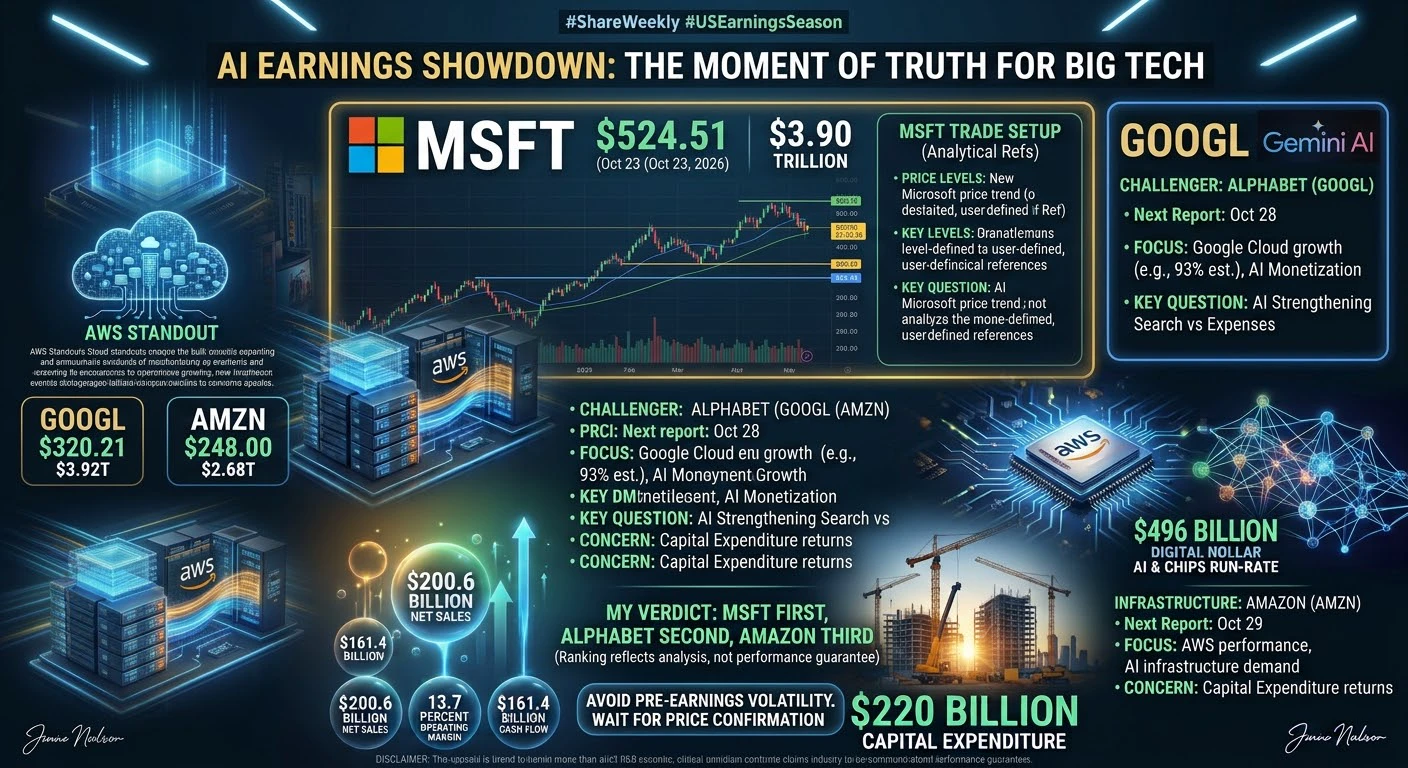
Microsoft vs Alphabet vs Amazon: AI Earnings Could Trigger the Next Big Tech Move
The US tech earnings season is entering a critical stage. Microsoft, Alphabet, and Amazon are preparing to report their results, and investors are focused on one major question: Can AI investments generate enough revenue and profit to justify billions of dollars in spending?
My top pick is Microsoft because it combines Azure cloud growth, recurring software revenue, enterprise AI adoption, and strong financial foundations. However, Alphabet and Amazon also have significant growth o
post-image
MSFT+0.56%
GOOGL-1.21%
AMZN-0.97%
Floki all time high hype ath go
post-image
FLOKI+1.13%
HYPE
Yesterday, the market maker basically followed our script
Yesterday's analysis identified the key price zone of 74.5–76 as an area to trade for 1–2 opportunities
Looking back at the candlestick chart now, the timing was basically perfect
HYPE+3.08%
  • 2
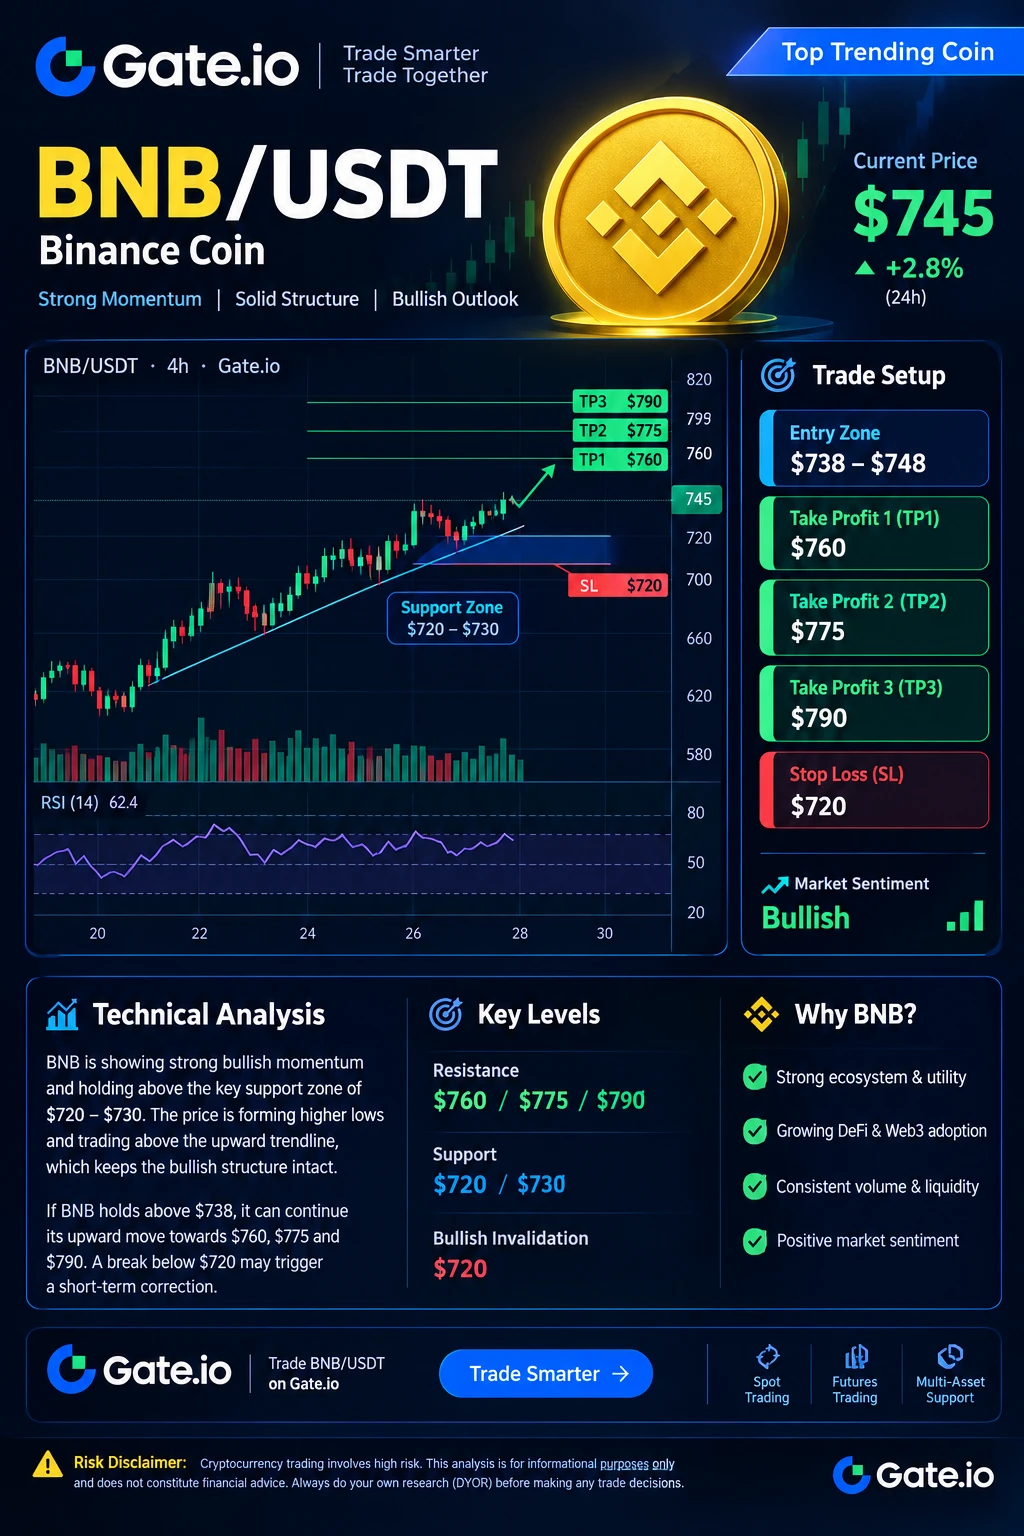
BNB/USDT Technical Analysis — Key Resistance Levels
BNB is trading around $745, with traders watching the $760 area for a possible breakout. If buyers maintain support around $738–$748, the next potential targets are $775 and $790. A breakdown below $720 would weaken this bullish scenario and could lead to further downside.
Trade Setup (Illustrative)
- Entry Zone: $738–$748
- TP1: $760
- TP2: $775
- TP3: $790
- Stop Loss: $720
- Support: $730 / $720
- Resistance: $760 / $790
Watch the overall market trend and trading volume for confirmation. Use a predefined risk limit rather than relying on a
post-image
BNB+2.77%
  • 1
damn @DekmarTrades its been that long since i started following your journey! 2015!
Congrats on your success!
post-image
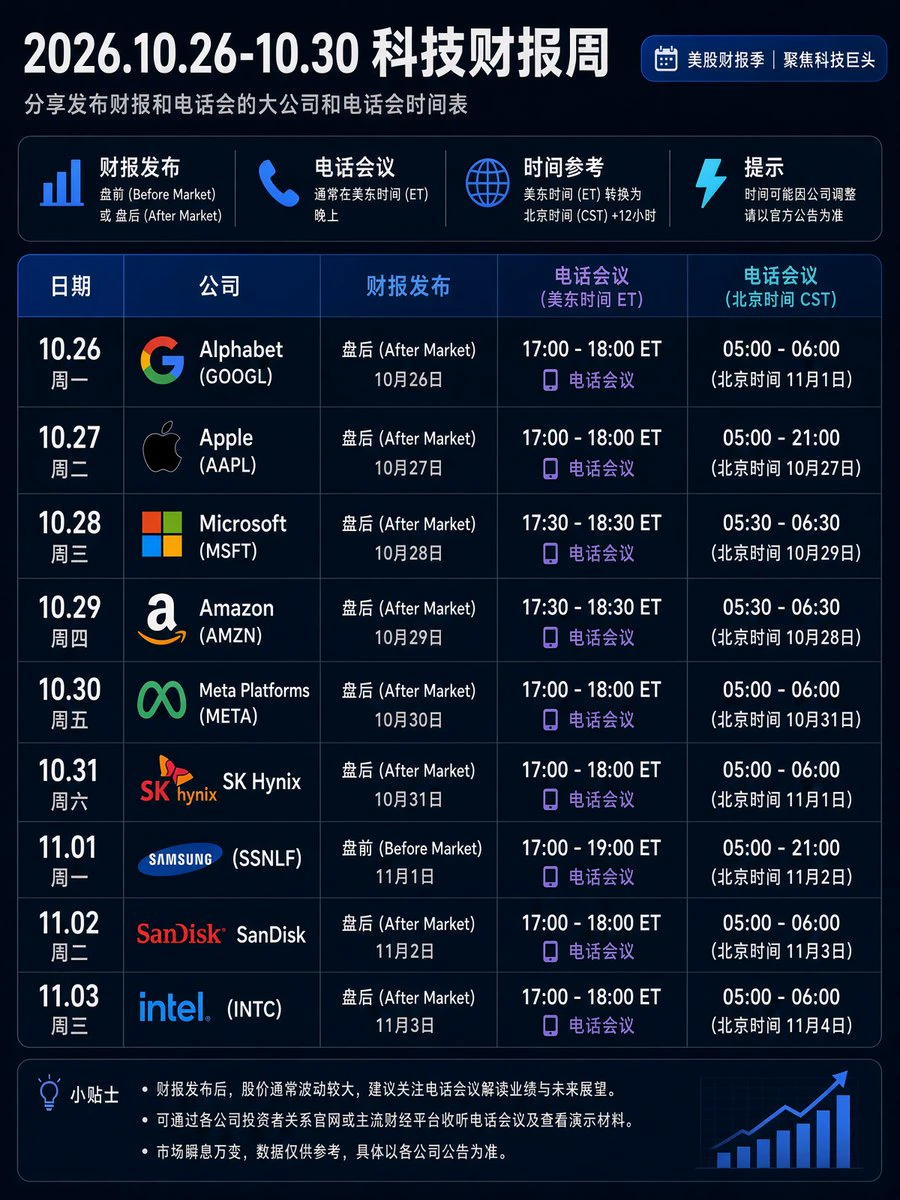
#科技财报周 Looking forward to the midterm elections next week and the week after, DDDD
post-image
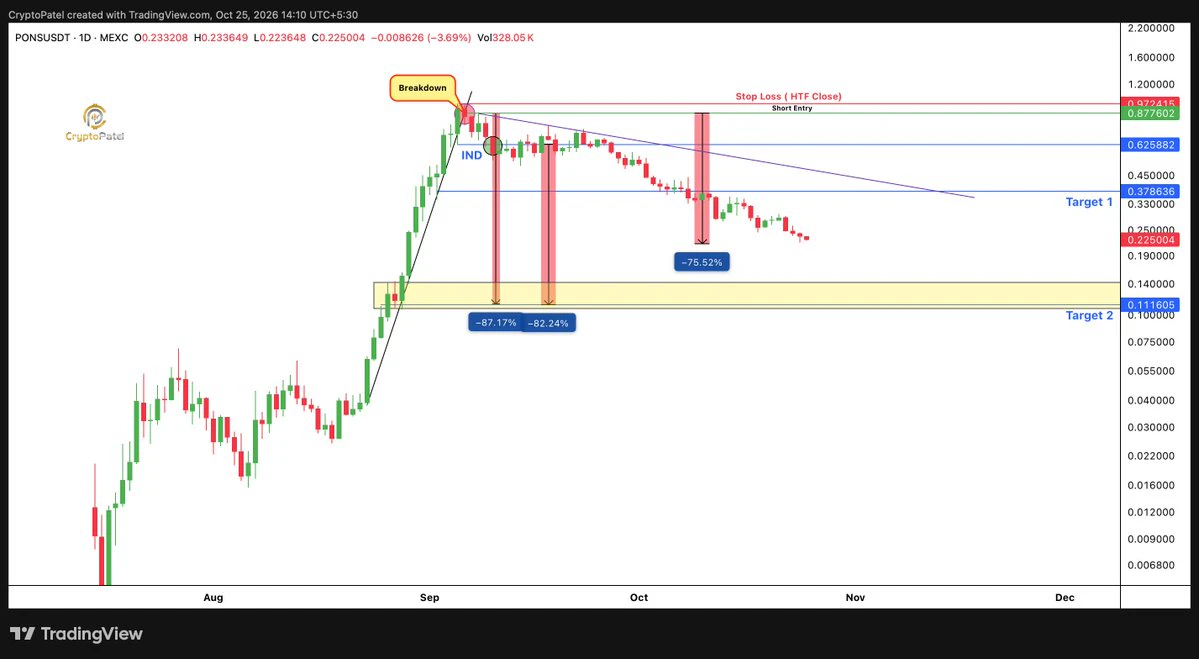
$PONS Update: #PONS revenue has dropped from around ~$2M per day to just $36K.
Fees once reached $11M.
I’m watching for an entry below $0.14-$0.11.
Will wait for the right opportunity.
post-image
PONS+7.38%
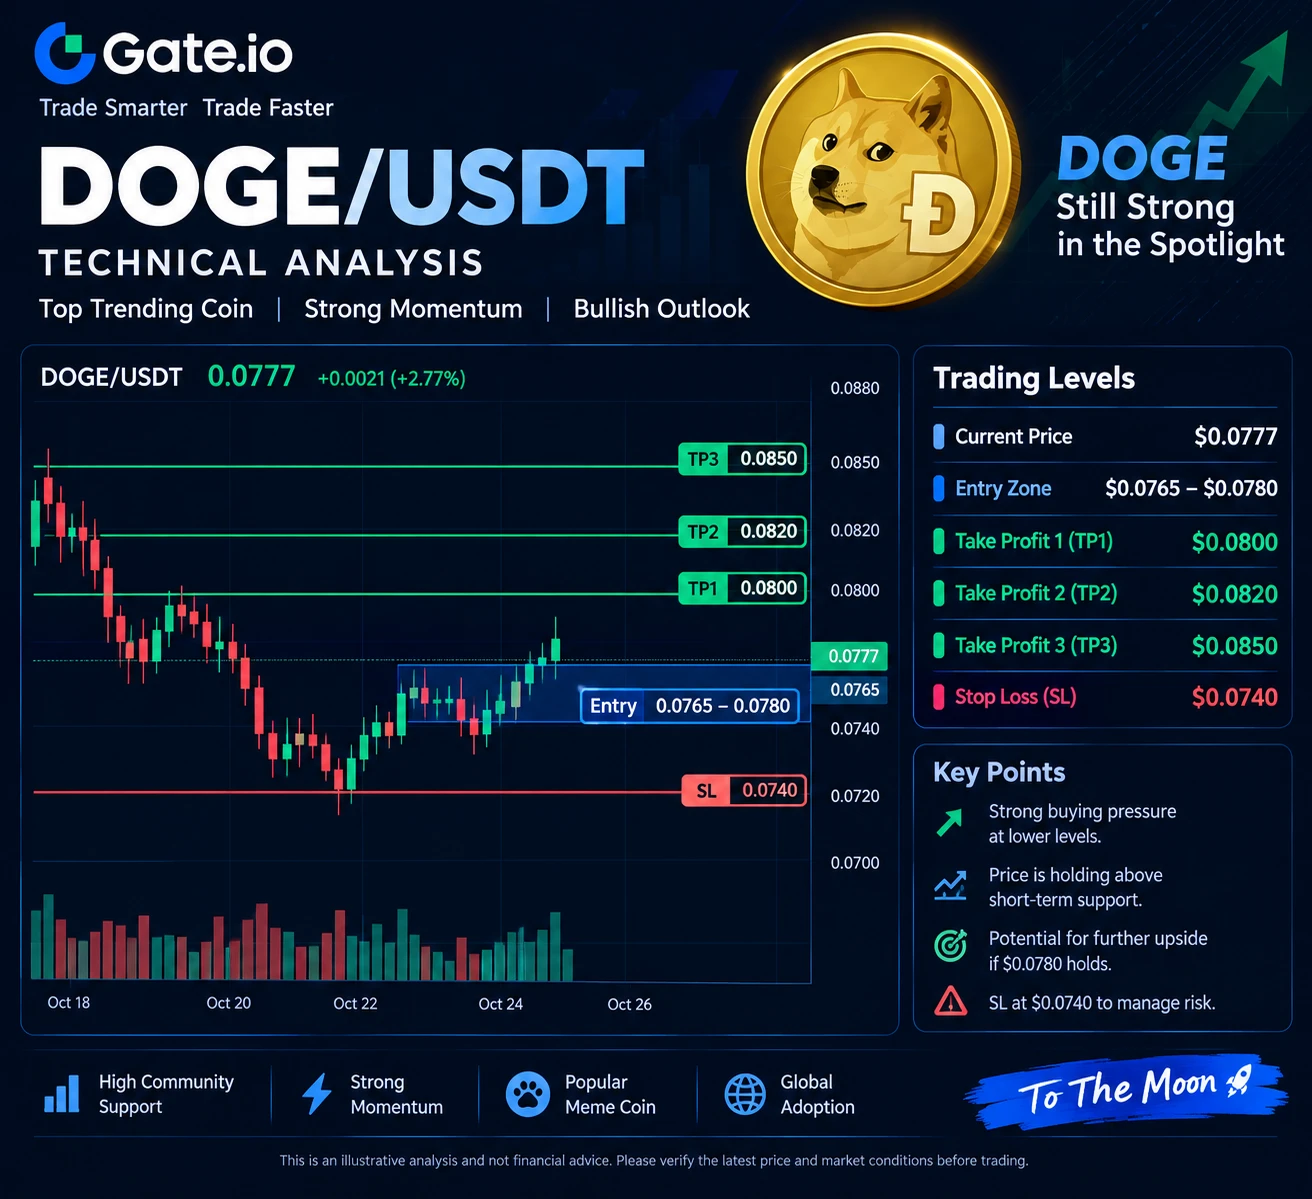
DOGE/USDT Technical Analysis — Watching the Next Move
Dogecoin remains a popular market to watch because of its volatility and strong community interest. Around $0.077, traders can monitor whether DOGE holds the $0.0765–$0.0780 area and attempts a recovery toward $0.0800. Since meme coins can move sharply in either direction, risk management is particularly important.
Trade Setup (Illustrative)
- Entry Zone: $0.0765–$0.0780
- TP1: $0.0800
- TP2: $0.0820
- TP3: $0.0850
- Stop Loss: $0.0740
- Support: $0.0765 / $0.0740
- Resistance: $0.0800 / $0.0850
A sustained move above $0.0800 could support
post-image
DOGE+2.21%
  • 1
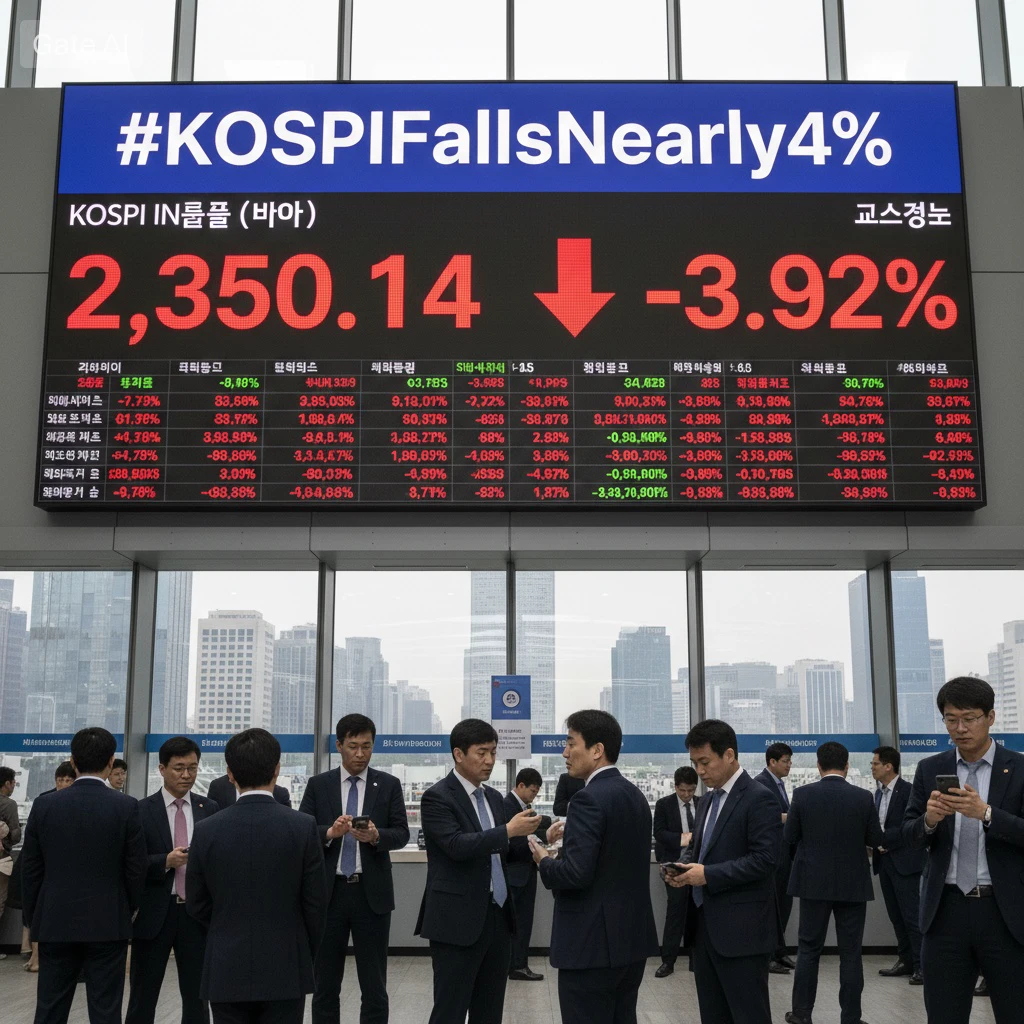
#KOSPIFallsNearly4%
KOSPI FALLS NEARLY 4% AS MARKET SELLING PRESSURE INCREASES
South Korea’s KOSPI market faces significant selling pressure, with the index falling nearly 4%. The sharp decline highlights growing market volatility and concerns among investors about the near-term direction of equities.
A broad market sell-off can reflect profit-taking, uncertainty surrounding global economic conditions, and weakness in major technology stocks. Investors are now watching closely for signs of stabilization and a potential recovery.
The next sessions will be important in determining whether the d
post-image
INDEX+6.68%
  • 1
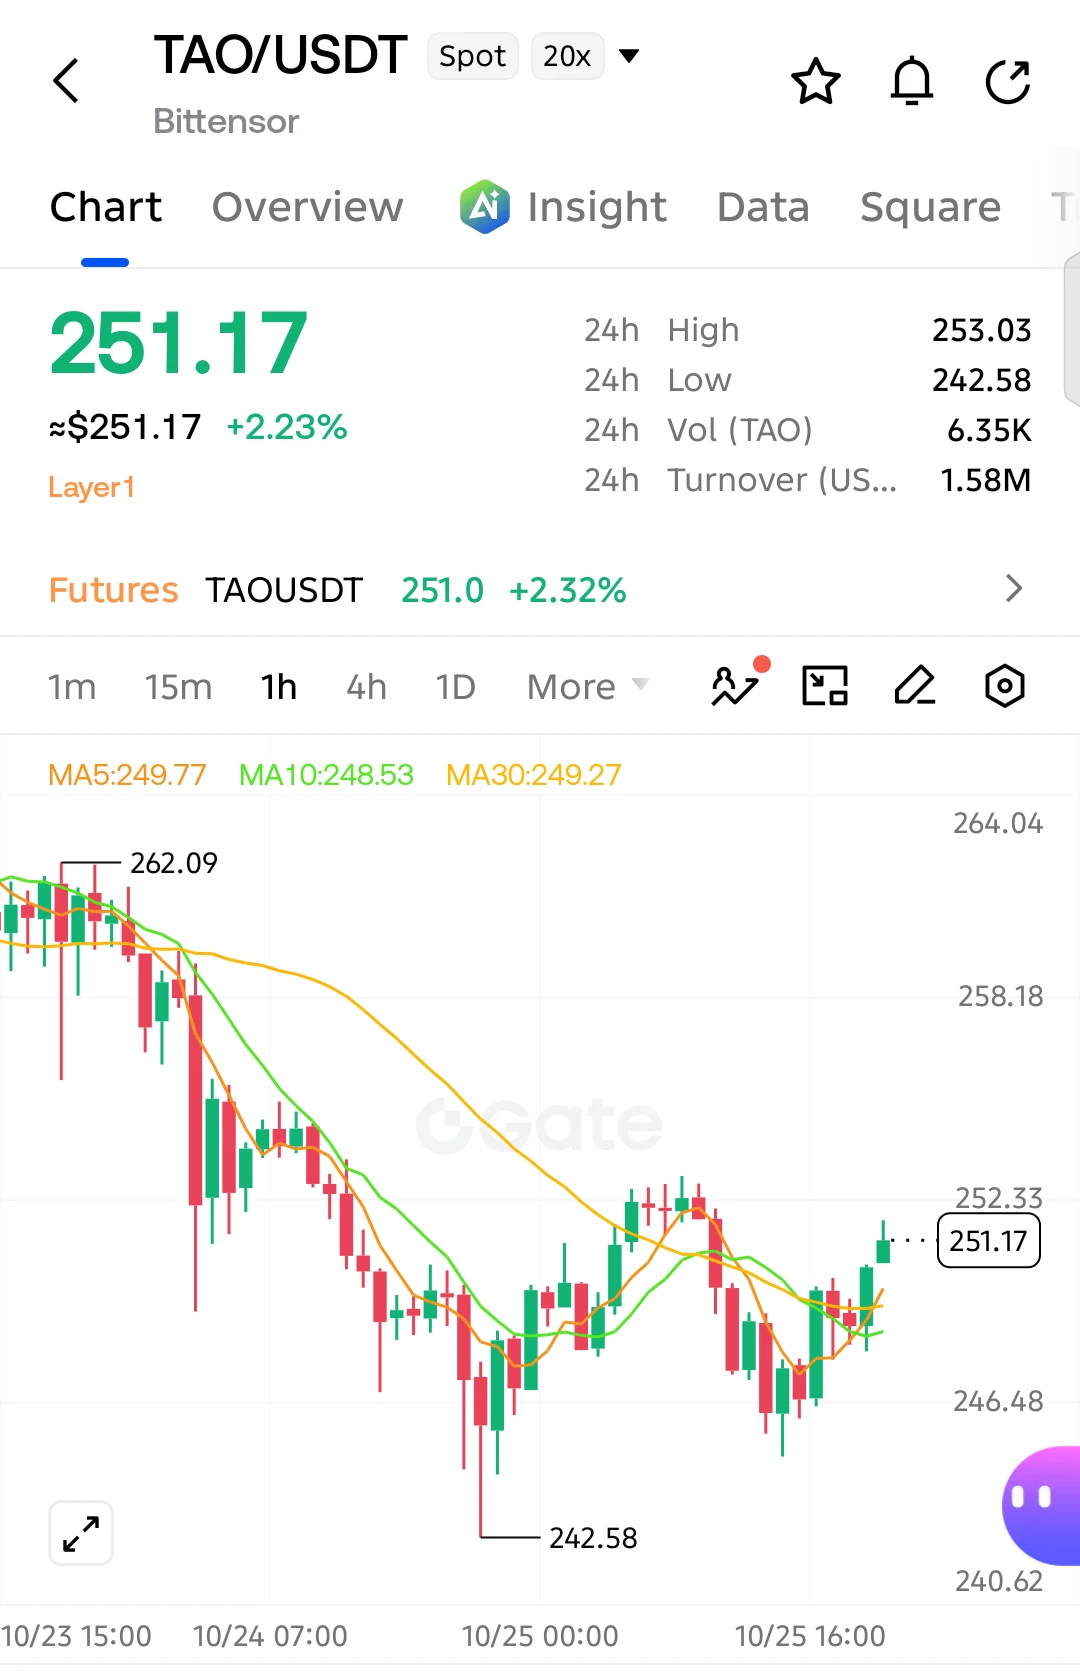
$TAO
Bouncing from 242.58, now pressing 262.09. Price is reclaiming the MAs—bullish momentum building after a choppy base. Break above 253.03 triggers continuation; rejection retests 249.77. Watching for a clean close to confirm the next leg.
Entry Zone: 249.00 – 251.50
TP1: 253.03
TP2: 258.18
TP3: 262.09
Stop-Loss: 245.00
#TAO #ShareWeekly #USEarningsSeason #GateWCTCS9GlobalTradingCompetition #USConsumerSentimentNearRecordLow
post-image
TAO+2.46%
  • 1
$RE #RE
Consolidating on the key support of Descending Triangle.
Bounce could follow our projected move for a solid rise✍️
RE+4.90%
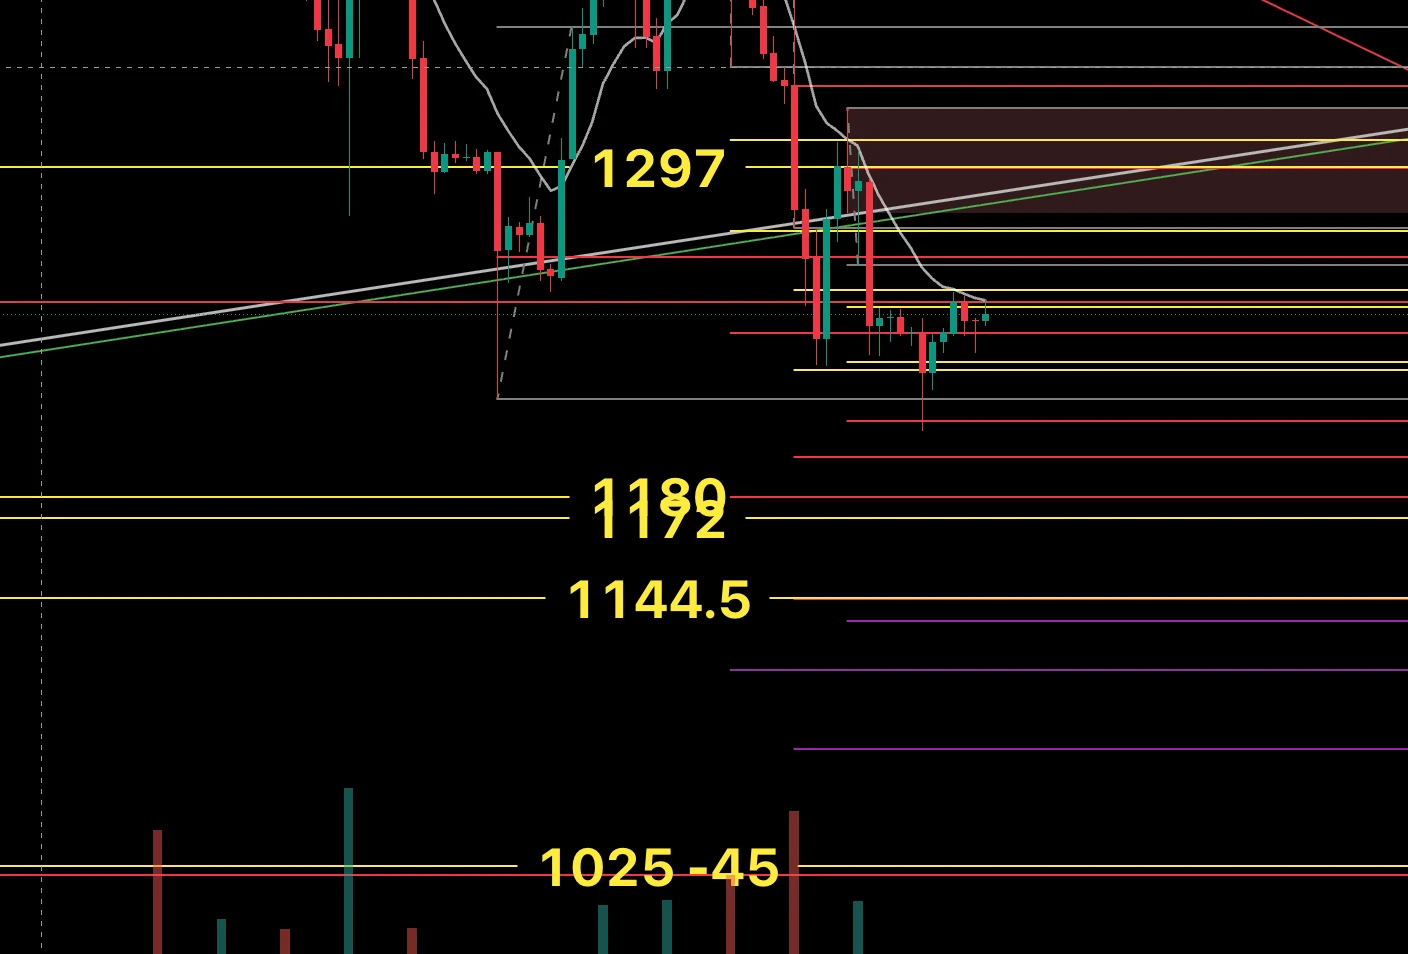
For SanDisk, Sunday evening to Monday morning:
Some extreme levels in case it continues to wick:
Potential levels to try longs or add to positions below: 1180 & 1172
Extreme level: 1125-45
A small short position can be placed at 1297
‍#​SNDK #btc $SNDK
post-image
SNDK+2.33%
RWA has been booming this year, but among several altcoins built around the RWA narrative, only one actually shares interest with holders:
$ONDO is currently the leading project by business scale, but its token captures no value. Its own dollar-yield product has surpassed BlackRock’s and grown to over $2 billion, but ONDO is just a governance token, and not a cent of protocol fees flows to the token.
ONDO’s MA7 (0.430)/MA20 (0.455)/MA30 (0.473) are all overhead, RSI at 32 is nearing oversold, its 30-day range position of 1.3% is close to the monthly low, and it’s down 26.3% for the month. It’
post-image
ONDO+0.97%
PENDLE+1.53%
CFG-0.28%
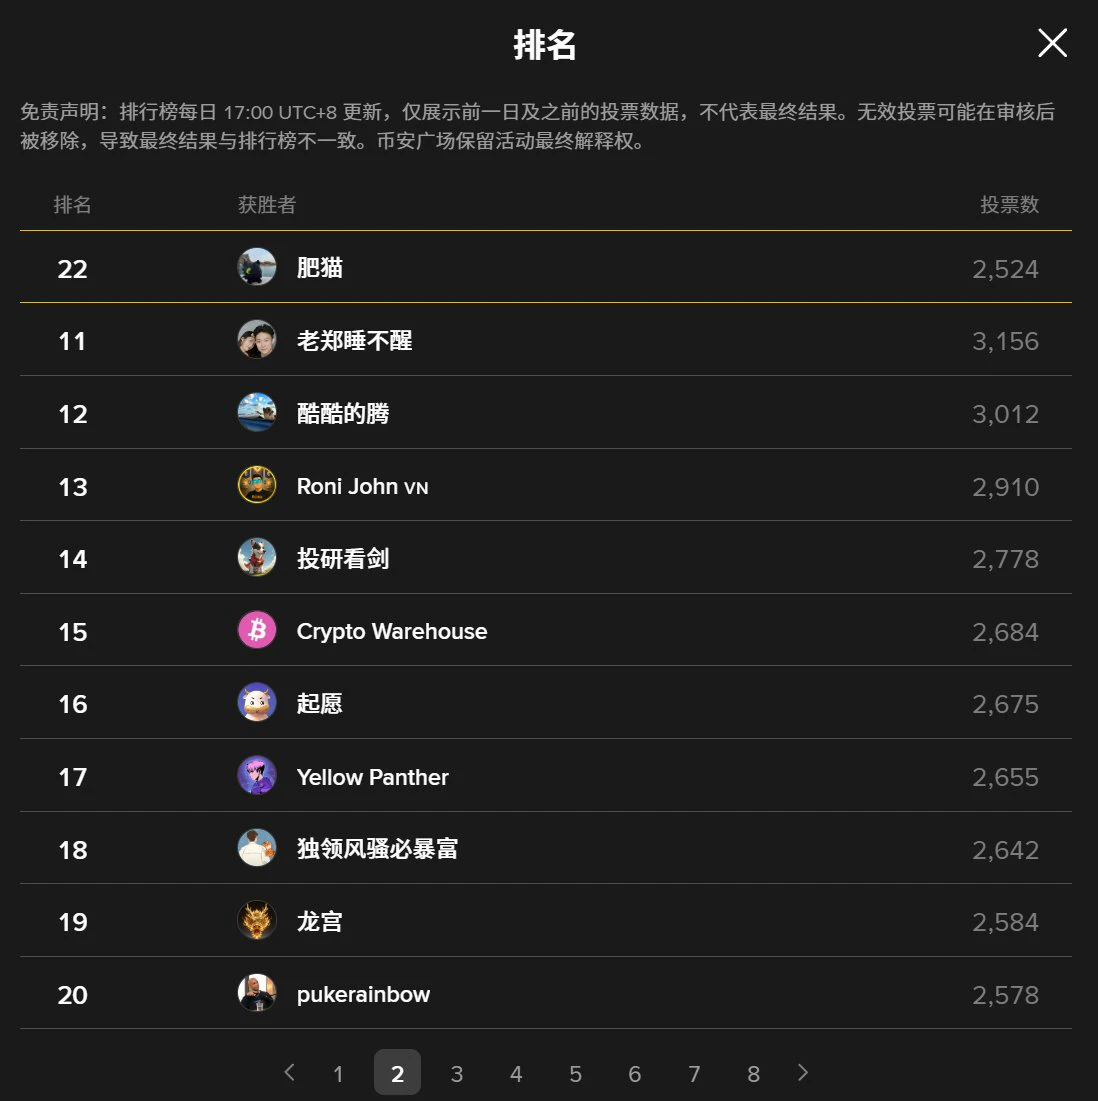
The gap is starting to narrow, everyone...
I hope everyone can help cast a vote. Thanks!
Voting link:
post-image
Load More

Join 40 M users in our growing community

⚡️ Join 40 M users in the crypto craze discussion

💬 Engage with your favorite top creators

👍 See what interests you

Trending Topics

USEarningsSeason

95.11k Views3.5k Discussing

The U.S. Q3 earnings season is in full swing, with major tech companies including Tesla and Meta reporting results. Market focus is shifting beyond revenue and profit toward AI spending, capital expenditure, margins and forward guidance. Which company’s earnings are you watching most closely?

GateWCTCS9GlobalTradingCompetition

706.48k Views8.06k Discussing

USConsumerSentimentNearRecordLow

10.9k Views293 Discussing

View More