Фьючерсы
Доступ к сотням фьючерсов
CFD
Золото
Одна платформа мировых активов
Опционы
Hot
Торги опционами Vanilla в европейском стиле
Единый счет
Увеличьте эффективность вашего капитала
Демо-торговля
Введение в торговлю фьючерсами
Подготовьтесь к торговле фьючерсами
Фьючерсные события
Получайте награды в событиях
Демо-торговля
Используйте виртуальные средства для торговли без риска
Запуск
CandyDrop
Собирайте конфеты, чтобы заработать аирдропы
Launchpool
Быстрый стейкинг, заработайте потенциальные новые токены
HODLer Airdrop
Удерживайте GT и получайте огромные аирдропы бесплатно
Pre-IPOs
Откройте полный доступ к глобальным IPO акций
Alpha Points
Торгуйте и получайте аирдропы
Фьючерсные баллы
Зарабатывайте баллы и получайте награды аирдропа
Инвестиции
Simple Earn
Зарабатывайте проценты с помощью неиспользуемых токенов
Автоинвест.
Автоинвестиции на регулярной основе.
Бивалютные инвестиции
Доход от волатильности рынка
Мягкий стейкинг
Получайте вознаграждения с помощью гибкого стейкинга
Криптозаймы
0 Fees
Заложите одну криптовалюту, чтобы занять другую
Центр кредитования
Единый центр кредитования
Рекламные акции
Промоакции
Участвуйте и получайте награды
Реферал
20 USDT
Приглашайте друзей за бонусы
Партнерская программа
Эксклюзивные комиссионные
Gate Booster
Растите влияние и получайте аирдроп
Анонсы
Обновления в реальном времени
Блог Gate
Статьи о криптоиндустрии
VIP-услуги
Огромные скидки на комиссии
Управление активами
Универсальное решение для управления активами
Институциональный
Крипто-решения для бизнеса
Разработчикам (API)
Подключение к экосистеме приложений Gate
Внебиржевые банковские переводы
Ввод и вывод фиатных денег
Брокерская программа
Щедрые механизмы скидок API
AI
Gate AI
Ваш универсальный AI-ассистент для любых задач
Gate AI Bot
Используйте Gate AI прямо в вашем социальном приложении
GateClaw
Gate Синий Лобстер — готов к использованию
Gate for AI Agent
AI-инфраструктура: Gate MCP, Skills и CLI
Gate Skills Hub
Более 10 тыс навыков
От офиса до трейдинга: единая база навыков для эффективного использования ИИ
GateRouter
Умный выбор из более чем 40 моделей ИИ, без дополнительных затрат (0%)
Traders Face A Fragile Setup
Ethereum is consolidating between $2,250 and $2,450 as the market searches for the catalyst or the structural shift that forces a decisive move in either direction. The price is holding but not breaking — and CryptoQuant analyst MorenoDV has identified a divergence in the derivatives data across two of the largest exchanges in the world that adds a specific risk dimension to the current setup that most participants are not watching.
Related Reading
The analysis examines the Estimated Leverage Ratio — the measure of how much derivatives exposure is being built on top of the ETH reserve base held by each exchange. A higher ratio does not automatically signal danger, but it does describe a more sensitive market structure: more open positions relative to available reserves means more potential volatility per unit of the underlying asset, and a lower tolerance for adverse price movements before liquidation dynamics begin to take hold.
Since the October 10 crash, Binance’s ETH reserves have declined approximately 5.9% — from 4.037 million to 3.8 million ETH. Over the same period, OKX reserves have collapsed by approximately 82.3%, falling from 861,000 to just 152,600 ETH. Despite that dramatic reserve reduction, OKX’s Estimated Leverage Ratio now sits at approximately 5.6 — meaning derivatives exposure on that venue is 5.6 times the ETH reserve base supporting it. Binance, by contrast, maintains its leverage ratio well under 1x.
Ethereum Estimated Leverage Ratio – Binance | Source: CryptoQuant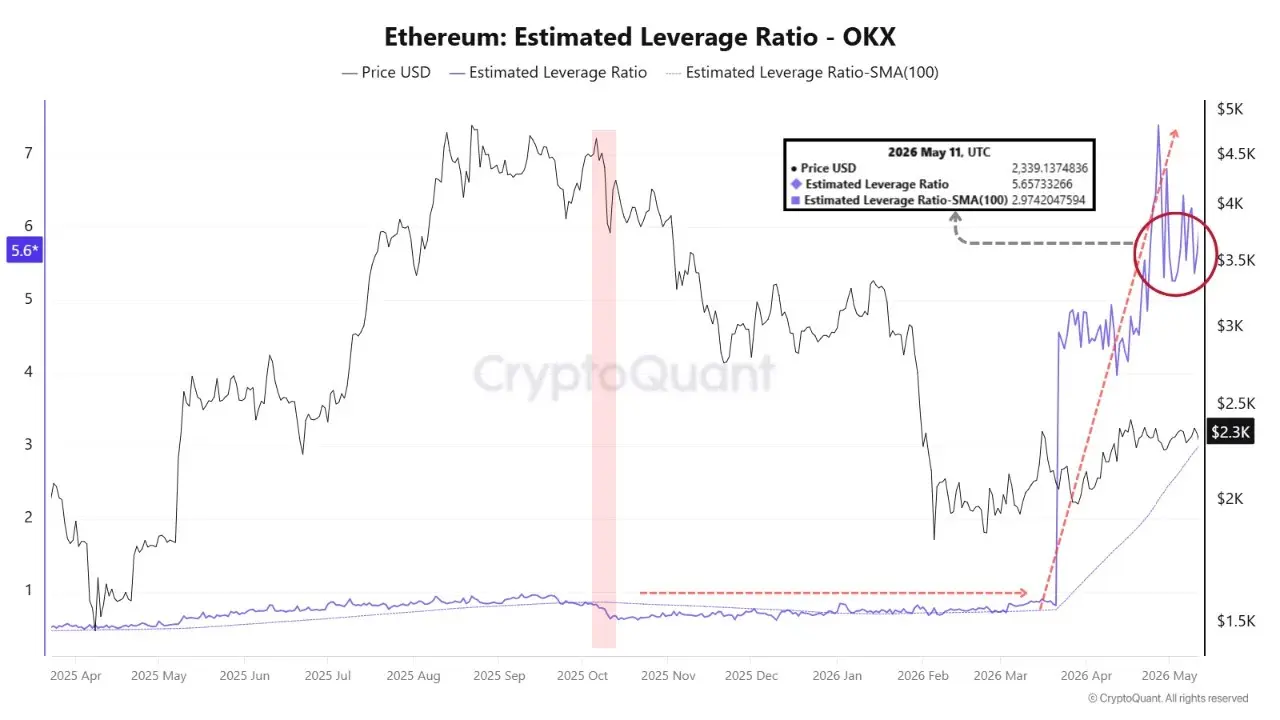 Ethereum Estimated Leverage Ratio – OKX | Source: CryptoQuantThe same Ethereum price. Two very different risk structures. MorenoDV’s analysis examines what that divergence means for the market — and who benefits from it and who is exposed by it.
The Exchange That Criticized Binance Is Now Running the More Extreme Leverage Imbalance
MorenoDV’s analysis names the structural risk with precision. When the Estimated Leverage Ratio rises because open interest is expanding while reserves are simultaneously shrinking — which is exactly what the OKX data describes — the market structure becomes fragile in a specific and documented way.
Liquidation cascades become more likely. Sharp wicks appear with less provocation. Forced deleveraging can accelerate a move that would otherwise be orderly. The issue is not that traders are using leverage — leverage is a permanent feature of derivatives markets. The issue is that the leverage is sitting on a reserve base that has shrunk by 82% since October, leaving far less underlying ETH to absorb stress when it arrives.
The narrative dimension MorenoDV identifies adds a layer that the numbers alone do not capture. Following the October 10 crash, Binance faced significant scrutiny — including from OKX leadership. Today, based purely on the ETH Estimated Leverage Ratio, OKX is the venue carrying the more extreme derivatives imbalance relative to its available reserves. The exchange that pointed fingers is running the more stretched structure.
Related Reading
The honest calibration of the analysis matters. ELR is not a solvency metric. A high ratio does not mean OKX is in danger or that a crisis is approaching. What it means — specifically, from a market-risk perspective — is that Ethereum’s derivatives market on OKX is significantly more sensitive to adverse price movements than the equivalent structure on Binance.
When volatility arrives, the venue with 5.6x leverage on a depleted reserve base will feel it differently than the one holding under 1x.
Ethereum Price Action Holds Critical Support
Ethereum continues trading in a narrow consolidation range near $2,260 after failing to produce a decisive breakout above the $2,400 region. The daily chart shows ETH entering a period of compression, with price action flattening after the strong recovery from February lows around $1,800. Momentum has clearly cooled, and traders now appear to be waiting for a catalyst capable of forcing direction.
Related Reading
However, upside progress remains constrained. The 50-day and 100-day moving averages are converging around current price levels, while the long-term 200-day moving average above $2,600 continues to slope downward, signaling that the broader market structure has not fully transitioned back into a bullish regime.
Volume also remains relatively muted compared to the surge seen during February’s capitulation and subsequent rebound. Lower participation during consolidation often precedes expansion. For ETH, the market appears to be coiling around support while waiting for confirmation of its next major move.
Featured image from ChatGPT, chart from TradingView.com