Square
Following
Hot
News
Profile
Share your thoughts
placeholder
Article
Why did Brent crude fall below $100?
Following the midterm elections, Brent crude oil dropped by as much as 9% to $98.90, falling below the psychological $100 threshold for the first time since early October. This is not merely a price correction; it signals a shift in how the risk of conflict in the Middle East is being priced into the market.
The market is currently recalibrating political risk rather than simply counting barrels.
Why did this political shift drive prices down?
The Democrats' victory in both chambers of Congress has intensified pressure on the White House to bring an end to
post-image
XBRUSD-0.86%
XTIUSD-1.28%
BZ-1.18%
CL-1.83%
  • 9
  • 2
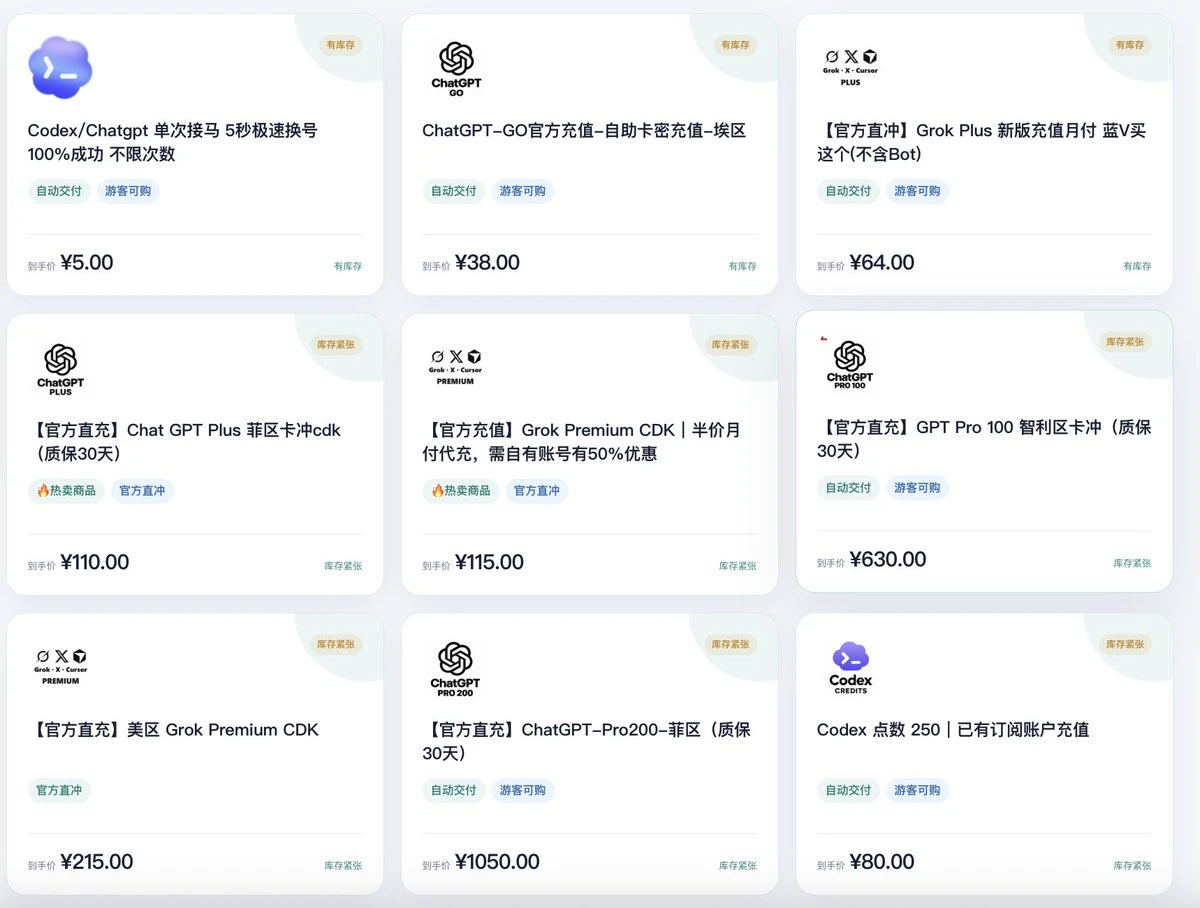
AI top-up source shop looking for agents
Low entry cost—just the price of a Luckin Coffee
Muse finished products will be restocked this afternoon; prices unchanged
I'm the source, I'm the source, I'm the source
Portal:
post-image
Trenches
ZIG
Z
bade
b
ZIG
0x8c...1145
Market Cap
$.
Change
.
24h Vol
$.
Holders
.
BTC
B
bade
b
BTC
C5xp...pump
Market Cap
$.
Change
.
24h Vol
$.
Holders
.
HIGH
H
bade
b
HIGH
7ymF...high
Market Cap
$.
Change
.
24h Vol
$.
Holders
.
STONK
S
bade
b
STONK
6GmA...UNgx
Market Cap
$.
Change
.
24h Vol
$.
Holders
.
LEEROY
L
bade
b
LEEROY
98HE...pump
Market Cap
$.
Change
.
24h Vol
$.
Holders
.
Thrusday Trades with Crypto Sat
live-cover
LIVE1,341
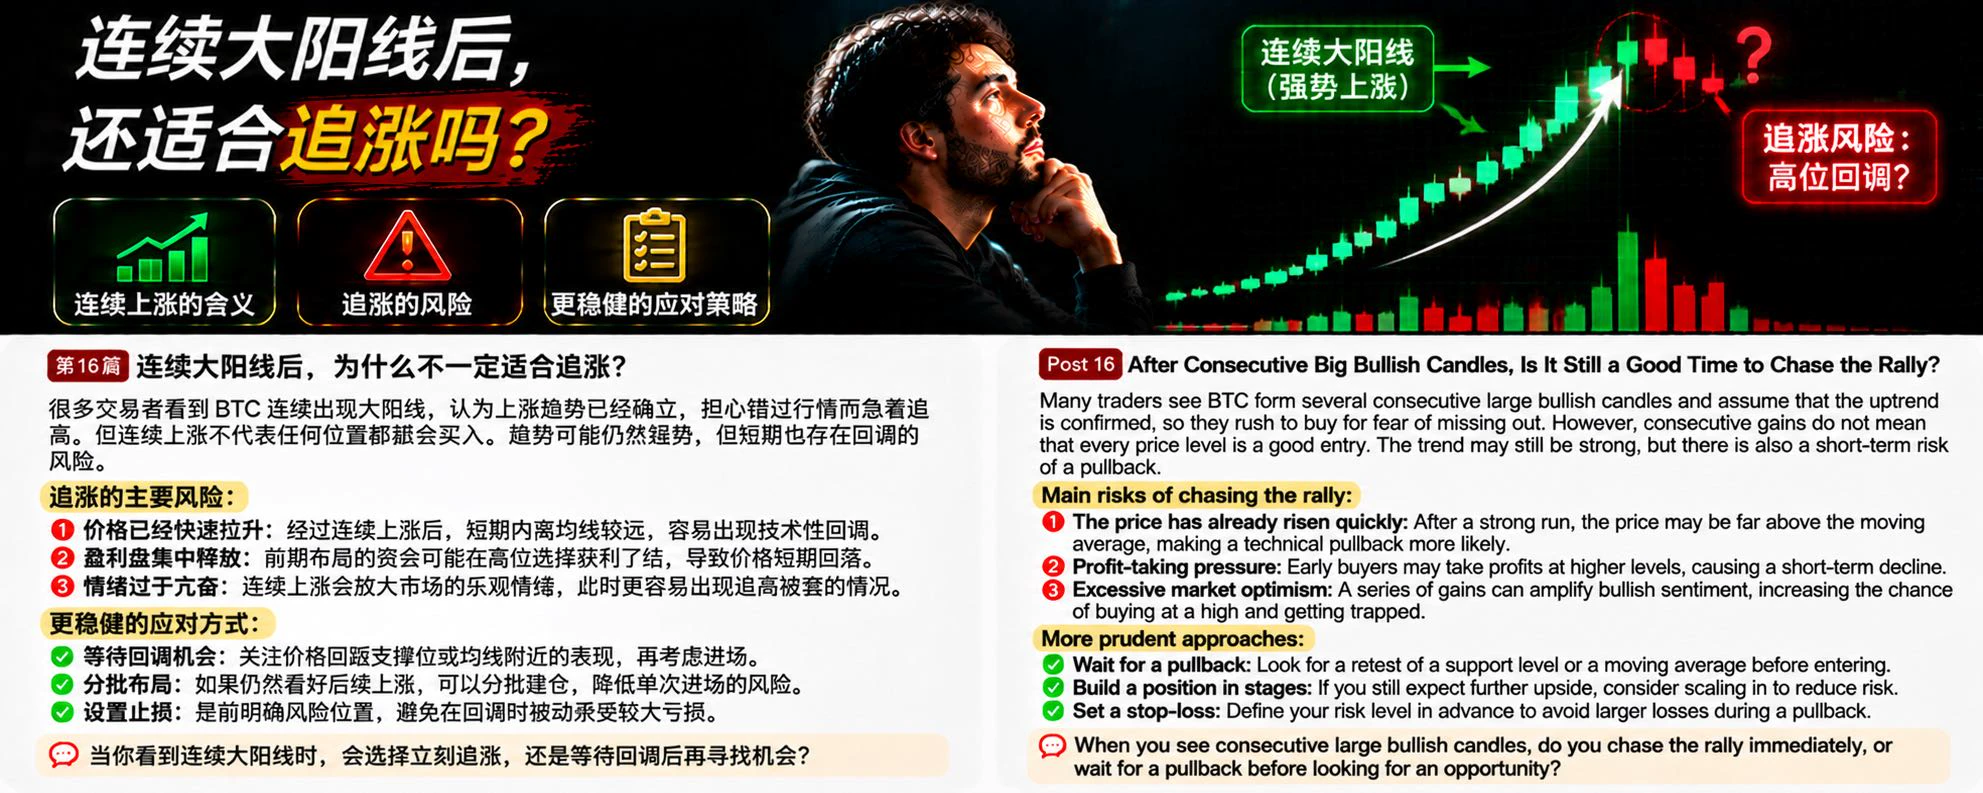
In BTC trading, many people see several large bullish candlesticks in a row and assume the uptrend is fully established. Worried about missing out, they rush to chase the price. But consecutive gains don’t mean every price level is suitable for buying. Sometimes, the faster the rally, the more alert you need to be to the risk of a short-term pullback.
Why isn’t it always a good idea to chase a rally after several large bullish candlesticks in a row?
First, the price may have moved too far from a reasonable level. After a series of gains, the short-term price may be far from the moving averages
post-image
BTC-0.67%
Are you busy?
No worries, you get back to work. I’ll have some fun on your behalf! 🏰😌
Team-building at Hong Kong Disneyland—who else loves how easy it is to get great shots?
Today, we’re not coworkers with our teammates. Today, we’re all princesses! 👸
#Disneyland #HongKong
Can we buy SOXL now?
SOXL-9.41%
#BTCBackAbove80K
🌈 Gate Live Streaming Inspiration - Nov.5
Today's Topic Recommendations:
🔹Democrats Sweep Both Chambers of Congress as the Dow Surges Over 3%! But AI Stocks Fall Across the Board. Is a Major Sector Rotation Underway in U.S. Stocks?
🔹KOL View: Tom Lee Remains Bullish on the AI Trade! With Tech Stocks Facing Repeated Sell-Offs, Is This a Crisis or a Buying Opportunity?
🔹Chip Stocks Are Falling, but Demand Hasn't Weakened? With Democratic Regulatory Expectations Shaking Markets, Are Semiconductor Stocks Being Unfairly Punished?
🔹OpenAI Uncovers 948 Linux Vulnerabilities in
BTC-0.67%
GT-2.41%
ETH-1.26%
  • 4
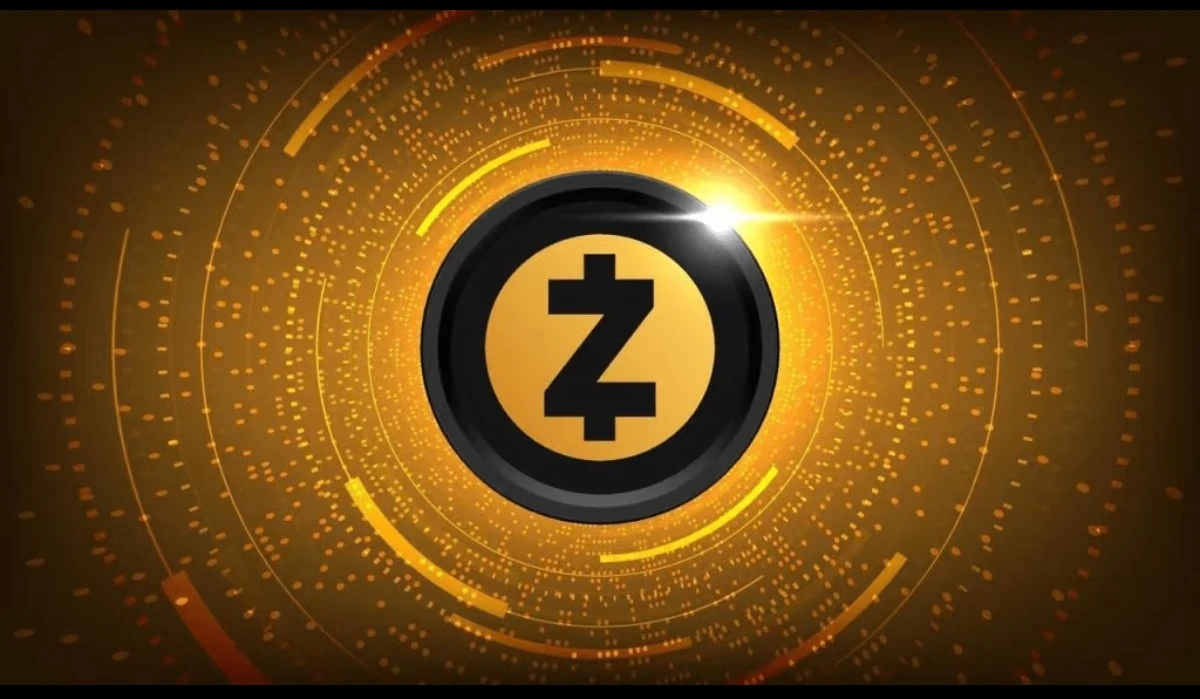
ZEC 1-hour timeframe: After rising along the upper Bollinger Band, the price pulled back slightly and is now holding above the middle band. The Bollinger Bands are gradually narrowing, signaling a short-term consolidation structure. The TTMU long/short indicator favors bulls, and net capital inflows continue, keeping bullish momentum intact. The previous rally tested the area around 1352 and met resistance, making this a key short-term barrier. The middle Bollinger Band below provides strong support; holding above it on a pullback would keep the bullish structure intact. A high-volume break ab
post-image
BTC-0.67%
Why do so many traders keep making the same mistakes?
It’s not that everyone lacks trading knowledge. Often, what’s really missing is effective review.
🔹 They record only profits and losses, not their reasons for entering;
🔹 They analyze only winning trades and are unwilling to study losses;
🔹 After a loss, they rush to make it back, taking on increasingly larger positions;
🔹 They spot the problem but don’t set a rule they can follow next time.
A practical review system should track trading plans, actual execution, trading costs, and improvement measures.
Don’t just ask whether a trade mad
post-image
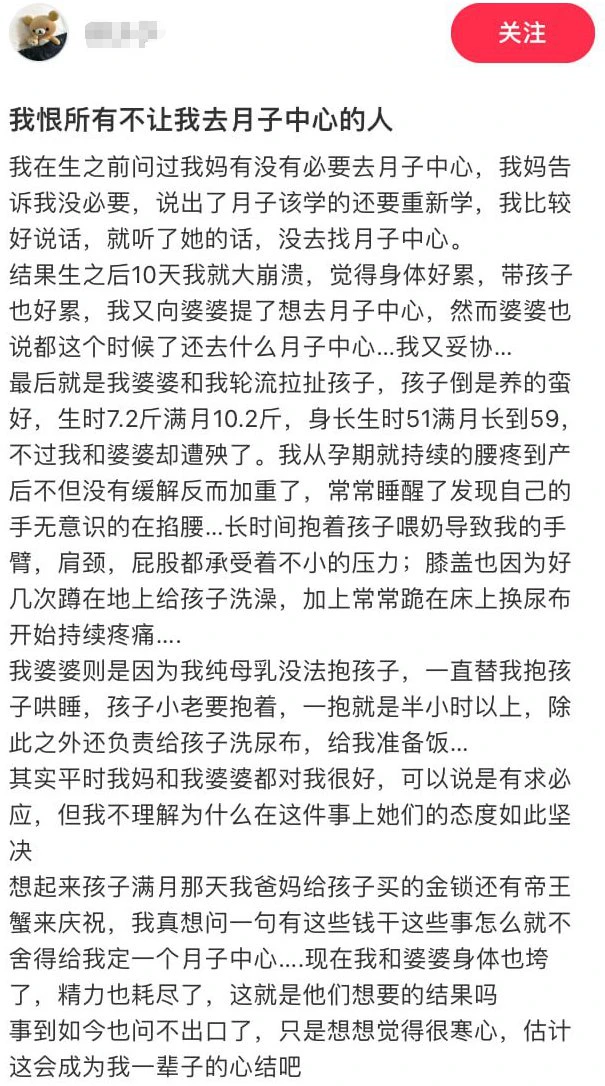
When postpartum care centers first emerged,
a few friends made a fortune.
Starting with tens of thousands.
post-image
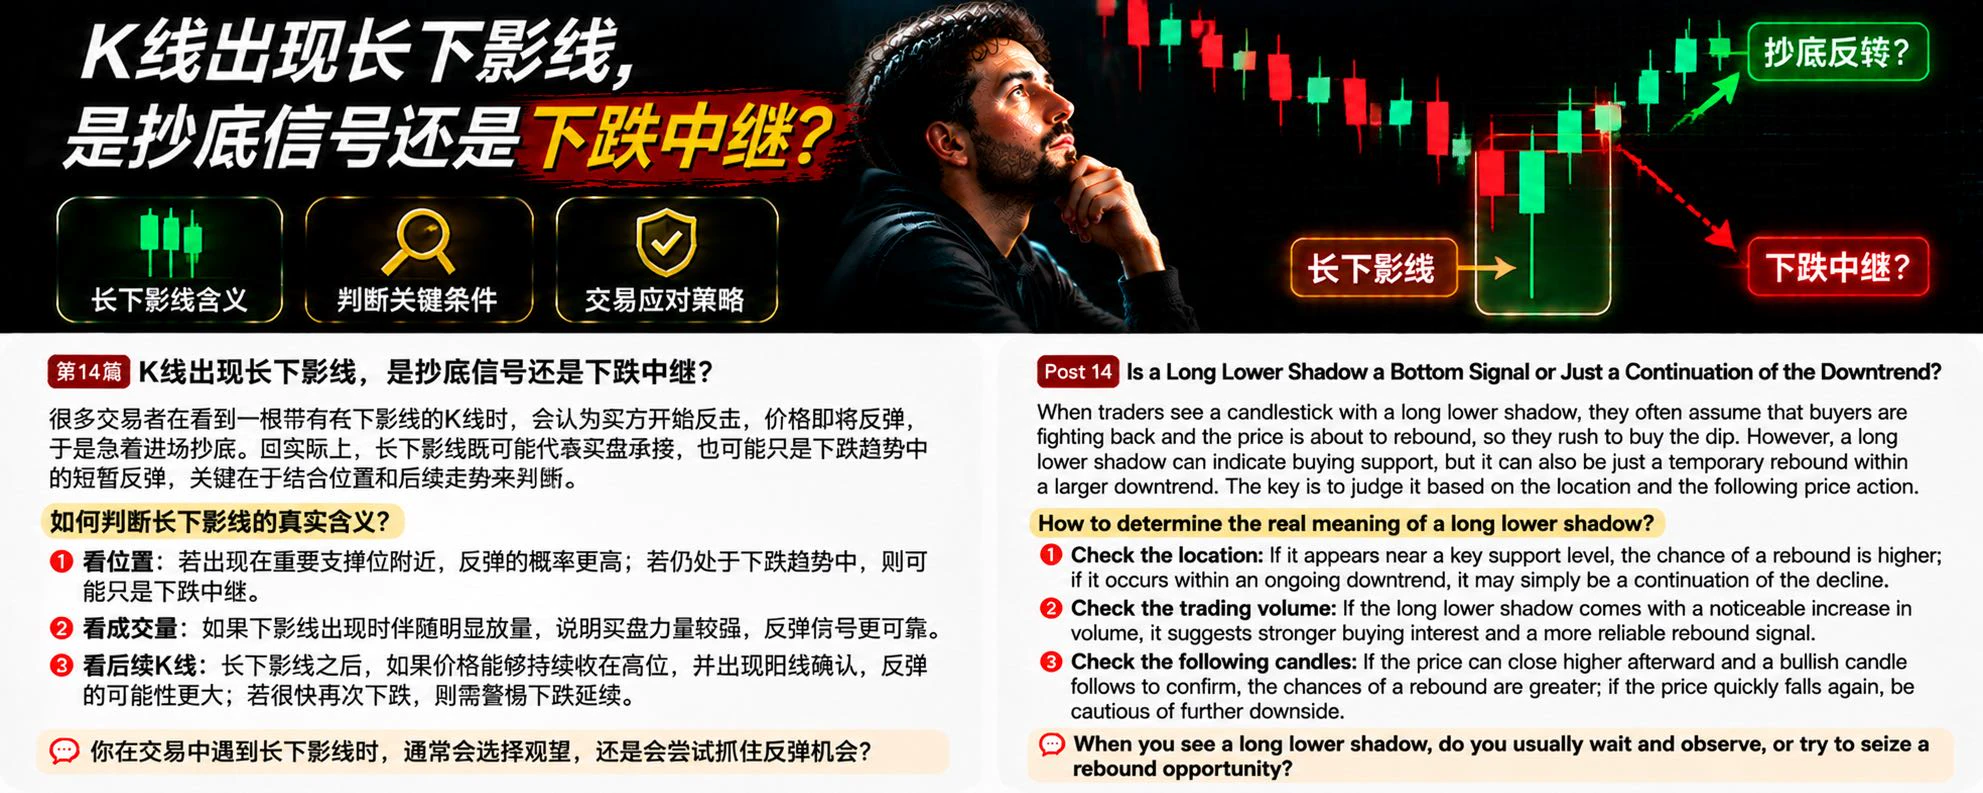
In BTC trading, many people see a candlestick with a long lower shadow and assume buyers are starting to fight back and the price is about to rebound, so they rush in to buy the dip. But in reality, a long lower shadow does not necessarily mean a trend reversal; it may simply be a brief rebound during a decline.
So how should you judge?
First, look at where it appears. If a long lower shadow appears near an important support level from earlier, it suggests that strong buying may have absorbed selling after the price fell into this area, making the rebound signal relatively more significant. Bu
post-image
BTC-0.67%
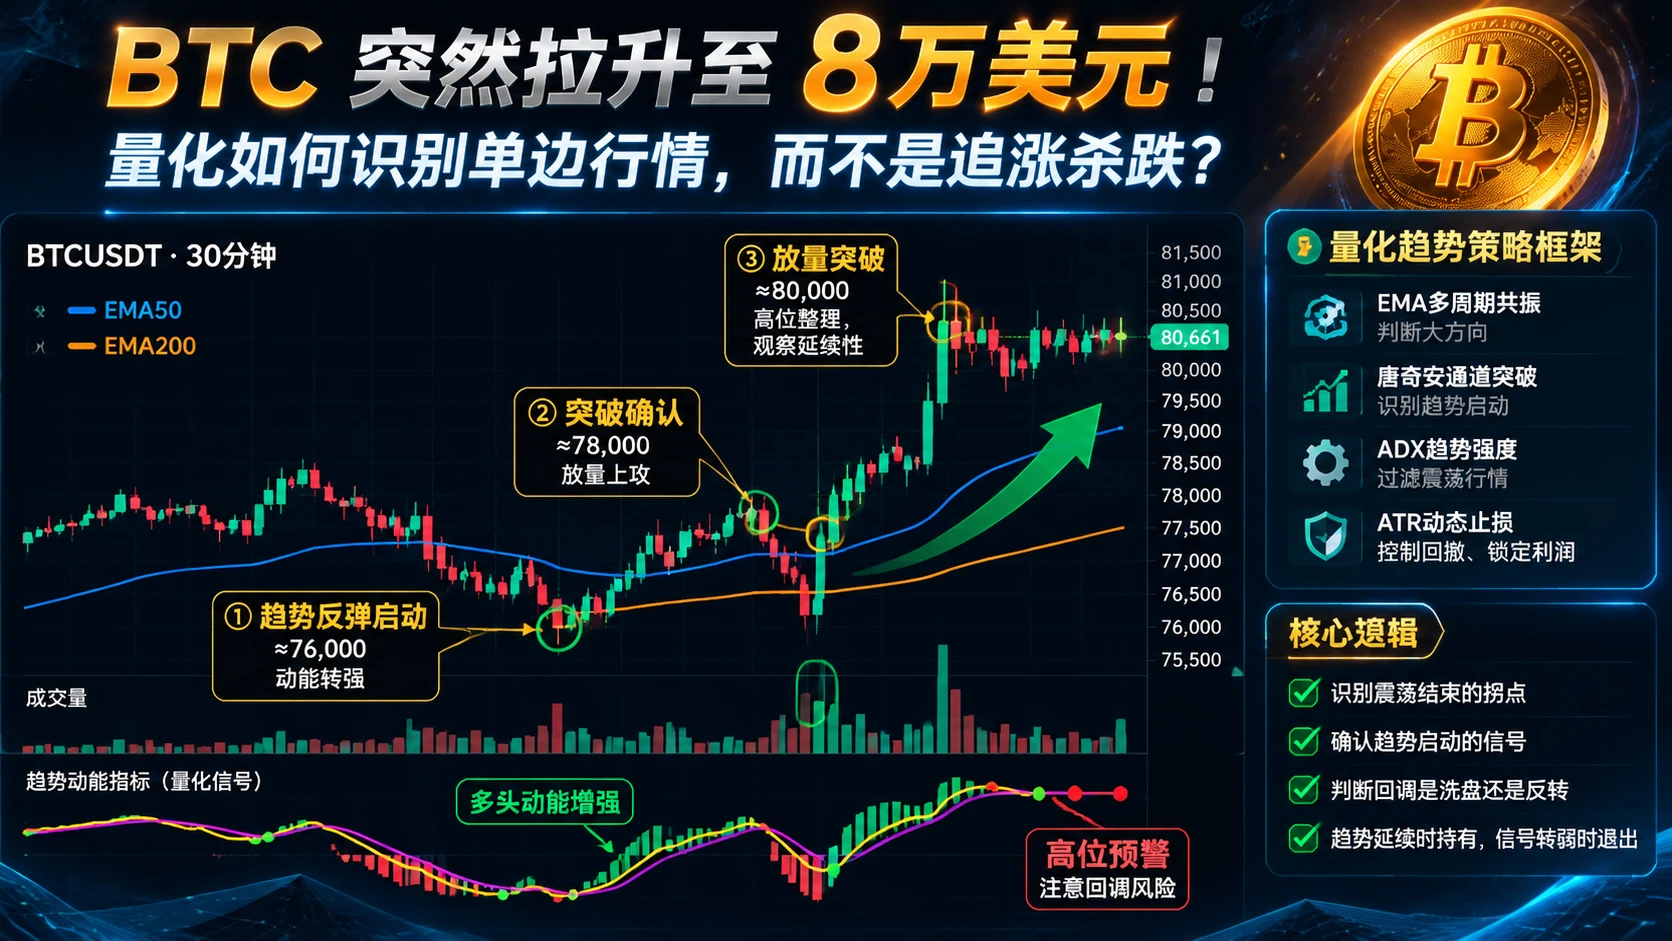
BTC surges to $80,000! How can quantitative strategies identify a one-way trend instead of chasing pumps and dumps?
When many people see BTC suddenly surge, their first instinct is to go long. But what’s really worth examining is: when does this move start to offer value for trend trading?
BTC rebounded rapidly from around $76,000, broke through $78,000, and then surged past $80,000 on rising volume.
Here are three signals worth watching:
① A sudden increase in volume: Volume clearly rose during the breakout, indicating greater market participation, but we still need to see whether volume can
post-image
BTC-0.67%
ETH-1.23%
Gold trading session: The market moved too much from yesterday to today. Those damn market makers taught me a lesson and liquidated me. I admit defeat.
PAXG+0.33%
XAU+0.38%
  • 2
🔍 How can you determine the actual impact of on-chain restrictions on users?
Don’t just check whether a contract has a certain feature. Also verify:
1. Whether the pause function actually works;
2. Whether address restrictions apply to the target address;
3. Which specific operations the whitelist allows;
4. Whether a failed transaction was caused by a limit;
5. Who controls upgrade permissions and whether the rules have changed.
The same technical mechanism can have completely different effects in different contracts.
Next: After understanding the risks, how should ordinary users protect the
post-image
Bitcoin Market and overview
live-cover
LIVE1,009
Very strong😷😷😷$BTC ‌$GT ‌$ETH ‌#BTC重返8万
post-image
BTC-0.65%
GT-2.24%
ETH-1.23%
It really is true😅
Huawei is still far ahead
post-image
Huazi just keeps being bullish, a loyal bull!
Hope Huazi is right this time and can give it a solid boost.
post-image
BLSH+0.60%
  • 1
Guys, the 3-minute alert showed [unclear] at 4137—get in, set a stop-loss at 4150 and go for it, foolproof mode
post-image
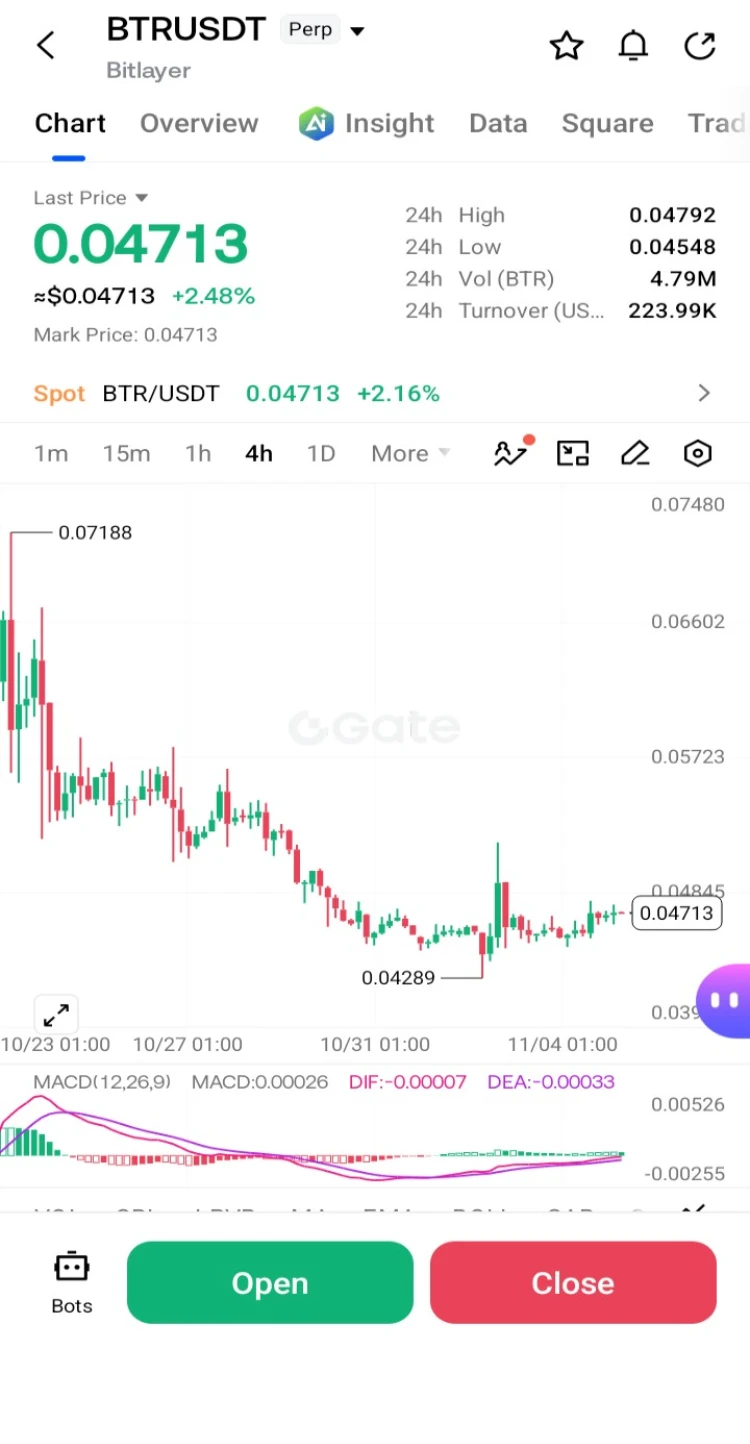
$BTR /USDT | Sellers Still Have the Upper Hand?
BTR is showing signs of weakness, with both daily and 4H market structures leaning bearish. I'm watching for another move lower, but I don't want to ignore the short-term buying pressure.
Potential Short Zone: 0.0473788 – 0.0475212
Profit Levels:
- TP1: 0.0463904
- TP2: 0.0456840
- TP3: 0.0446244
Invalidation: 0.0488628
The price remains under the EMA50 and EMA200, which keeps the broader outlook under pressure. However, the 1H RSI near 59.5 suggests buyers haven't completely stepped aside.
I'd rather wait for sellers to show some strength before
post-image
BTR+1.43%
  • 3
  • 1
Load More

Join 40 M users in our growing community

⚡️ Join 40 M users in the crypto craze discussion

💬 Engage with your favorite top creators

👍 See what interests you

Trending Topics

BTCBackAbove80K

28.32k Views41.16k Discussing

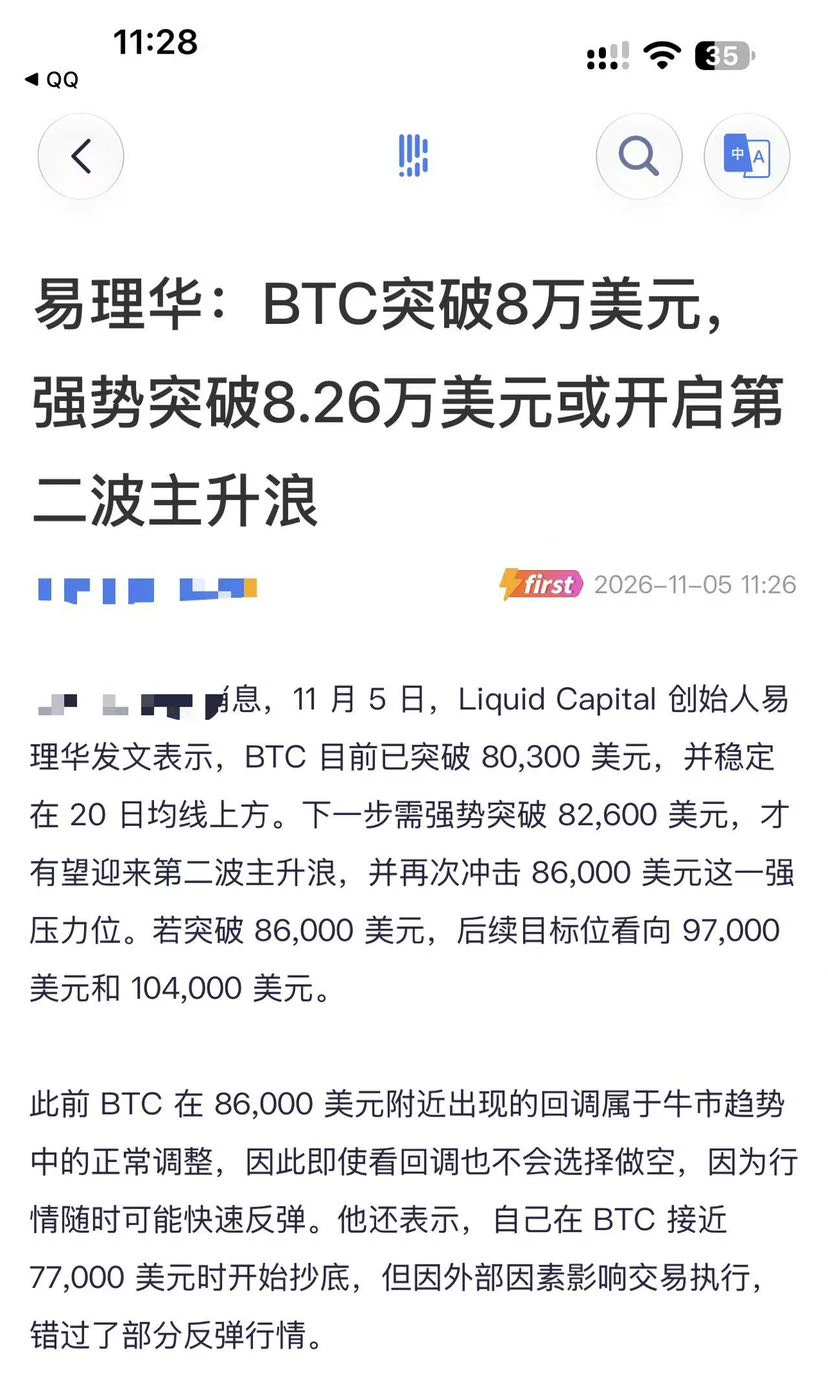
After a sharp dip, Bitcoin climbed back above $80,000 on May 9 and is currently trading around $80,200. Over 50,000 traders were liquidated in the past 24 hours amid fierce long-short battles. The recurring Iran-U.S. tensions remain the primary short-term variable. Following U.S. airstrikes, Iran\'s Revolutionary Guard claimed to have breached the Strait of Hormuz defense line, leaving the ceasefire outlook uncertain. On the technical side, the daily SMA20 ,$77,970 serves as key support, with the RSI recovering from oversold levels to 43. The $80,000 level is both a psychological barrier and a bull-bear dividing line.Holding above it could lead to a challenge at $85,000, while a break may trigger a retest of the $77,000 area.

DemocratsWinBothChambers

17.63k Views436 Discussing

GateLaunchesTaiwanStockTrading

14.77k Views298 Discussing

View More