










First, the conclusion: Don’t trade the bounce. Just wait for a move up to short.
Objective market structure
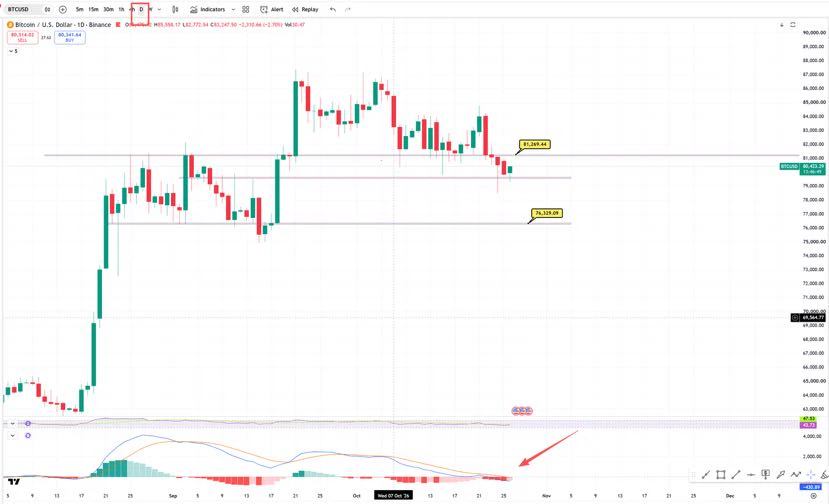
Chart 1. The daily chart has confirmed the breakdown. It’s the 812 zone, not an exact price! See the chart for details!! The turning point where the bearish structure ends is around 8.4.
Chart 2. 4-hour timeframe. There was a bounce around 7.9. Resistance above is at 8.1/8.21. A break below around 792 would still leave a vacuum zone.
Subjective view:
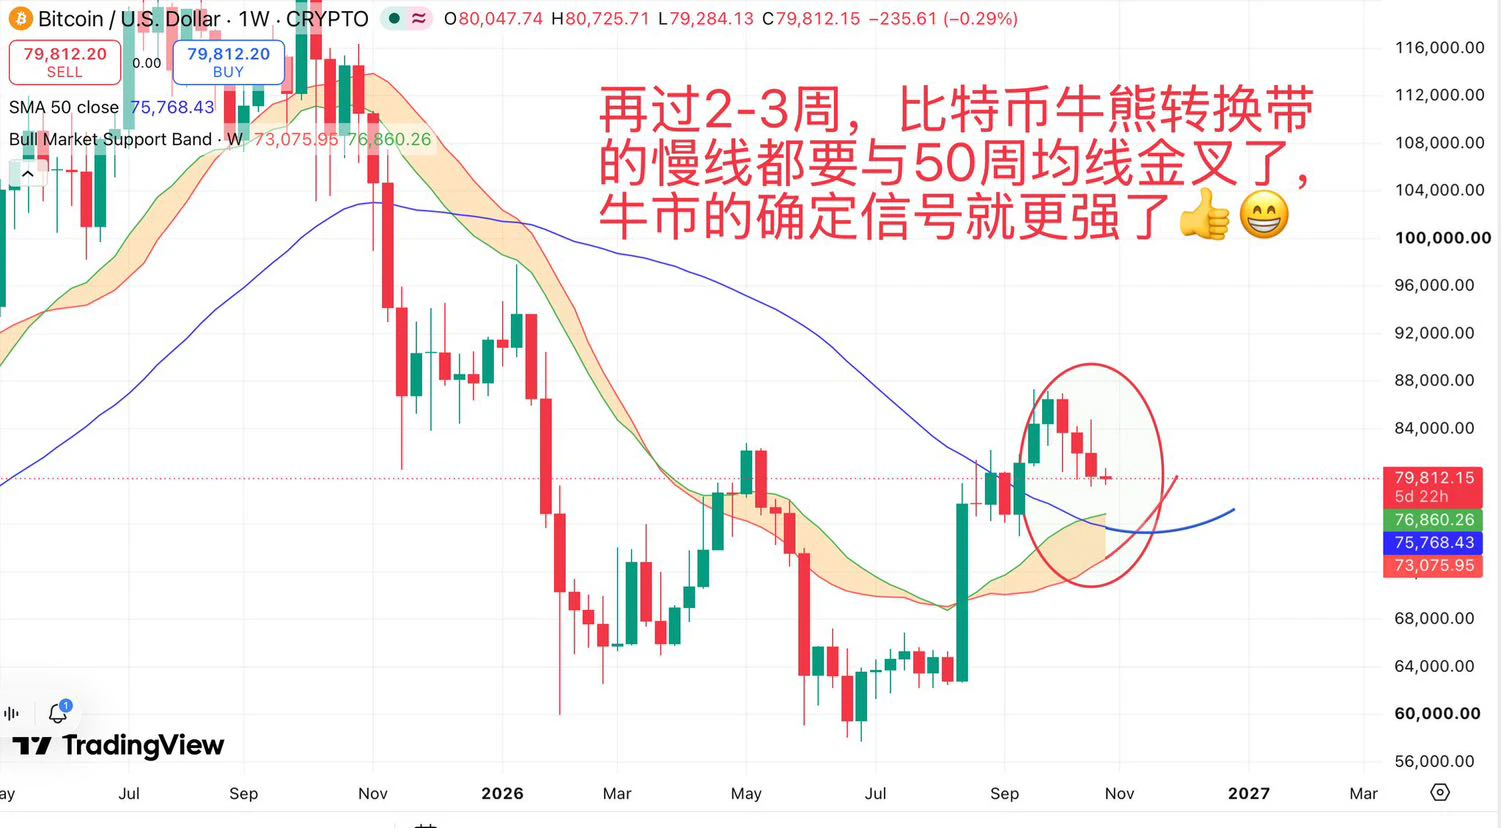
With a daily breakdown like this, unless a huge-volume candle reclaims the level, the view that this is not a bull-market reversal—which I’ve held for over a month—continues to apply. Price could head lower to 7.6 to retest support. The daily MACD is also now below the zero line, so continuing to short the bounce makes sense.
4-hour timeframe. The short-entry levels 1/2/3 shared over the past two weeks kicked off this decline after the sweep at 2. Last Friday’s break below 8.15 ended the 1-hour bullish structure and extended the 4-hour bearish structure. Although there was a bounce around 7.9, futures data suggest it was more likely shorts reducing positions than longs entering. Also, during the rebound from the decline that started at 8.7, the Fibonacci 0.618 level worked multiple times. The current 0.618 level is around 83.
Trading recommendations:
Considering the different timeframes above, go with the trend. I don’t recommend trading any bounce.
Short at 827-83; this is the optimal entry zone. Stop-loss at 8.4.
If the market continues to bounce on low volume today or tomorrow, you can also short near 815. That’s just around 8.3.
Of course, you can scale in at 815 and 83, with a stop-loss at 84. Just trade according to your own timeframe. Always use a stop-loss.
Streaming tonight~ Though I probably won’t get home until after 10. Come chat about the market then!~
$BTC #BTC争夺8万美元关口