Square
Following
Hot
News
Notifications
Profile
Share your thoughts
placeholder
Article
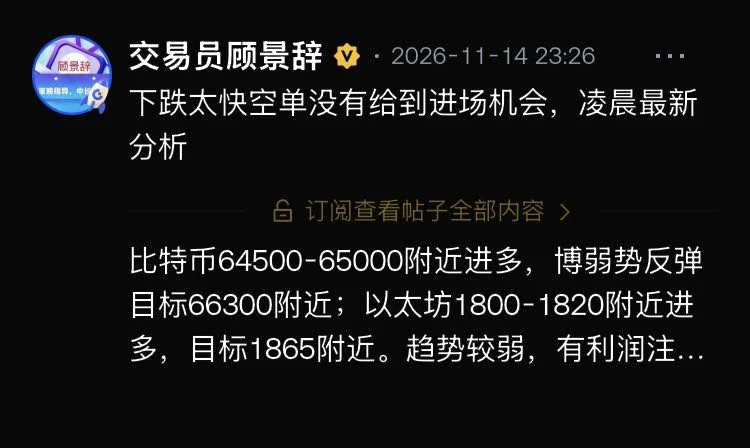
Long positions have surged by 1,200 points and 40 points. Be sure to manage the range appropriately, and trade according to the strategy mentioned earlier in the early hours of the morning#Gate直通IPO第三期Anthropic
post-image
ANTHROPIC+0.63%
  • 1
Can we stop now?
post-image
Trenches
mihao
m
bade
b
mihao
4Cxj...pump
Market Cap
$.
Change
.
24h Vol
$.
Holders
.
Snoopy
S
bade
b
Snoopy
7mEh...47Cn
Market Cap
$.
Change
.
24h Vol
$.
Holders
.
IDOL
I
bade
b
IDOL
0x3b...ab07
Market Cap
$.
Change
.
24h Vol
$.
Holders
.
NIO
N
bade
b
NIO
7SL2...pump
Market Cap
$.
Change
.
24h Vol
$.
Holders
.
AGT
A
bade
b
AGT
0x5d...e274
Market Cap
$.
Change
.
24h Vol
$.
Holders
.
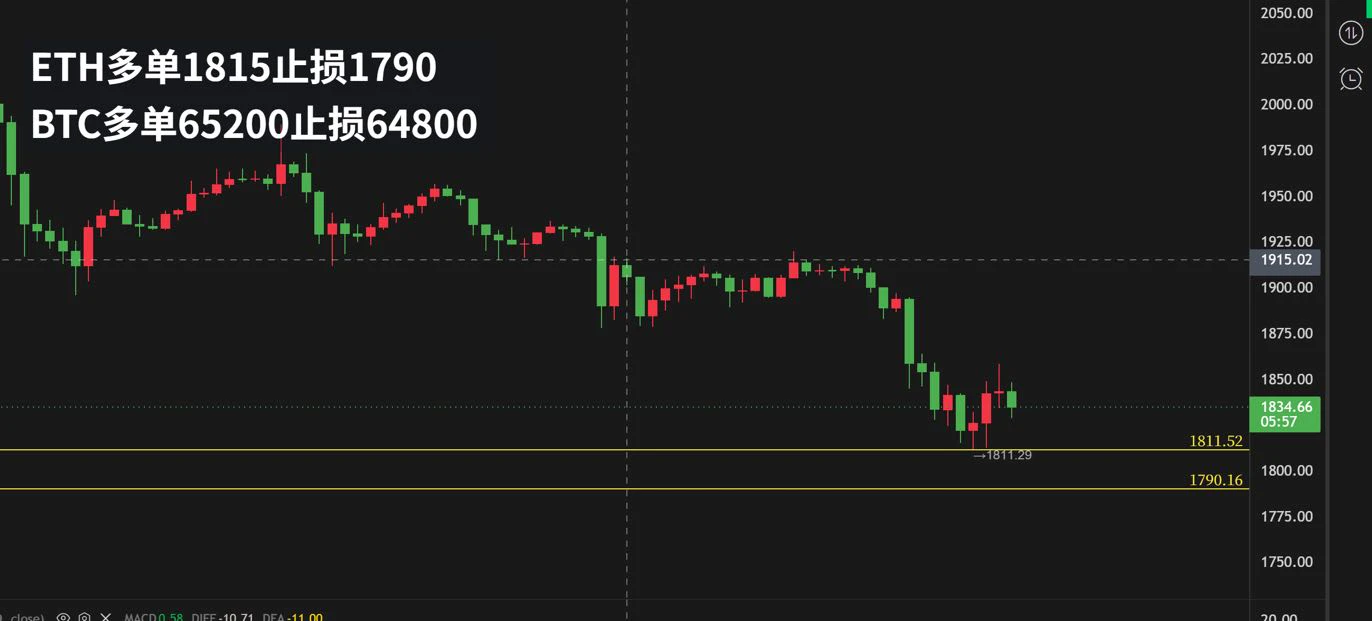
ETH Wealth Code
11/15
Long Position Setup
post-image
ETH-1.26%
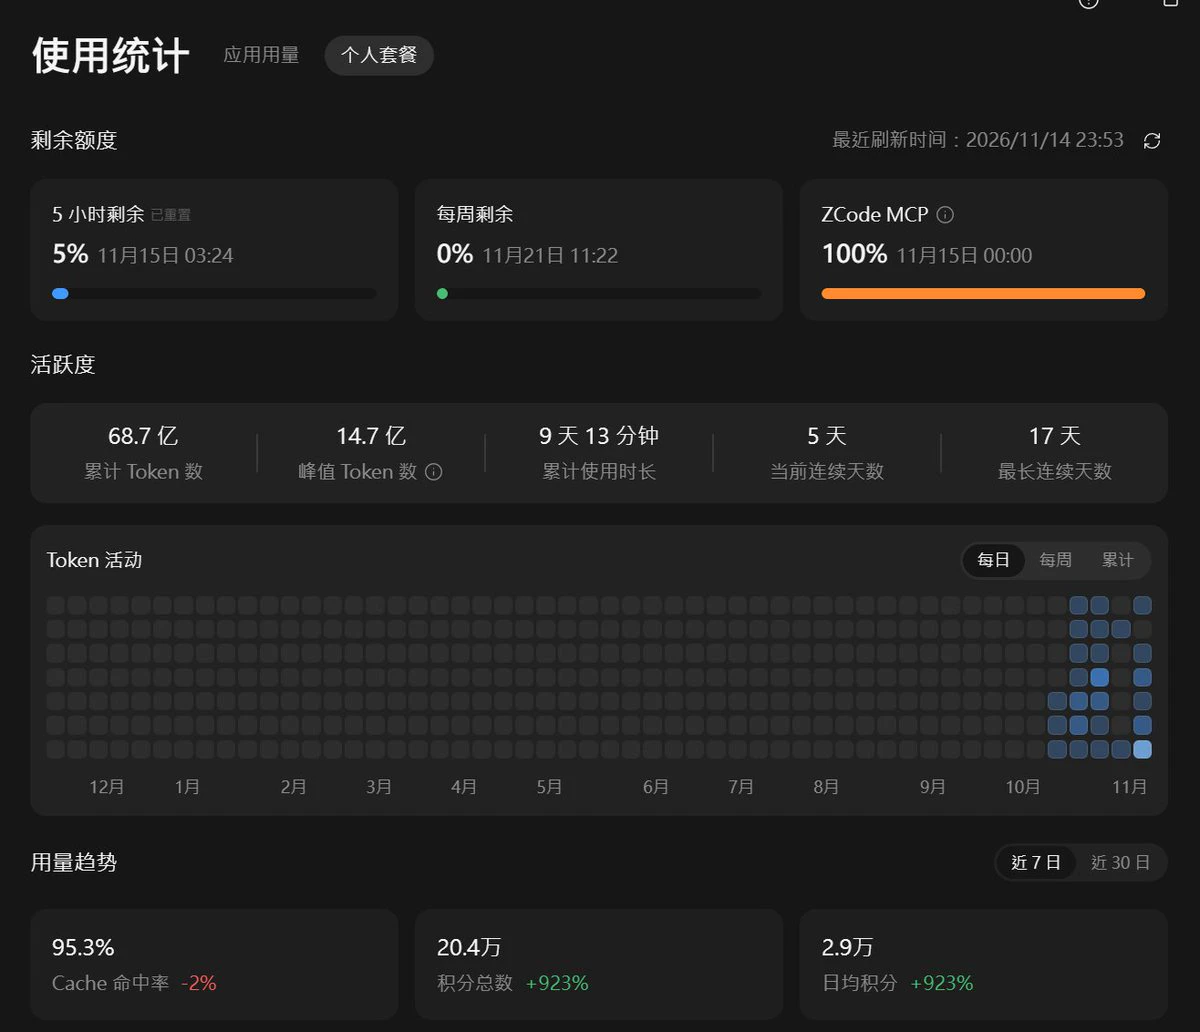
I used up the quota just before my monthly plan ended
Domestic models are indeed quite generous with usage; GLM basically resets during off-peak hours
The quota in the subscription can also be connected to an API
For 500 RMB, including API usage, you can get nearly 10 billion tokens out of it
At official API prices, these tokens are worth 5,000–25,000 RMB
post-image
GLM+0.99%
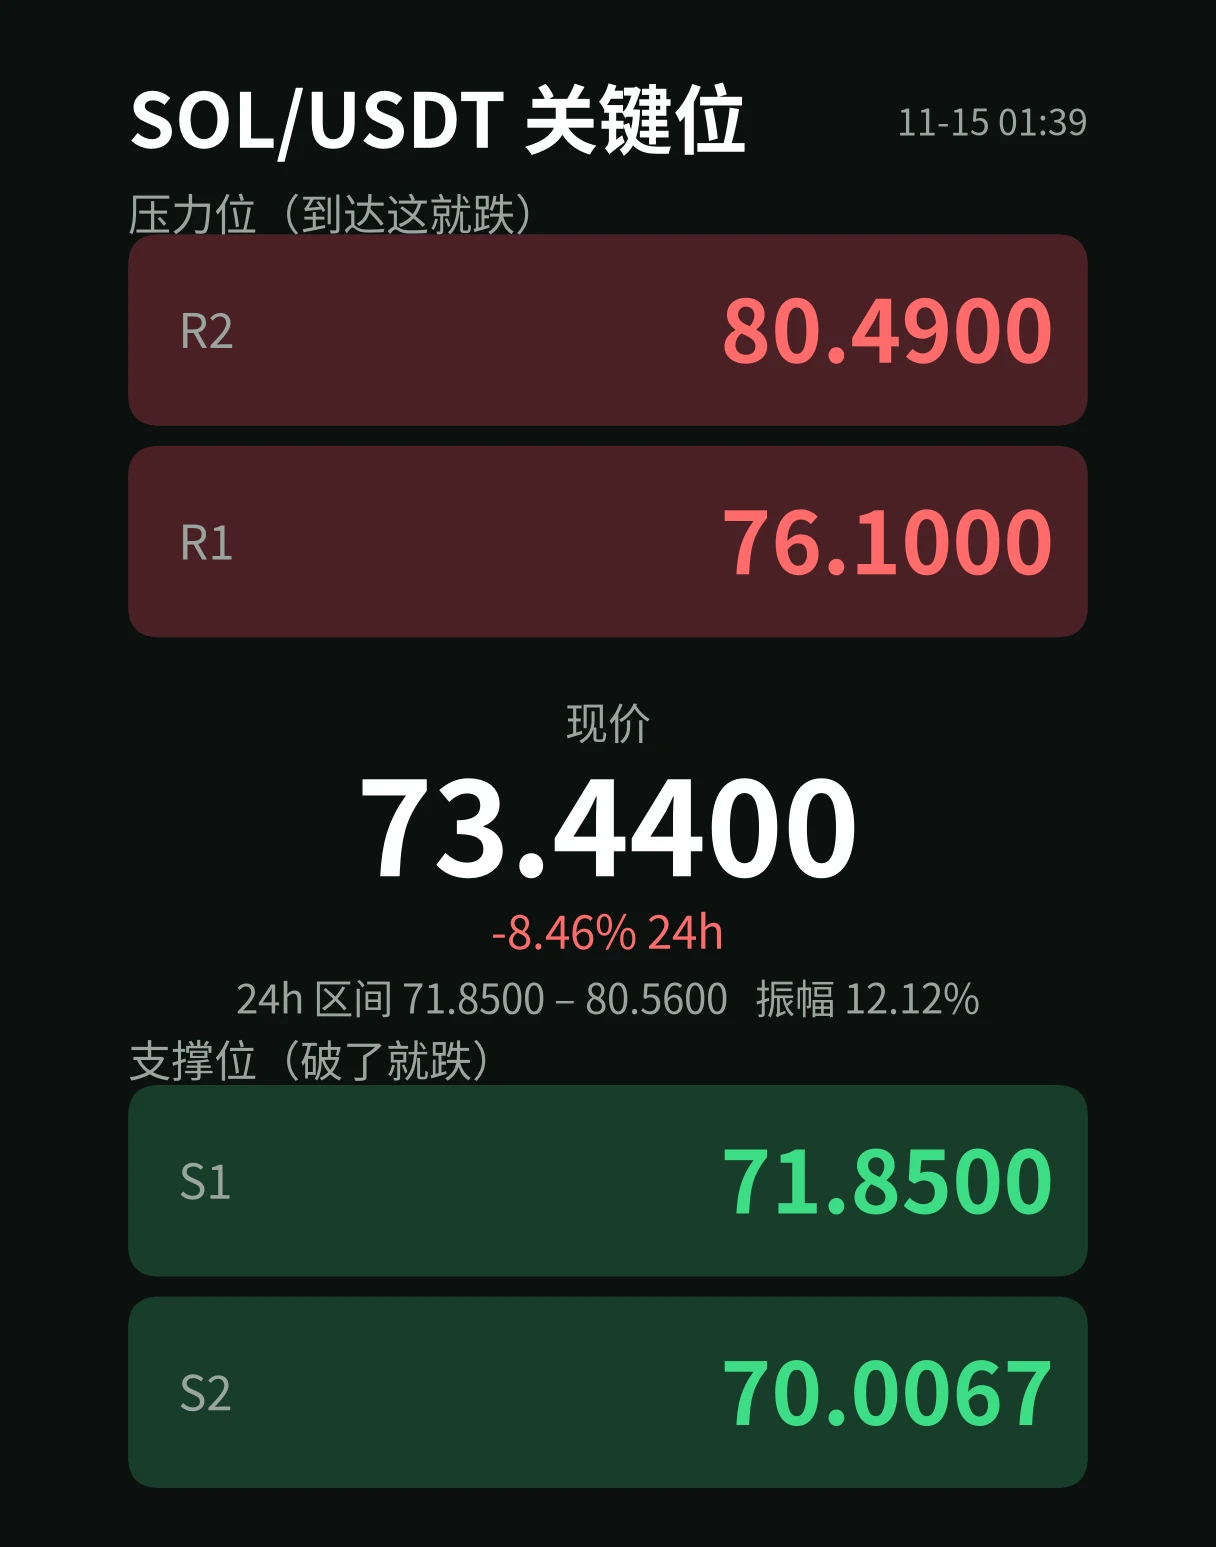
$SOL Market Analysis: Bears Are Testing Lower Support
Solana is showing continued bearishpressure as sellers attempt to push the price below its recent support structure. With SOL trading around $72.96, the market remains vulnerable to further downside if buyers fail to defend the current region.

Key figures

$76.50 — Upper resistance area

$73.50 — Important short-term price zone

$72.96 — Current reference price

$71.80 — First downside support

$70.00 — Psychological support level

$68.50 — Next potential support

$66.00 — Deeper downside area

Bearish Scenario

If SOL fails to reclaim th
post-image
SOL-0.77%
  • 2
  • 1
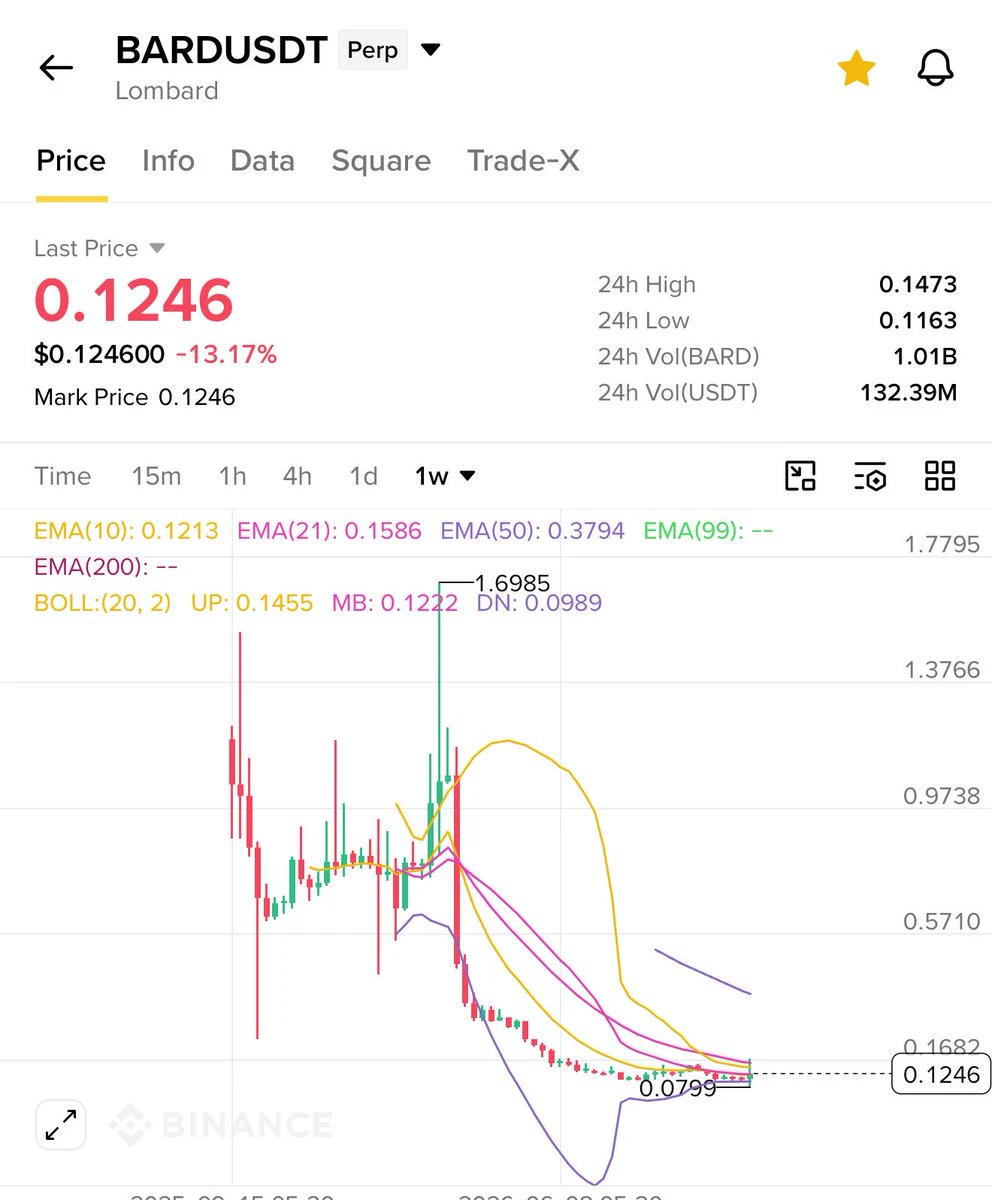
Eyes on $BARD ✅
Very likely to start a next leg up now, insane volume over the past 2 days 🤝
post-image
BARD-1.24%
Crypto Security Companies Develop New Protection Against Phishing And Wallet Scams
live-cover
LIVE393
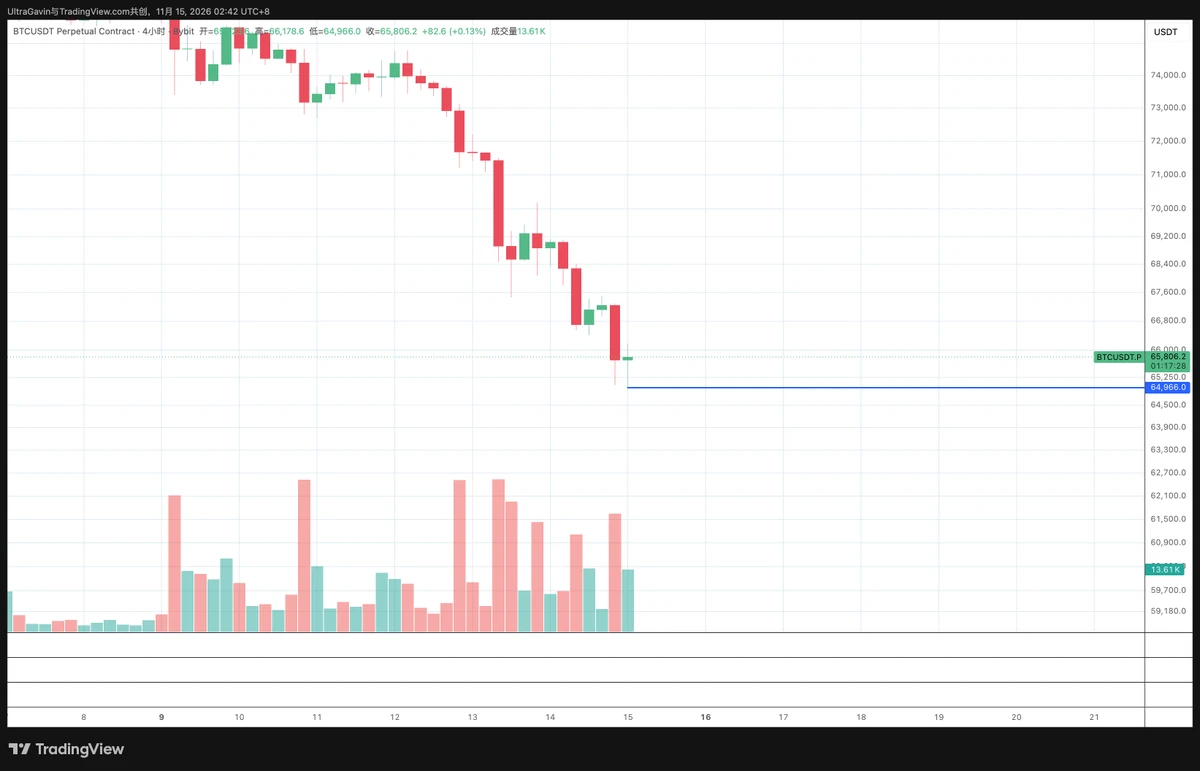
I might be the only one on the entire internet watching the market and believing Bitcoin has already bottomed, 64966.
Bitcoin, a brand-new beginning. See you tomorrow.
post-image
BTC-0.67%
Oil Markets Monitor Shipping Routes And Changes In Production Levels
live-cover
LIVE351
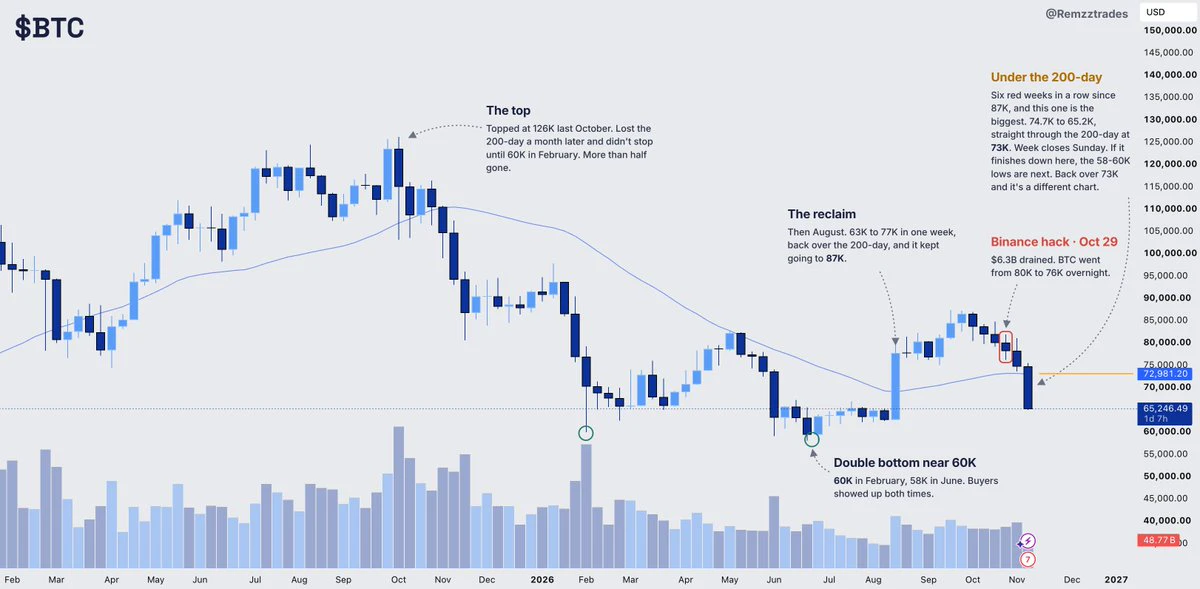
Weekend thoughts: Are markets preparing for a bigger selloff?
$BTC
Could Bitcoin be signaling something bigger for the broader markets?
I've used Bitcoin as a way to gauge overall market sentiment time and time again, and this time may be no different.
I'm by no means a crypto expert, but when a major risk-on asset is selling off this aggressively, I think it's something worth paying attention to.
Then again, it's entirely possible the stock market has decoupled from crypto and this ends up being a complete nothing burger.
Either way, I wouldn't ignore what Bitcoin is telling us right now, esp
post-image
BTC-0.67%
Fear and Greed at 13, the coldest in the market; I'm bullish on $PUMP with a volume ratio of 0.618
$PUMP is at 0.002993, down 13.572% over 24h. The Fear and Greed Index is 13, sentiment across the market is frozen—I'm bullish at this level.

First, volume—24h trading volume is 10535571 USDT, just 0.618 of the 30-day average. The price is drifting down on shrinking volume, and panic sellers haven't driven up volume.

Second, open interest—OI is 16,079,875,254.00, up just 0.33% from the 2026-11-13 snapshot. Shorts haven't dared to add to their positions.

Third, positioning—the long/short accou
PUMP-1.06%
The take-profit level of 74.62 from the noon post was breached by 10 p.m.—SOL fell 8.8% in a day. $SOL The futures outlook remains bearish, and those who followed made a nice profit on this move. It’s now moving sideways around $73, with a fresh low of 71.85 just set. The rebound only reached 74.47, failing to reclaim 74.62. My view is clear: as long as 74.62 holds as resistance, I’m looking lower, with a take-profit at 71.73. If it moves above 74.62, I’ll admit I’m wrong and exit, with a stop-loss at 74.62. Next, watch whether 71.85 breaks. If it does, that’s the next leg down; if not, it’ll
post-image
SOL-0.74%
#JensenHuangResigns

When a face who shaped a firm for 33 years walks away in one day, the market does not read it as a routine leadership change, and this exit turns into a fresh test of trust in one of the strongest stories of the artificial intelligence era.

By the notice on 12 November, Jensen Huang left his role of 33 years with immediate effect, he also left his board seat, and finance chief Colette Kress was named to the interim role, because the firm said the search for a lasting chief goes on.

As the cause of the exit, talks that gathered around personal links and the claim that a
NVDA-1.92%
AMD-8.76%
MU-2.56%
SKHYV-0.98%
AAPL+0.41%
  • 11
  • 2
#ShareWeekly #AKE #WCTCS9

The cryptocurrency market can change direction within seconds, and AKE's latest price movement is a clear reminder of how quickly short-term volatility can affect digital assets. AKE has recorded a sharp decline of 10.04% in just 15 minutes, bringing its price down to 0.012256 USDT. Such a sudden move deserves attention because a double-digit percentage decline within such a short period can indicate aggressive selling activity, reduced liquidity, or a rapid shift in market sentiment.

However, the important question is not simply why AKE is falling. Investors also
post-image
AKE+6.07%
Crypto Circle Academician: After Ethereum (ETH) bullish structure was broken on 11.15, what conditions must be met for a daily-chart bottom to form?
With the market looking this awful, why are so many beginners still entering crypto? If you’ve just started looking at charts, first match the price levels in this article with their corresponding timeframes, and understand what resistance, support, and stop-losses mean before considering practice with a small position. The market changes every day, and levels written today may no longer apply tomorrow. Learn to adjust with the structure instead o
ETH-1.23%
$HOME This trade went from “free money” to “cutting losses” in just three days.
The day before yesterday, I watched it fall from 0.0052 to 0.0046. I thought it had dropped nearly 10%, so it had to bounce, and I entered with a 30% position at 0.0046. But after I bought, it just went sideways like a dead fish. Yesterday afternoon, a single bearish candle sent it straight down to 0.0043. I watched the order book, hoping for a rebound before exiting, but it never came. 24-hour trading volume was 5.7M, and volume kept shrinking, leaving fewer and fewer buyers.
The lesson is simple: in a downtrend,
HOME-0.31%
  • 2
  • 1
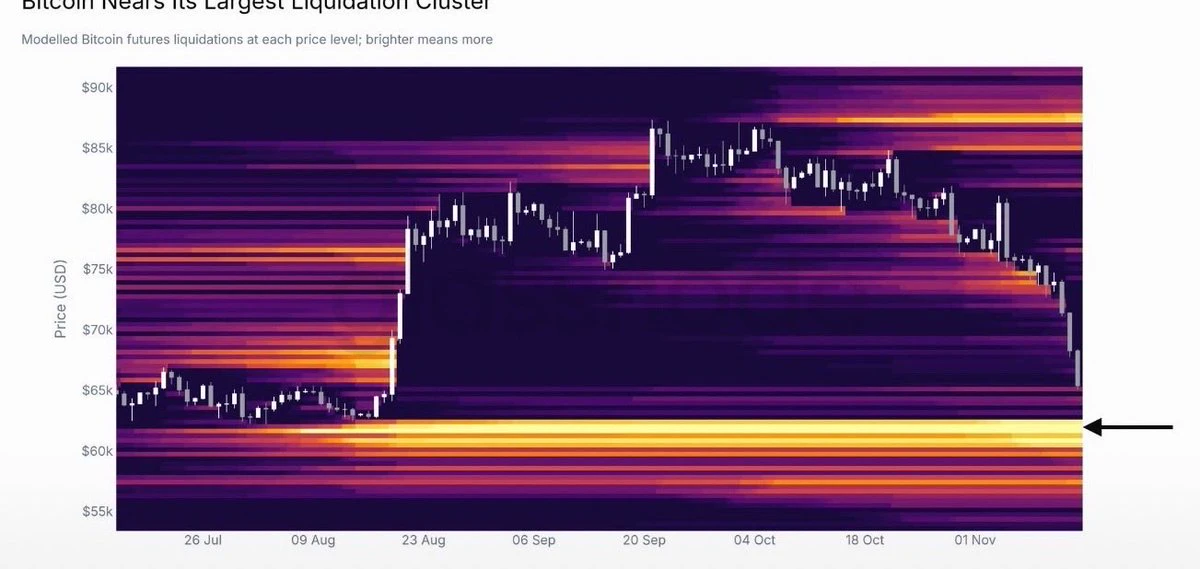
$btc Looks like it’s heading for 60,000 to trigger liquidations.
post-image
BTC-0.65%
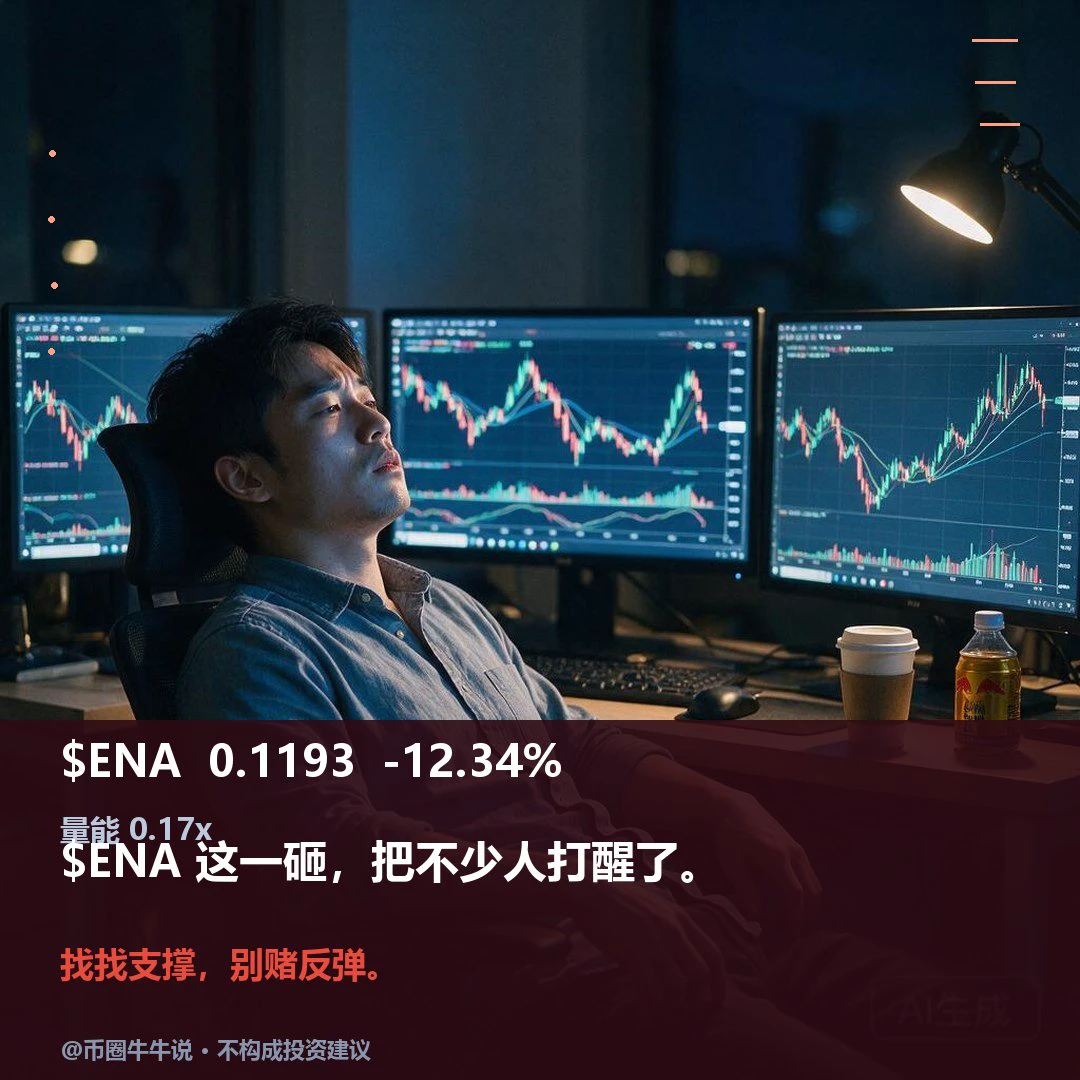
$ENA is currently at 0.1193, down 12.34% over 24H. The 1H trend is weak, with EMA20 at 0.1266 and RSI at 20.5; resistance is at 0.1377 and support at 0.1181. The 4H trend is weak, with EMA20 at 0.1355 and RSI at 13.9; resistance is at 0.157 and support at 0.1181. If it holds above the 0.1377 resistance, watch for a rebound; a break below the 0.1181 support would mean continued weakness. Review whether it can hold above 0.1377 and recover after losing 0.1181. Volume is only 0.17x the average, so confirmation from trading volume is needed. The market is volatile; for observation only.
post-image
ENA+8.04%
Ahead of the CPI release, the S&P rallied from 7,376 to 7,549 in two days, up 2.35%—about 173 points, or more than 1% per day. Risk appetite has rebounded faster than many expected. Before the market opened on Monday, I said clearly that if Friday’s closing price held, this rally would last until the CPI data came out. I’ll post my trades after the close to show how they played out. I call the trade first and post the receipts afterward—that’s how I keep score. No Monday-morning quarterbacking.

Looking at the market, this rally wasn’t a one-off spike. It was the result of sentiment, positioni
post-image
SPX+0.33%
BTC-0.67%
  • 3
  • 1
Load More

Join 40 M users in our growing community

⚡️ Join 40 M users in the crypto craze discussion

💬 Engage with your favorite top creators

👍 See what interests you

Trending Topics

GateIPOAccessAnthropic

324.2K Views2.9K Discussing

Gate IPO Access Phase 3 features Anthropic (ANT), with USDT subscription interest starting from 100 USDT. Successful allocations will be delivered as real shares to Gate Stock Accounts. Indicative price: $70–$78/share Subscription: Nov 12–17 (UTC+8) Allocation is not guaranteed. Please manage risk accordingly.

Dr.HanOxfordUnionSpeech

148.7K Views651 Discussing

USOctoberPPIBelowExpectations

468.7K Views1.6K Discussing

View More