Share your thoughts
placeholder
Article
With this trend, I don’t even need to think—the account is dancing on its own.
While everyone else was still watching from the sidelines, I kept my eye on those few rebounds. The volume didn’t follow, and the price stayed under pressure—clearly, there was no one willing to take it higher. I quietly entered a short at 0.3043, and it felt great. At the time, I even wondered if I was acting too soon, but the market immediately proved me right.
Now the price has slid to 0.2368, with returns at +435.46%. That was a satisfying bite of profit. The timing was right, and the wait was worth it. I’ve tak
post-image
BNB-0.70%
SNDK+11.75%
$VELVET 24-hour dump of 19.53%, falling from 0.0957 to 0.0725. It is now at 0.0754, looking like a dead-cat bounce. The 25.3M trading volume shows the panic selling is far from over—this is not buying the dip, it is catching a falling knife.
Let me tell you a harsh truth: what you think is a “bounce after a crash” is most likely a “continuation of the downtrend” in crypto. It’s like the bubble tea shop downstairs offering 50% off the second cup—you think you’re getting a bargain, but you end up with explosive diarrhea—a cheap deal is rarely a good deal.
I’ve been watching VELVET for three days
VELVET-19.06%
BTC-1.86%
Institutional money is starting to pick a side. Bitcoin is getting the bid while major altcoins are seeing capital walk out.
US spot Bitcoin ETFs recorded $101.15 million in net inflows on September 3, reversing a sharp $236.5 million outflow just one day earlier. BlackRock’s IBIT led the recovery with $115.45 million in inflows, showing that institutional demand for BTC has not disappeared despite the recent market pullback.
The contrast with altcoins is harder to ignore.
Spot Ethereum ETFs lost about $48 million, ending a 12-day inflow streak that had brought in roughly $1.62 billion. $SOL E
BTC-1.86%
BLK-0.37%
ETH-1.93%
SOL-2.34%
XRP-4.11%
Steady lads, deploying fresh liquidity into ur mom.
post-image
Everyone’s long XRP, but the 4h chart just whispered a secret no one’s ready to hear.

$XRP /USDT - SHORT

Trade Plan:
Entry: 1.3947 – 1.4025
SL: 1.4360
TP1: 1.3705
TP2: 1.3518
TP3: 1.3238

Why this setup?
- **Why now?** RSI on the 15m is cooling at 44.45—momentum is fading, not flipping.
- **The trap line:** 1.4057 is the invalidation; we’re sitting at 1.3986 with a ceiling of 1.4025.
- **Range-bound 1D** means breakouts are fake until proven. Short targets are stacked: 1.3705 → 1.3518 → 1.3238.
- **Risk is tight** (SL 1.4360) vs. reward—this is a scalp, not a saga.

Debate:
If 1.40
XRP-4.11%
$MARSCOIN Signal】Longs consolidating on shrinking 1H volume, targeting an upside breakout
$MARSCOIN 1H MACD histogram at 0.0013, with bullish volume momentum contracting. RSI 1H at 68.6, close to overbought, while the price at 0.19358 is below the Bollinger Bands upper band at 0.2262. On the 4H chart, the price rose from the 0.10 range to 0.21 before entering a narrow consolidation. Order book depth imbalance at -14.33%, with sell-side orders heavier than buy-side orders; the funding rate is 0.053%, increasing long position costs, while OI remains stable with no signs of a cascade.
🎯Directio
post-image
MARSCOIN+74.58%
BTC-1.86%
ETH-1.93%
SOL-2.34%
This was purely the market being in a good mood and casually tossing out some gold coins—one just happened to land on my head. With the screen glowing green, I kept my eyes on $DGAI ’s order book and noticed it had stopped falling. Trading volume was also shrinking, while buyers at the bottom were unusually determined. I was thinking at the time: isn’t this exactly a sign that the bottoming process is over?

After entering at 0.6959, the price surged straight to 0.7852, putting a +252.85% return right in my face. I timed the rhythm so well that I wanted to applaud myself. Many people die befo
post-image
DGAI-0.28%
BNB-0.70%
SNDK+11.75%
$PUMP I’m bullish. Whales’ long-to-short ratio is 2.59 times that of retail traders, and the gap is right there—the price is 0.00421, down 23% from the 90-day high, yet retail traders are still desperately piling into short positions while whales are taking the opposite side and going long. The $93.0M in futures open interest also shows that the positions haven’t dispersed; this isn’t an abandoned market. Over the next 24 hours, I expect a bullish, consolidating range with limited downside, looking more like a gradual grind designed to wear down retail shorts. The 2.59x gap is right there, and
post-image
PUMP-1.47%
BULLS ARE COMING
BULLS ALWAYS WIN
🚀🚀🚀🚀
post-image
Just when I thought this move was completely dead, I actually perked up. When the early-session sell-off first hit, $MET ’s rebound was painfully weak, with no volume behind it and no buyers up there—isn’t that just handing me free points? I went straight in short at 0.1989. I was wondering whether I’d get worn down, but the wait paid off. It’s at 0.1837 now, +365.6%, and that feels damn good—the people on board must have woken up laughing.
Patience brings the right market opportunities, and profits come from holding your position.
Close 70% first and put the bulk in your pocket. Move the stop-
post-image
MET-7.37%
SOL-2.35%
BNB-0.70%
$4 Signal】1H volume breakout, bullish continuation
$4 broke above the upper Bollinger Band on heavy 1H volume, while the 4H MACD shows bullish expansion and the current price is hugging the outer channel. RSI 79.9 is flattening in overbought territory, with a 4.34% order book depth imbalance and buyers slightly dominant. OI is stable, with no signs of a squeeze, and the 0.025% funding rate shows no overheating.
🎯Direction: Long
⚡Entry/Limit Order: 0.02358304 - 0.02365400
🛑Stop-loss: 0.02341746
🚀Target 1: 0.02400881
🚀Target 2: 0.02418622
🛡️Trade Management:
- Reduce the position by 50% up
post-image
4+44.57%
BTC-1.86%
ETH-1.93%
SOL-2.34%
Bitlayer (BTR), the native asset of the Bitlayer ecosystem, continues to seek consolidation at its bottom levels after a sharp 70.2% pullback over the past 7 days. The BTR/USDT spot pair, recovering from its intraday low of 0.04547 USDT with buying interest, rose by 10.58% to 0.05278 USDT. Perpetual futures (Perp) contracts are trading at 0.05298 USDT, up 10.74%.
Volume Indicators and Capital Flows
Despite the immediate price rebound, derivative market and capital flow data indicate a cautious outlook:
Trading Volume: In the last 24 hours, the Gate spot market recorded a trading volume of 59.6
BTR+13.45%
  • 12
  • 2
$$Lobster's 29% gain: 87M in trading volume shows you what turnover-based distribution looks like
The price of 0.0938 is stuck between 0.1027 and 0.0711, with trapped holders above and profit-taking holders below. Going long here is just handing fees to the market maker. My system shows that the 0.0711–0.1027 range has already seen massive volume, but the price has failed to make a new high—a textbook distribution structure.
Here's the trading plan: Entry zone: enter only after a pullback to 0.084–0.086 holds; abandon the trade if it breaks 0.083. Stop-loss: 0.0805 (hard stop; a break below me
龙虾+29.85%
Everyone’s staring at $ETH /USDT’s range—but the 4h just armed a trap most won’t see until it’s too late.

$ETH /USDT - SHORT

Trade Plan:
Entry: 2446.97 – 2456.75
SL: 2498.80
TP1: 2416.66
TP2: 2393.19
TP3: 2357.98

Why this setup?
Why now? The 1D is range-bound, yet the 4h SHORT signal is armed at 2451.86 with a 55% confidence—not a slam dunk, but a precise edge.
• RSI on 15m is 43.79, showing weak momentum, not yet oversold—room to fall.
• ATR 1h is 19.55, so the move to TP1 (2416.66) is only ~1.4x daily noise—tight, actionable.
• Invalidation sits at 2462.70, just 0.4% above entry—
ETH-1.97%
Why is everyone long $H /USDT while the 4h chart screams 95% short conviction?

$H /USDT - SHORT

Trade Plan:
Entry: 0.07975 – 0.08055
SL: 0.08400
TP1: 0.07726
TP2: 0.07534
TP3: 0.07246

Why this setup?
- Daily trend is bearish, and the 4h signal just armed a SHORT at 0.08015 with 95% confidence.
- RSI 15m at 44.53 shows zero momentum to the upside—weakness is the story.
- Targets are stacked: TP1 0.07726 (-3.6%), TP2 0.07534 (-6%), TP3 0.07246 (-9.6%).
- Invalidation sits at 0.08400, but the alt-long setup needs a break above 0.08304—that’s a trap door, not a ladder.
- Why now? Pri
H+3.17%
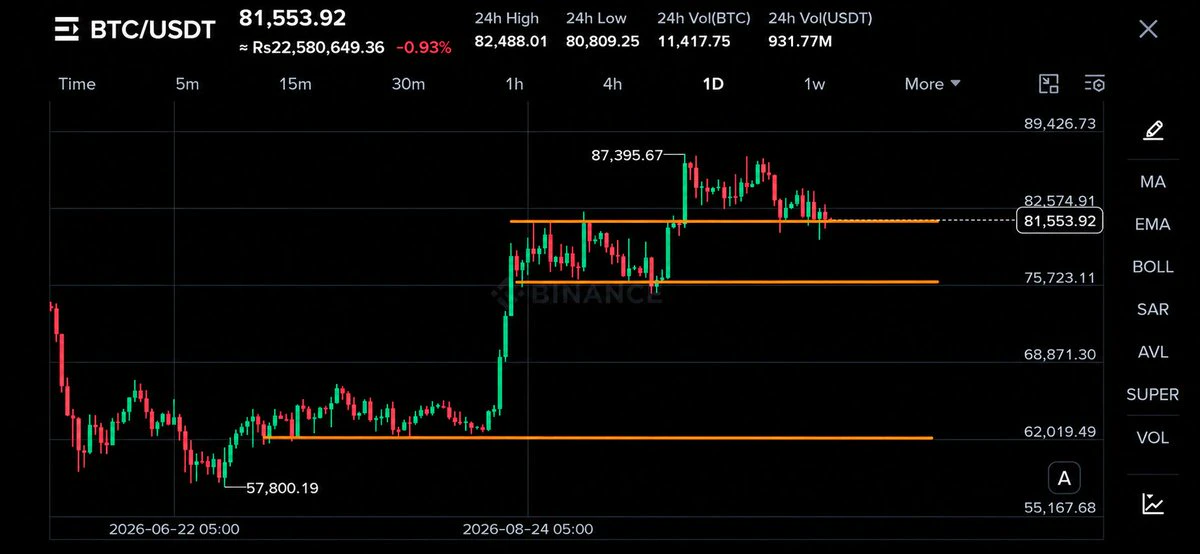
A deeper correction sub 58k would be a movie 🍿📺
$BTC
post-image
BTC-1.86%
  • 2
BTC and ETH quantitative trading
Automation available, completely freeing your hands
These strategies have all been validated in live trading for over a year
​Website data reads signals in real time
​The displayed data is the strategy data you can connect to.
BTC-1.86%
Load More

Join 40 M users in our growing community

⚡️ Join 40 M users in the crypto craze discussion

💬 Engage with your favorite top creators

👍 See what interests you

View More