




Share your thoughts
placeholder
Article
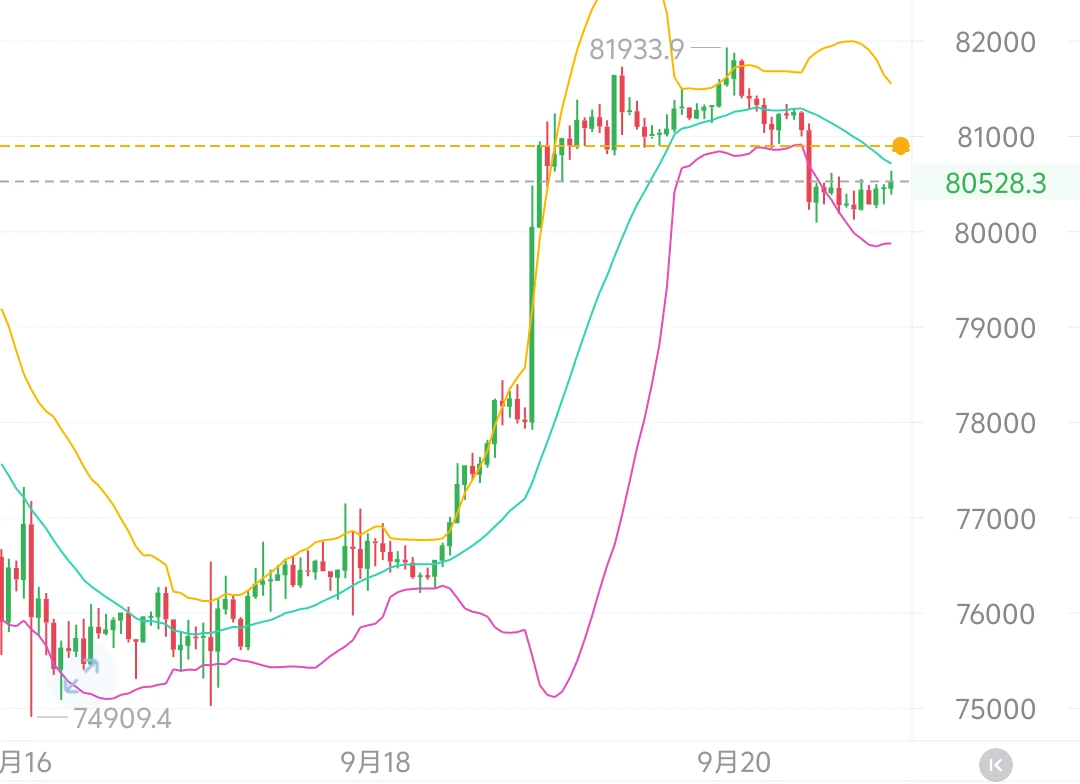
This week, BTC sent a very important signal: despite a concentration of bearish factors, its price was never driven below key levels and instead reclaimed 80,000, indicating that much of the bearish news had already been priced in by the market.
BTC is currently oscillating around 80,300. The first resistance above is 83,000; if it fails to break through, be alert for a pullback.
For support, focus first on 80,000–81,000, with stronger support at 77,500–78,500.
If it can later hold above 86,000 on strong volume, the upside will open up, with targets around 88,000–90,000.
$BTC $ETH #MSTR领涨纳指100
post-image
BTC-1.03%
ETH-1.59%
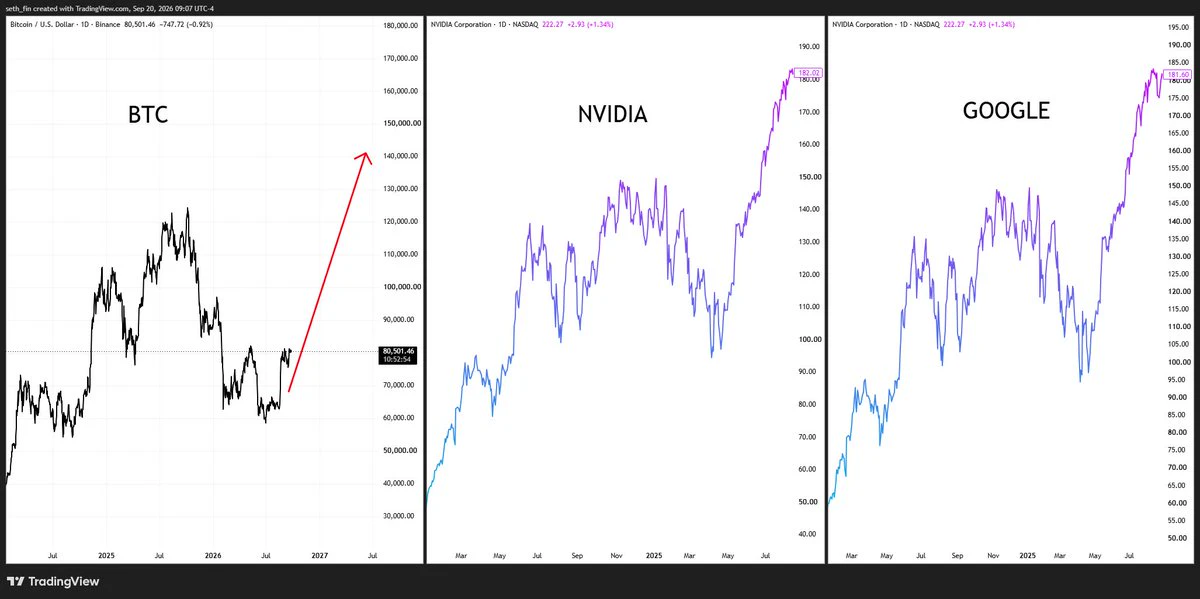
What if...?
$BTC follows $NVDA and $GOOG
post-image
BTC-1.05%
NVDA+1.23%
GOOG+0.13%
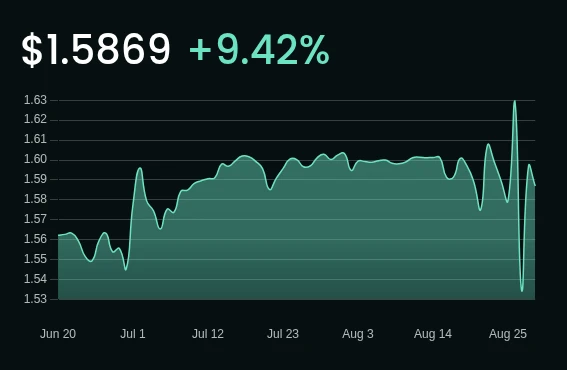
Kira's portfolio is up by 9.42% over 3 months, with an annualized gain of 14.68%! 🚀 Current value at $1.59 from a baseline of 1.4503. Exciting times in #DeFi and #Crypto! 📈 #Trading #Portfolio
Ready to start your journey?
post-image
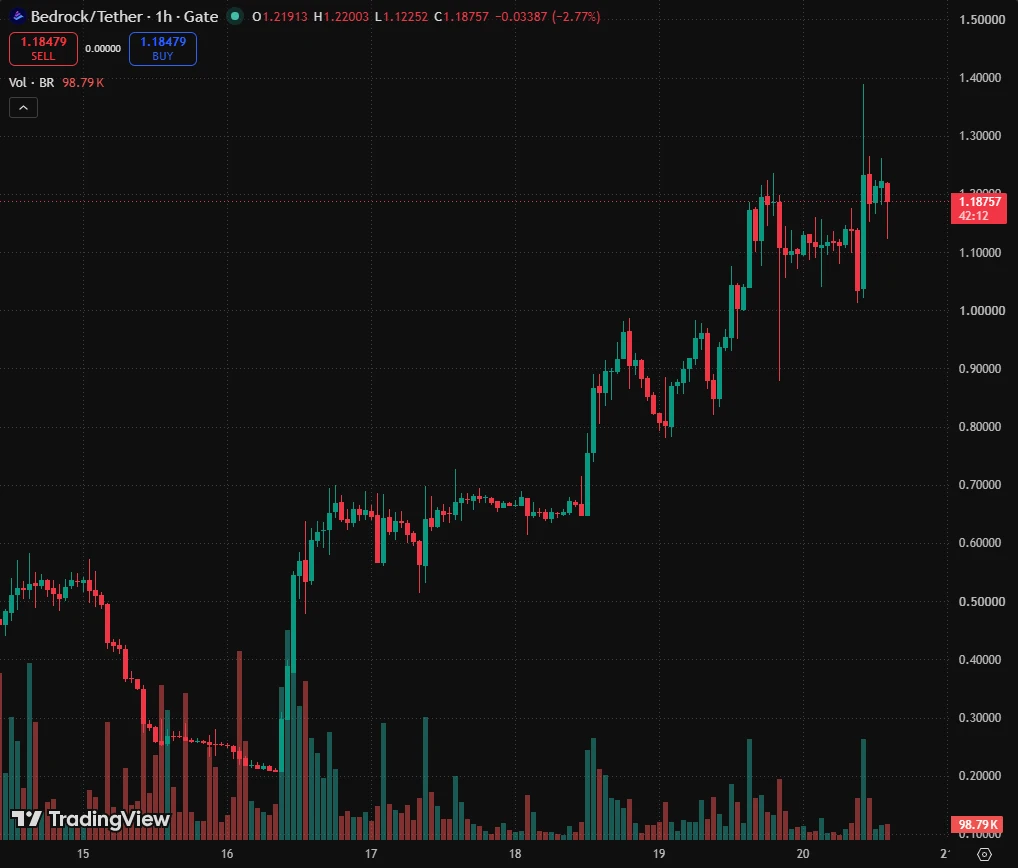
$BR BR/USDT: Long Setup — Continuation Leg Targeting +100% Expansion
Bedrock (
BR
) is maintaining strong bullish momentum following its breakout above major resistance around **$0.70 – $0.72**. With high volume holding the new support floor and momentum indicators remaining constructive, a high-volume confirmation above recent local highs opens up a clear path toward the $1.50+ structural targets.
A clean, high-volume break over $0.8200 confirms buyer continuation and sets up the next leg toward upper Fibonacci expansion zones.
*(Educational analysis only. Always manage your risk.)*
post-image
BR+12.21%
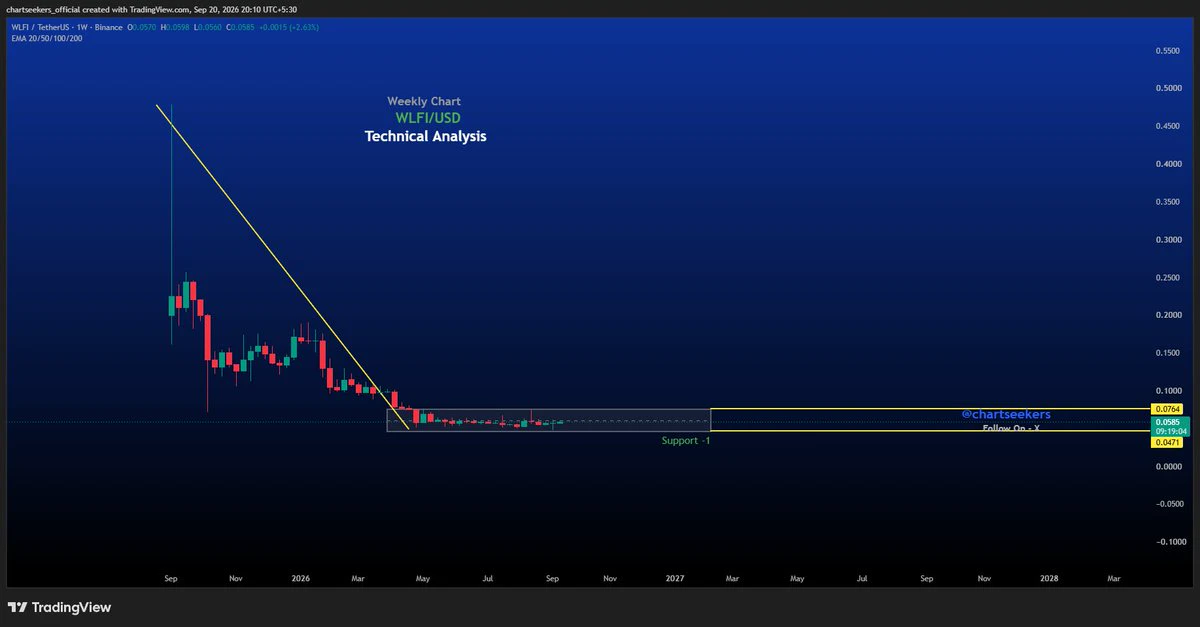
It looks like AKE has already stopped falling, and it will most likely fluctuate between 0.04 and 0.06 next. The market is showing signs of having bottomed out, and with the market makers deploying the funding-fee strategy, this means there are still shorts that survived the extreme rally, as well as shorts that entered later. It should be difficult for the price to break below this level in the short term. Therefore, now is the best time to enter and collect funding fees. Do you still remember Xiaoni? She previously bought the bottom of LAB, and at the peak, her unrealized position profit plu
post-image
AKE-17.84%
LAB-4.71%
Intraday one-way decline fell to around the low of 80100, currently fluctuating near 80500.
Minglou Evening:
Long around 80300-79800, targeting around 81200-82000
Long around 2560-2540, targeting around 2600-2630
$BTC $ETH
post-image
BTC-1.03%
ETH-1.59%
ethereum:0xda5e1988097297dcdc1f90d4dfe7909e847cbef6 Cooking Something
post-image
ETH-1.60%
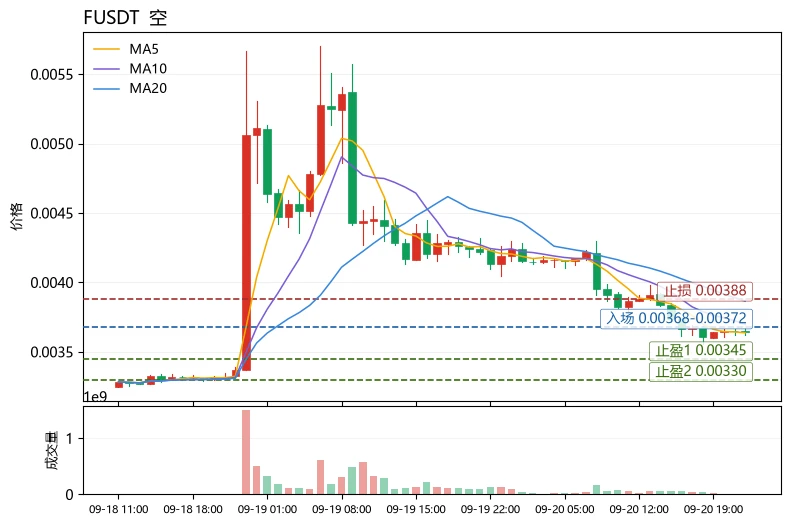
Many people directly equate “a big drop” with “it’s time to buy the dip,” which is the most typical trading misconception. The magnitude of the decline itself is not a reason to enter; volatility and structure are. $F is now down 12.21% over 24h, with a price range of approximately 21.76% across 30 candlesticks. This is not an environment for adding to a position casually, but one where you must first think through the worst-case scenario.
First, the structure: MA5=0.003637 has fallen below MA20=0.00386455, the MACD histogram is negative, and bearish momentum is still being released; RSI=33.6
post-image
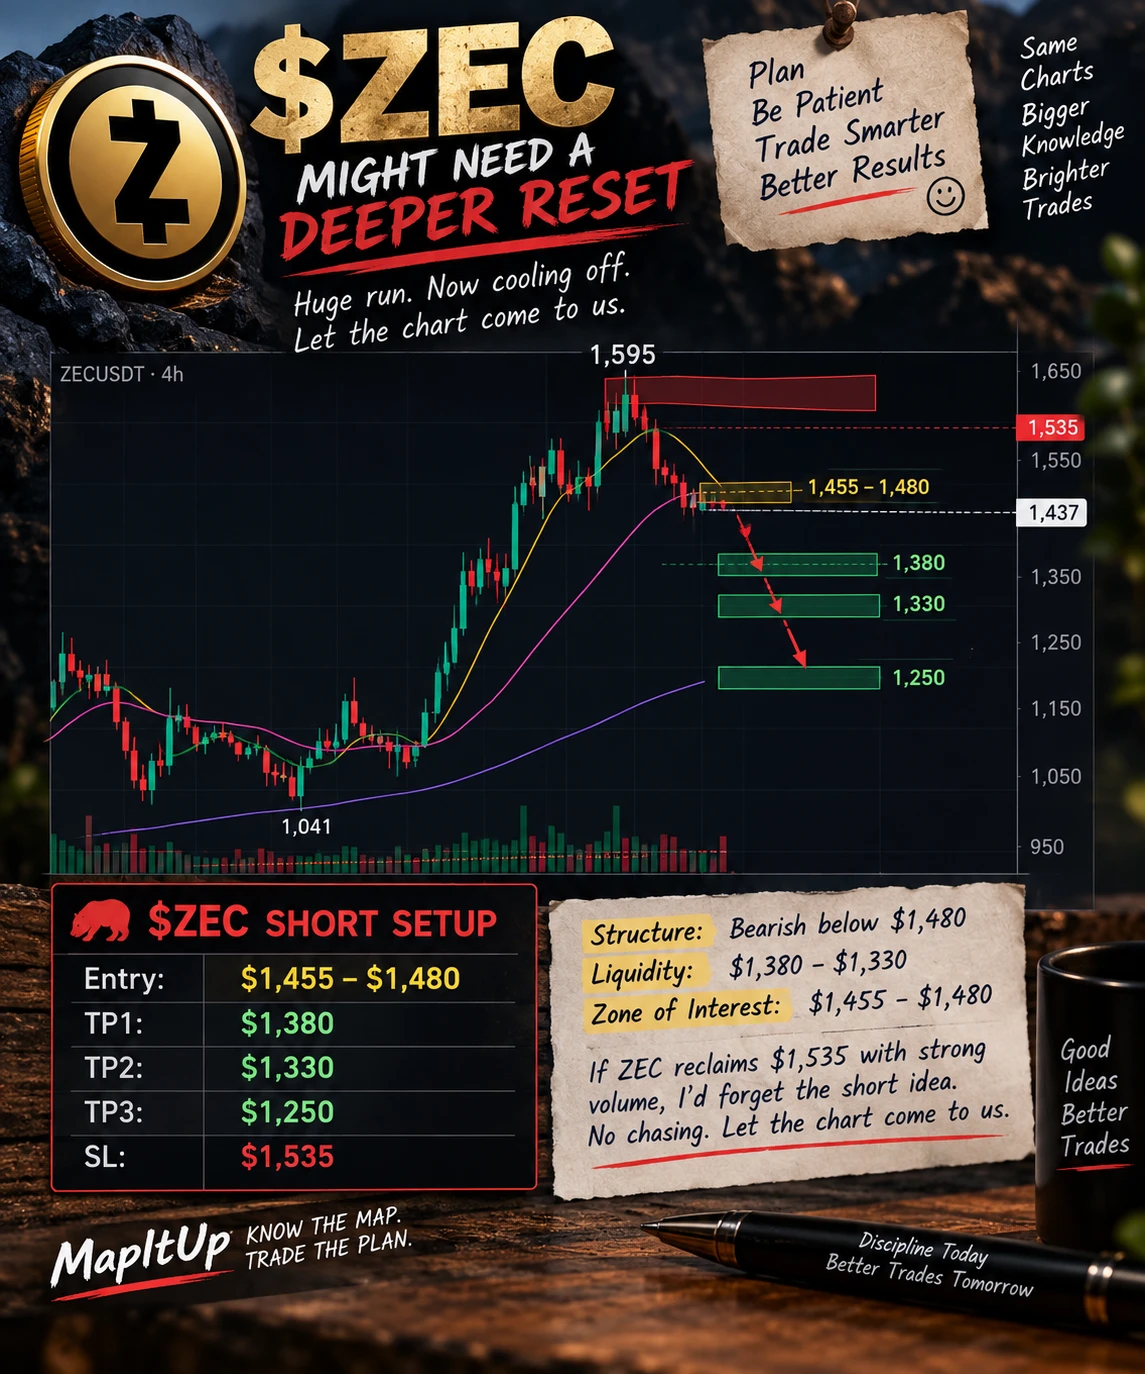
⚠️ $ZEC MIGHT NEED A DEEPER RESET
ZEC had a huge run up to around $1,595 and now it’s sitting near $1,437.
The 4H chart is cooling off and sellers are starting to take control. I’m not chasing the dump though. I’d rather see a bounce into $1,455–$1,480 and watch what sellers do there.
🔴 $ZEC SHORT
Entry: $1,455–$1,480
TP1: $1,380
TP2: $1,330
TP3: $1,250
SL: $1,535
Structure: Bearish below $1,480
Liquidity: $1,380–$1,330
Zone of Interest: $1,455–$1,480
If ZEC reclaims $1,535 with strong volume, I’d forget the short idea.
No chasing. Let the chart come to us.
#ZEC #TradingSignal
$ZEC ‌
post-image
ZEC-5.70%
#Glassnode称BTC呈牛市特征
#GateSquareMidAutumnReunion
Bitcoin has recovered strongly, but the bigger question is whether this recovery can develop into another sustained expansion. Glassnode’s recent analysis remains constructive, particularly because entity-adjusted SOPR is holding above 1. When this signal is combined with Bitcoin’s price recovery, ETF flows, realized profit, selling pressure and market structure, the picture looks bullish but still requires confirmation.
Bitcoin recently moved back above $80,000 and traded around the $80,300–$81,300 area, with the September 19 range reaching ro
post-image
BTC-1.05%
ETH-1.60%
Layout for Bitcoin, Ethereum, and Dogecoin
live-cover
LIVE1,519
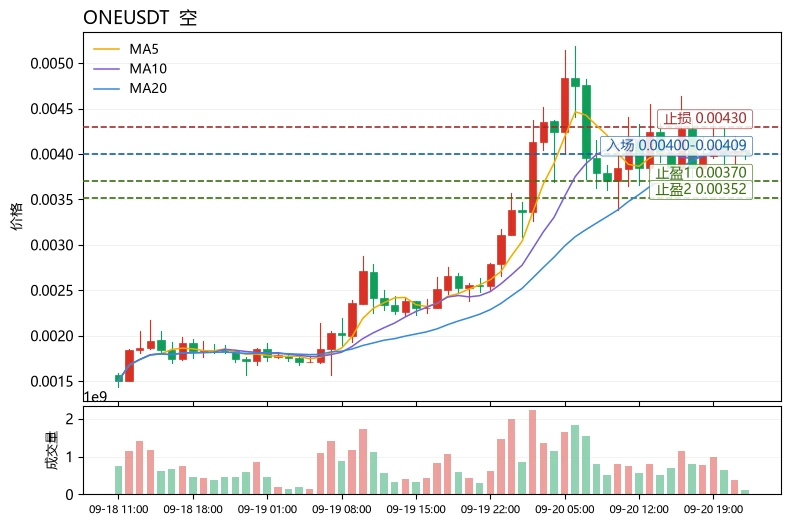
After a 56% surge in a single day, can $ONE still be chased? The answer depends on whether your position can withstand a pullback.
ONEUSDT is currently at 0.004006, up 56.18% over 24h, with an amplitude of approximately 72% across 30 candlesticks, placing volatility in an extreme range. Technical indicators are not aligned: MA5=0.0040212 has fallen below MA20=0.0040883, the MACD histogram is -7.37e-05 and remains bearish, while RSI is only 55.5, indicating that this surge was a pulse-like spike rather than a healthy trend with bullish moving-average alignment. More importantly, the funding ra
post-image
ONE+64.96%
COTI-15.04%
EPIC+15.91%
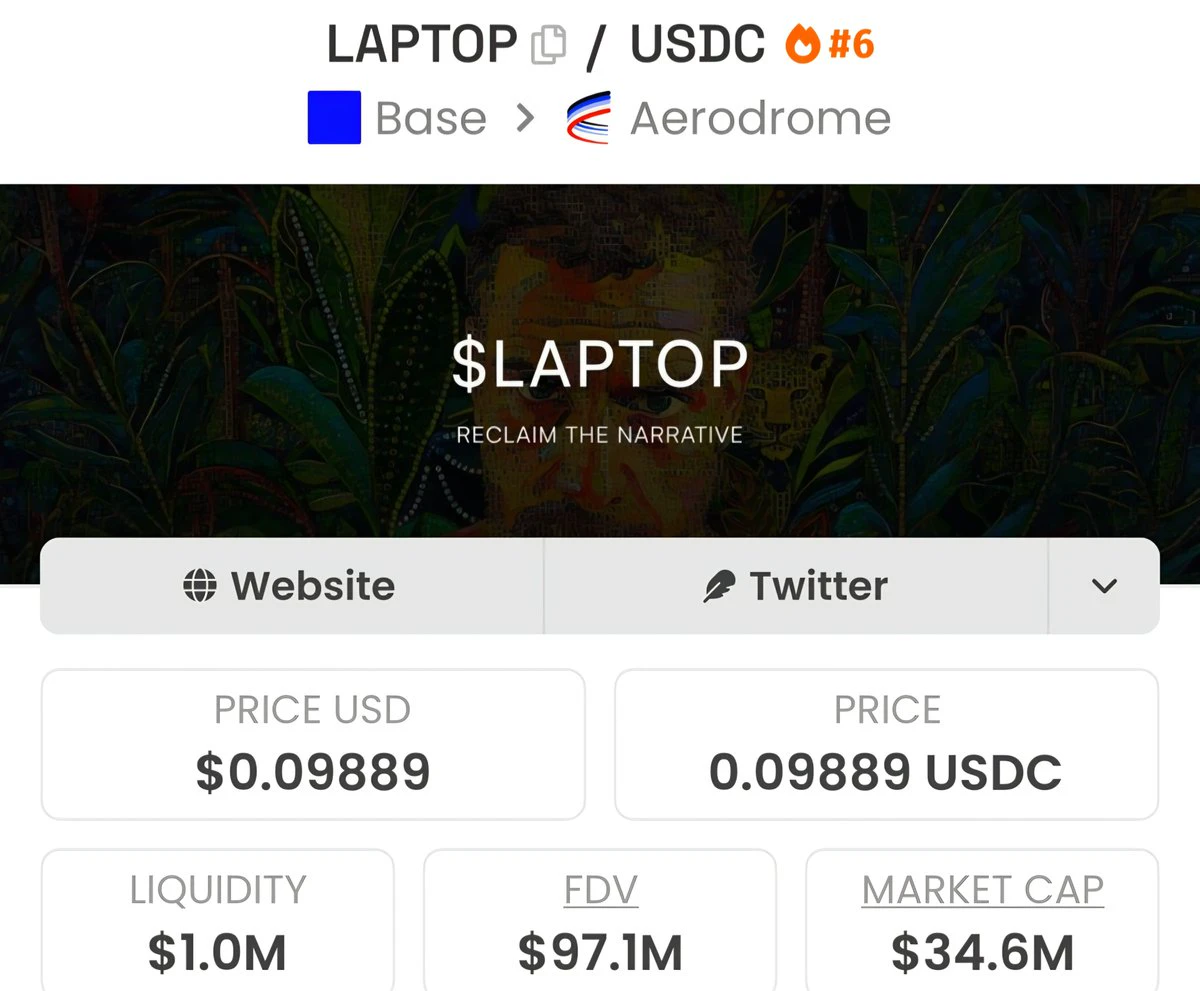
$LAPTOP , which reached $110B MC at launch, is currently at the $34M level!
Someone who bought this token at the peak needs a 3200x just to break even!
Could we call this the biggest fiasco in crypto history?
post-image
LAPTOP-8.61%
GM ☀️
What's one thing you're making time for lately that brings more meaning to your life?
post-image
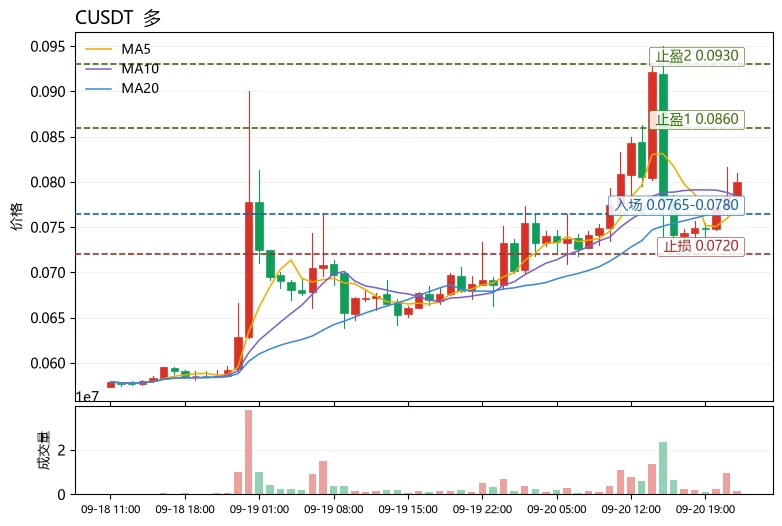
$C is the most worth-watching catch-up play in this sector this round, but in terms of timing, it still needs to wait for a pullback confirmation. Conclusion first: bullish, do not chase the highs.
A horizontal comparison of relative strength: AVAX is +15.22% over 24h, with a trading volume of 121.2M; RSI has reached 73.5, and the price is above the Bollinger upper band at 10.6235, making it a typical strong overbought asset. NEAR is +3.54%, with a trading volume of 253.6M; MA5 has crossed above MA20 and MACD is bullish, but the gain is mild and the amplitude is only 9.5%, making it relativel
post-image
AVAX+18.06%
NEAR+4.78%
Written on Arc’s Launch Day—Why Should You Pay Attention to This “Un-Crypto-Like Crypto Chain”?
On September 16, Arc officially launched. This chain is “unlike crypto” from start to finish—its validators are BlackRock and Visa, its gas is paid in USDC, it is positioned as an “institutional settlement network,” and it is not even rushing to publicly launch a token.
But precisely because it is “unlike crypto,” it is worth watching.
The crypto industry has been discussing “mass adoption,” but mass adoption will not come from retail speculation—it will come from institutions entering the market. W
NVDA+1.23%
SAYLOR may have already bought more $BTC
! Michael Saylor reposted this chart that he often shares every Sunday. SaylorHintsStrategyBitcoinBuy This means that the more orange dots there are, the more buying is taking place. He reposted this chart today. He will very likely make another quite sizable purchase. We have previously mentioned how important these purchases are. He holds almost as much Bitcoin as Satoshi Nakamoto. I think these purchases may have to stop at some point, and he may even start selling. Do you think this dominance by a single institution will one day come to an end?
post-image
BTC-1.05%
$SOL : Is Speed Enough
Solana is famous for speed; but speed in the market does not always mean price gains. Price sits in the 108 dollar zone, the daily drop is above three percent, and the daily range is 107–112. Sharp swings, wide bands, fast changes of mind.
SOL's story is still strong: high throughput, low cost, a lively developer ecosystem and real usage coming from memecoin traffic. But part of that usage is cyclical; when speculative volume on the network cools, revenue cools with it.
What the wolf watches comes down to three headings. Network fees and active addresses: is the demand r
post-image
xxx40xxx
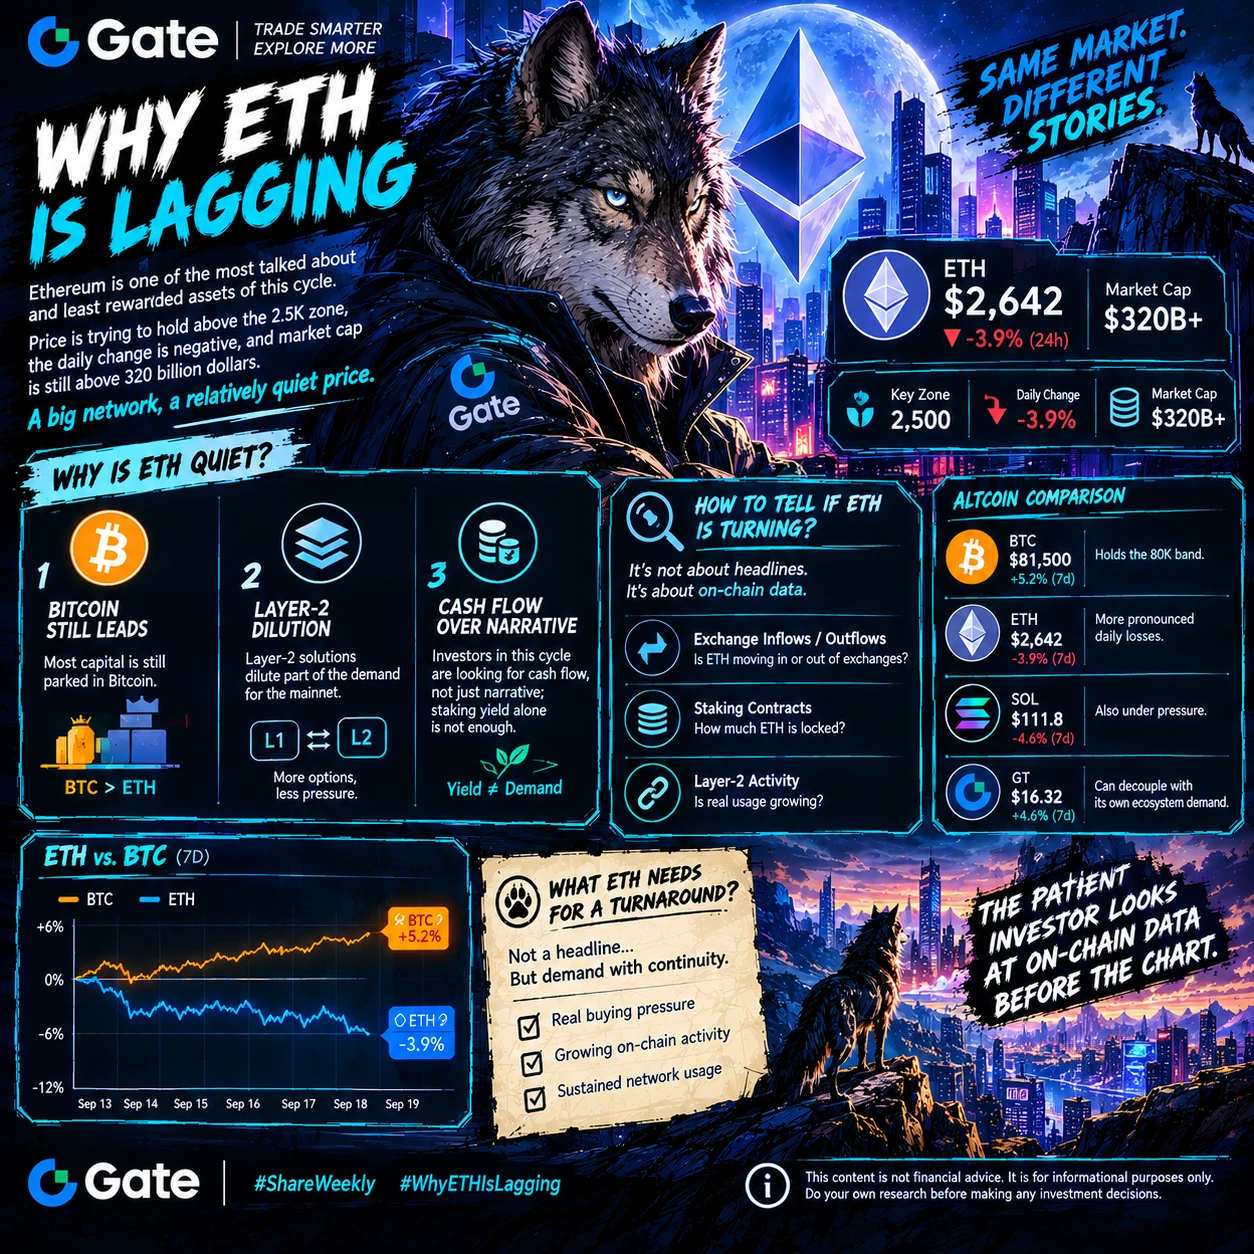
Why ETH Is Lagging
Ethereum is one of the most talked about and least rewarded assets of this cycle. Price is trying to hold above the 2.5K zone, the daily change is negative, and market cap is still above 320 billion dollars. A big network, a relatively quiet price.
There may be three reasons for the silence. First, most capital is still parked in Bitcoin. Second, layer-2 solutions dilute part of the demand for the mainnet. Third, investors in this cycle are looking for cash flow rather than narrative; staking yield alone is not enough.
For the wolf the question is this: does ETH take back the lead, or does it stay a cheap side asset? The way to find out is not social media headlines; it is the amount of ETH moving in and out of exchanges, the total held in staking contracts, and layer-2 activity.
Comparison helps too: while BTC holds the 80K band, ETH and SOL show more pronounced daily losses. GT, meanwhile, can decouple thanks to its own ecosystem demand. This shows why tying an altcoin basket to a single story is risky.
What ETH needs for a turnaround is not a headline but demand with continuity. That is why the patient investor looks at on-chain data before the chart.
Risk Note: This content is not financial advice. It is for informational purposes only. Do your own research before making investment decisions.
$BTC $GT $ETH $SOL
#GateSquareMidAutumnReunion #BTCRetakes80K #WeekendMarketBullishOrBearish #WeeklyShare #ShareWeekly
repost-content-media
SOL-3.07%
BTC-1.05%
GT0.00%
ETH-1.60%
  • 1
Market update
live-cover
LIVE1,062
#周末行情你看涨还是看跌 #每周来晒
For this weekend, my overall market view is cautiously bullish. I am not looking at a simple green-market narrative; I am looking at price structure, volume, liquidity, momentum and the ability of buyers to absorb macro pressure.
Bitcoin has recovered back above the $80,000 psychological level, while Ethereum has returned toward the $2,600 area. The broader crypto market has also shown renewed risk appetite. For me, the key question is not whether the market can move higher for one candle, but whether buyers can defend the important levels and confirm the breakout with vol
post-image
BTC-1.05%
ETH-1.60%
COIN+11.64%
HOOD+9.10%
Load More

Join 40 M users in our growing community

⚡️ Join 40 M users in the crypto craze discussion

💬 Engage with your favorite top creators

👍 See what interests you

Trending Topics

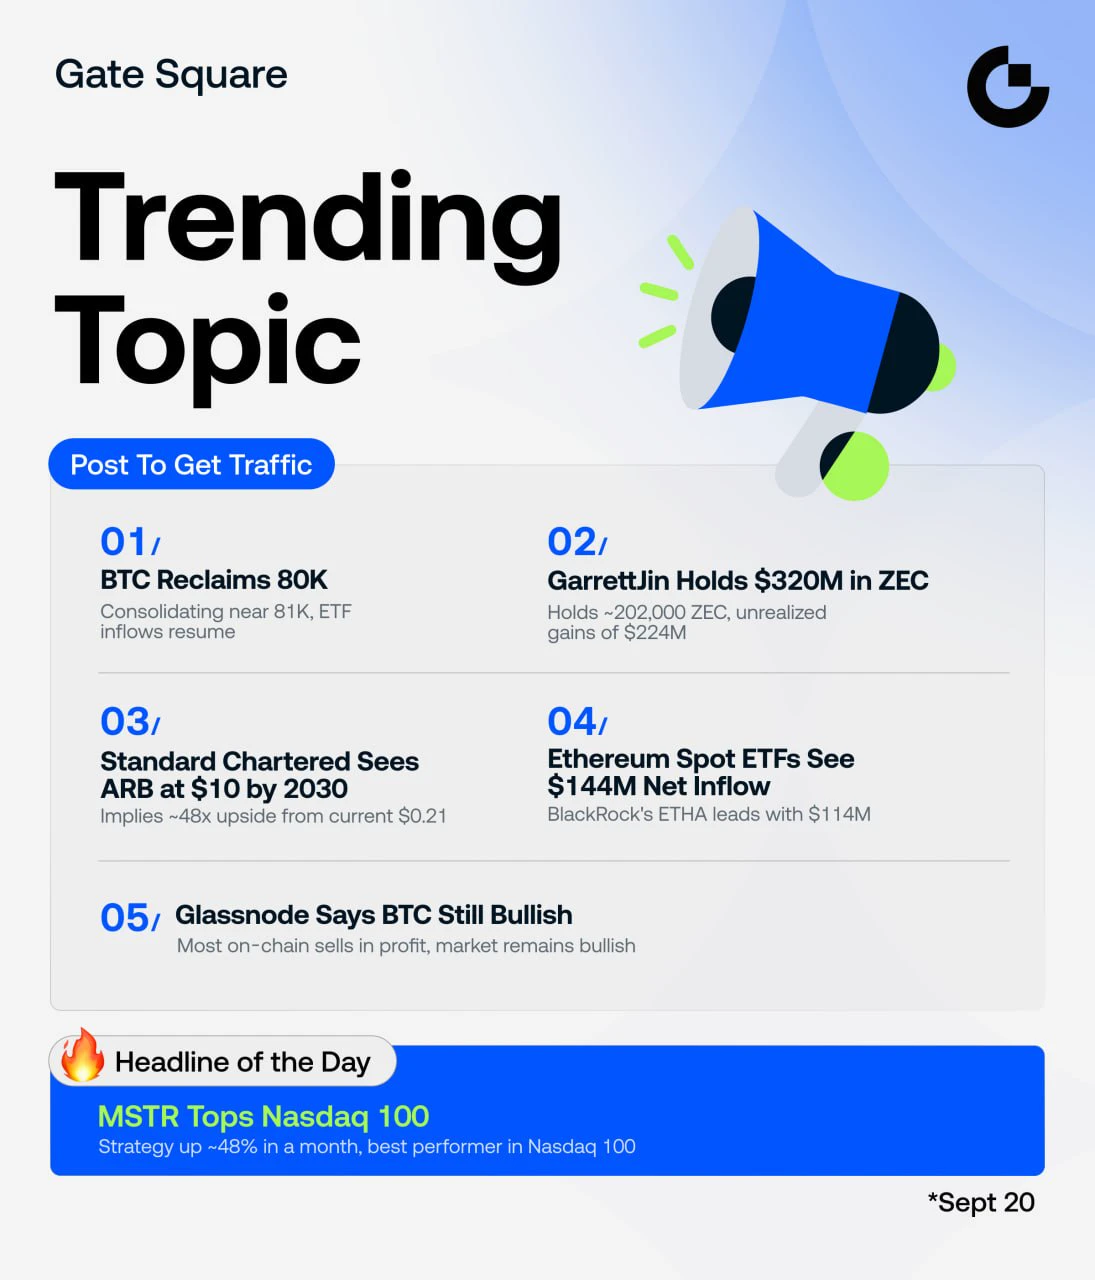
MSTRTopsNasdaq100

74.08k Views2.98k Discussing

Strategy (MSTR) has gained about 48% over the past month, making it the best-performing stock in the Nasdaq 100, while Bitcoin rose roughly 12% over the same period. The company holds 845,050 BTC with a cumulative cost basis of about $63.73B. MSTR is not a pure Bitcoin proxy — its price swings can be more extreme. Can this rally last?

Gate Tops 24H Net Inflows Among Exchanges

26.43k Views3.69k Discussing

BTCRetakes80K

57.12k Views60.56k Discussing

View More