Share crypto content and earn up to 60% commissions through content mining.
placeholder
gatefun
I was just about to go to the forum and rant, but then I saw my balance. Forget it—the market daddy is always right🙏.

During the repeated intraday swings, $BASED was dumped and pumped in turn, making many people flip-flop, but the bids in the order book kept getting stronger. The 0.06253 level was tested repeatedly without breaking, building a base without breaking down—that’s the confidence to hold steady. I reminded myself at the time: the chart may look ugly, but as long as the price hasn’t broken down, don’t scare yourself.

Later, it rallied from 0.06253 to 0.07225, securing +750.67%.
BASED-1.73%
SNDK-9.09%
LAB-0.92%
View Original
post-image
  • Reward
  • Comment
  • Repost
  • Share
I only meant to take a quick look at the market, but $XPL went straight vertical on me. While everyone was still watching from the sidelines, I spotted it as soon as the chart started to move. That pullback around 0.08436 showed no signs of breaking down at all. After moving sideways at the bottom for so long, buying pressure was clearly strengthening, so I figured a trend change was coming. It’s now at 0.09766, with a +1112.72% return—this trade has been incredibly satisfying. Those long days of enduring the consolidation weren’t wasted; getting the timing right brings big gains. I’ve taken 8
XPL-5.04%
SOL3.35%
ETH1.07%
View Original
post-image
  • Reward
  • Comment
  • Repost
  • Share
Layout for Bitcoin, Ethereum, and Dogecoin
gate liveLIVE
1,655
  • Reward
  • Comment
  • Repost
  • Share
I just tapped refresh, and it shot up as if I had scared it. During the intraday bottoming phase, $ETH FI ’s rhythm was incredibly boring, but capital inflows don’t lie. I figured it was ready to move at any moment, so I opened a long early at 0.4789—and it really did move sharply higher all at once.

Now at 0.6178, with a juicy +2059.45% gain served right to our mouths, those already on board should be laughing themselves awake. When you’re unsure about a trade, taking a look keeps you clear-headed; buying a position makes you foolish. Take 75% off the table first, then raise the stop-loss on
ETHFI0.19%
BTC1.77%
ETH1.07%
View Original
post-image
  • Reward
  • Comment
  • Repost
  • Share
#GateStockInsightsChallenge
NVIDIA The Real Test Is Whether AI Demand Can Still Surprise the Market
NVIDIA is approaching another major earnings moment, and once again the entire technology market is watching. But this time, I believe the most important question is not simply whether NVIDIA will beat earnings expectations. The real question is whether the company can deliver a future outlook strong enough to convince investors that the AI growth cycle still has significant room to expand.
My overall view remains bullish on $NVDA, but expectations are now extremely high.
NVIDIA has become the
NVDA-2.92%
post-image
post-image
  • Reward
  • Comment
  • Repost
  • Share
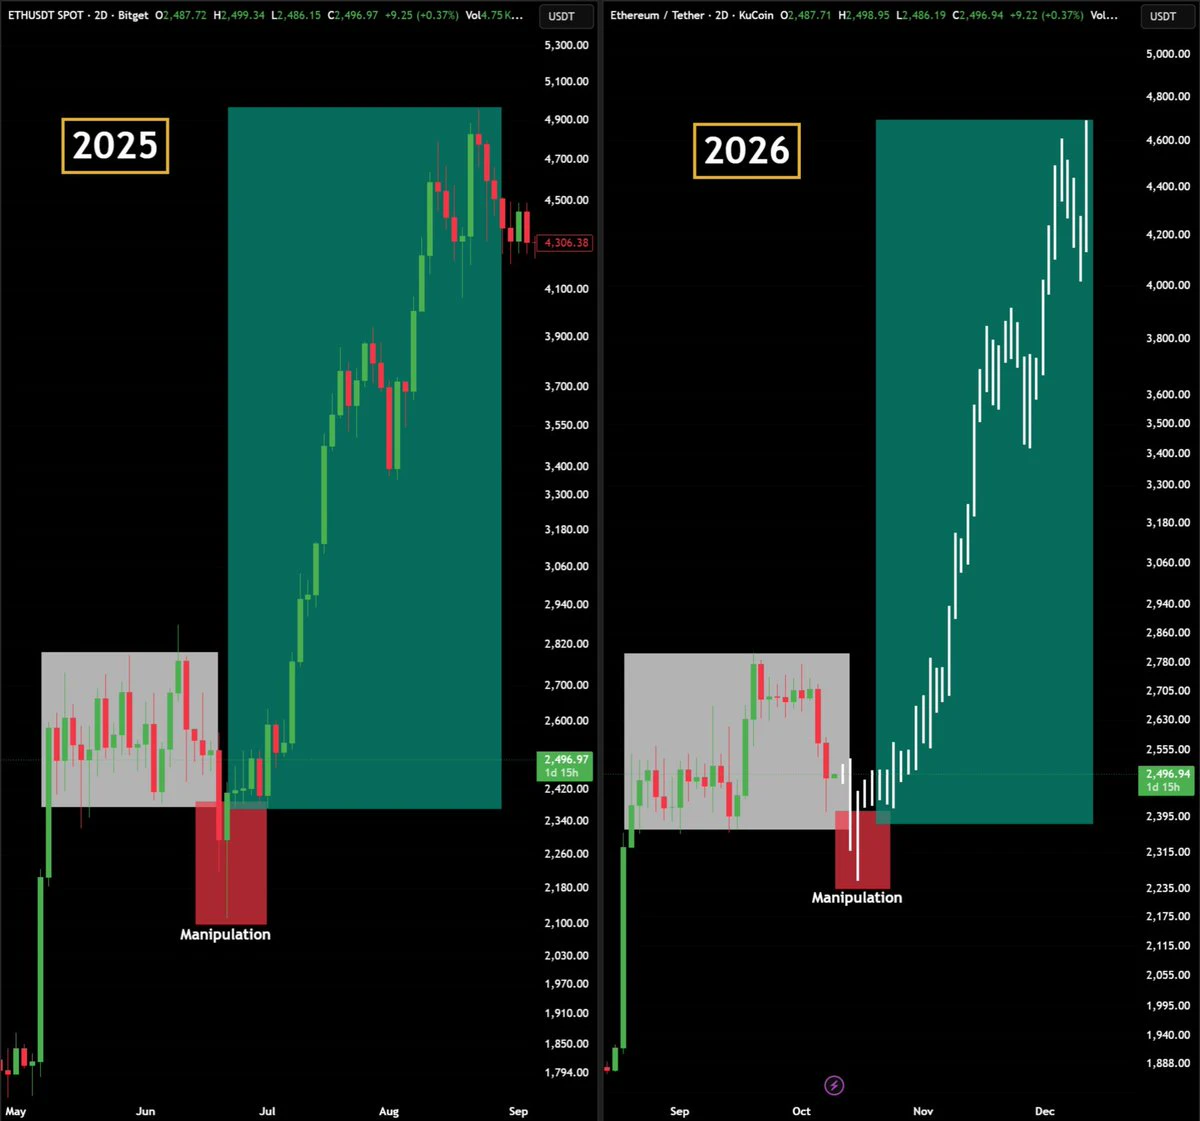
$ETH pumped +31% this week and printed its highest weekly close since May 2025.
ETH is now testing the Weekly MA 200 MA the most important line for trend reversal.
The chart shows:
1. Strong bounce from long-term support near $1,500
2. Previous bounce from the same zone was nearly +39% in May 2025, which led ETH toward a new ATH in just 4 months
3. Weekly MACD is turning up from the same oversold area that marked earlier bottoms
Key Levels
- Resistance: Weekly MA 200 / $2,500
- Next resistance: $3,400
- Support: $1,900 and $1,500
Two scenarios:
1. Hold and close above the Weekly MA 200 will
ETH1.00%
post-image
  • Reward
  • 2
  • Repost
  • Share
HalfPercentMan:
MACD has turned upward in the bottoming area, which is an interesting signal. Historically, a decent rebound has followed when this appeared. But if it gets capped by the weekly MA200 and pushed back down, 1900 and 1500 will need to be tested again. Stay calm and don’t go all-in.
View More
August 25 Gold Morning Outlook
The buy-on-dips approach during the midnight session played out as expected. After a pullback to support, gold rebounded again. The support zone identified at midnight effectively held the market, with the levels closely matching price action.
Technical analysis: The 1-hour Bollinger Bands are opening upward, and gold is trading between the middle and upper bands. The 30-minute Bollinger Bands have turned upward, with price holding above the middle band and KDJ rising again. The bullish structure on higher timeframes remains intact, the short-term correction has
GLDX0.97%
PAXG1.43%
View Original
post-image
  • Reward
  • Comment
  • Repost
  • Share
I just casually hit refresh, and it dropped on its own, leaving me in a very passive position.

Right after I saw the bearish news, the market had not fully started moving yet. Selling pressure above $OPG was obvious, and every rebound was followed by a tentative pullback, with strong selling. I felt the rebound was very weak, so I did not chase longs and instead opened a short position at 0.2056. Looking at 0.0953 now, the +1056.32% profit has already been secured. The market served me perfectly this time.

It’s not that my prediction was particularly accurate—the market wrote the answer o
OPG-1.34%
BNB0.38%
LAB-0.92%
View Original
post-image
  • Reward
  • Comment
  • Repost
  • Share
This kind of profit has me feeling anxious, afraid the market will realize what happened tomorrow and blacklist me. When $TRB plunged to 16.28 intraday, everyone else was running while I actually perked up: the key levels were clearly moving higher, the bear trap signals were too obvious, and it was forming a bottom without breaking down—an easy win. After decisively getting in, the market steadily recovered to 18.65, delivering a gain of +1038.04%. Staying out of the market isn’t a sin; opening positions recklessly is the real mistake. But when it’s time to act, don’t be timid. Take 80% in pr
TRB-3.62%
SNDK-9.09%
BTC1.77%
View Original
post-image
  • Reward
  • Comment
  • Repost
  • Share
NEAR 4-hour chart hides a mystery—has a 95% win-rate signal appeared?
$NEAR /USDT - LONG
Trading plan:
Entry: 1.9308 – 1.9534
SL: 1.8339
TP1: 2.0232
TP2: 2.0773
TP3: 2.1585
Why pay attention to this setup?
- The 1D trend is clearly bullish, while the 4H chart has pulled back to the key support at 1.9421—an ideal entry window.
- The 15-minute RSI is only 40.35, suggesting a short-term oversold rebound is imminent, with limited room for a downside wick.
- ATR 1H is 0.045, indicating moderate volatility. The stop-loss at 1.8339 is clearly defined, with a risk-reward ratio as high as 1:3+.
- Why n
NEAR-3.33%
View Original
post-image
post-image
  • Reward
  • Comment
  • Repost
  • Share
August 25 Jinman Gold Morning Review: Consolidation After a Sharp Rise! Gold Enters High-Level Range Trading After Hitting a New High of 4680!
Gold prices surged sharply yesterday, reaching a new high of 4680.91 for the current phase. During today's morning session, prices entered a high-level consolidation phase to digest short-term profit-taking. The latest quote is 4660.41, up slightly by 0.19% intraday.
Technically, the Bollinger Bands on the 1-hour chart are beginning to contract, with prices fluctuating below the upper band, indicating a short-term need for a pullback and consolidation;
BTC1.75%
ETH1.00%
View Original
post-image
  • Reward
  • Comment
  • Repost
  • Share
8.25 Gold Morning Strategy
The hourly Bollinger Bands are trending upward, while gold prices continue to fluctuate repeatedly at high levels. After surging higher, upward momentum has slowed somewhat, and the price is trading below the upper Bollinger Band. Although the broader bullish trend remains intact, short-term indicators show signs of divergence, so beware of the risk of a pullback from high levels.
Key Levels
Resistance: 4668, 4680
Support: 4640, 4629
Strategy:
Go long after the price pulls back to the 4640‑4655 range and stabilizes, targeting 4668, with a break above it pointing towa
XAUT1.47%
View Original
post-image
  • Reward
  • Comment
  • Repost
  • Share
$wiwiwi ?
Wiwi-wiiiiiiiiiiiii!
From the Milly to the billy? 👀
Watch this community being silly
  • Reward
  • Comment
  • Repost
  • Share
#Gigachad, #doge
2026 gigachad to the moon
#Crypto: #ElonMusk
GIGA13.19%
DOGE-3.53%
post-image
post-image
  • Reward
  • Comment
  • Repost
  • Share
ALL $SOL pairs are green. I wonder why?? 🚀
SOL3.26%
post-image
  • Reward
  • Comment
  • Repost
  • Share
BTC 4-hour bearish signal—do you believe it or not?

$BTC /USDT - SHORT

Trading plan:
Entry: 78533.2 – 78871.4
SL: 80325.3
TP1: 77485.1
TP2: 76673.6
TP3: 75456.3

Why pay attention to this setup?
- BTC is currently quoted at 78702. The 4-hour SHORT signal has been activated, with a confidence level of 55—not the time to go all-in, but it is worth watching.
- Why now? The 1D trend is still range-bound, but the 1H ATR is as high as 676, indicating that volatility is expanding and a short-term direction is about to be chosen.
- Entry reference: 78702. TP1 is 77485 and TP2 is 76673. If support
BTC1.77%
View Original
post-image
post-image
  • Reward
  • Comment
  • Repost
  • Share
#StakeALIGNShare10MTokens
Gate Launchpool’s ALIGN campaign is pretty eye‑catching:
Pools Available
ALIGN Pool → Estimated APR: 289%
USDT Pool → Estimated APR: 6.71%
GT Pool → APR not listed yet, but included in the staking options
Distribution
Total rewards: 10,000,000 ALIGN
Rewards are distributed hourly to stakers
Mechanics
You can stake USDT, GT, or ALIGN directly.
The ALIGN pool offers the highest estimated APR, but it also carries higher volatility risk since rewards are paid in ALIGN itself.
USDT pool is safer with a modest APR, while GT sits in between depending on Gate’s ecosystem dyn
ALIGN-2.11%
post-image
post-image
  • Reward
  • 1
  • Repost
  • Share
ybaser:
Just send it 👊
Kylie Jenner launched a memecoin today?
I wonder how it went.
MEME-3.68%
post-image
  • Reward
  • Comment
  • Repost
  • Share
Load More

Join 40 M users in our growing community

⚡️ Join 40 M users in the crypto craze discussion
💬 Engage with your favorite top creators
👍 See what interests you
  • Pinned