
Technical analysis is an analytical method to forecast future trends and changes by reviewing past price trends and trading data, looking for the law of price changes in the trading market. Compared with fundamental analysis that evaluates market prices from multiple facets, technical analysis is simpler as it focuses on price action and various indicators calculated from extensive transaction data.
The History of Technical Analysis
Assumptions of Technical Analysis
1.Price is always a reflection of the latest market information and news. Price is like a mirror that demonstrates the impacts of news on price movements in real time.
2.Identifiable patterns and trends can still be found even in a seemingly random price action. Prices are susceptible to past trends and may continue to move in this direction.
3.Influenced by market participants’ psychology and emotions, history tends to repeat itself. Therefore, prices move in one direction periodically and are less likely to reverse abruptly.
Application
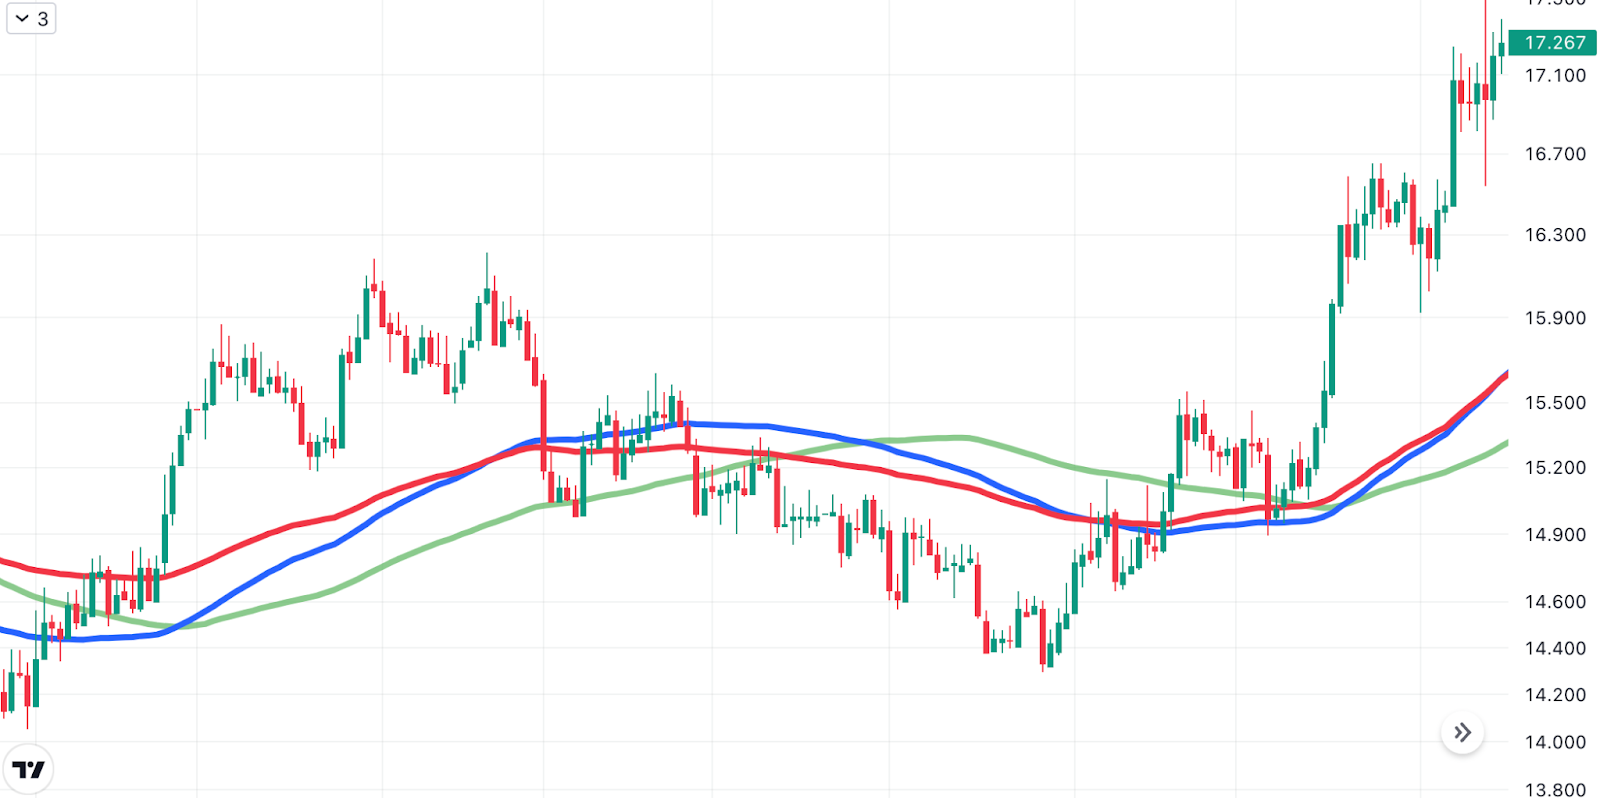
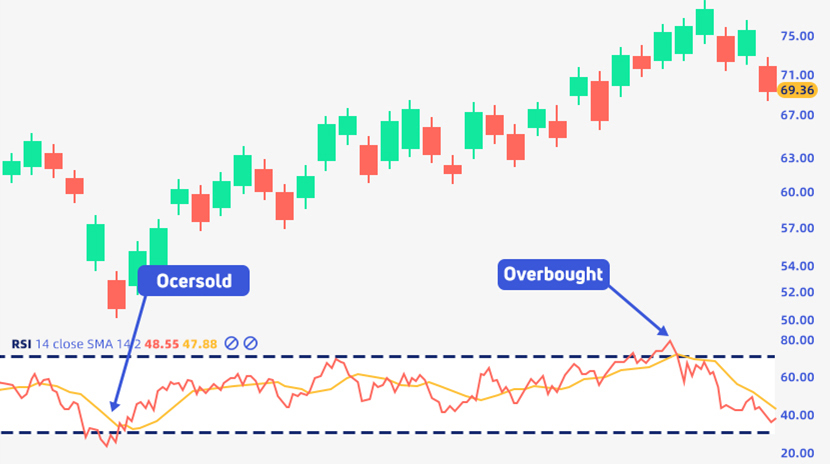
(WMA). WMA uses the most recent weighted prices to highlight trend deviations and reversals. The Relative Strength Index (RSI) is another commonly used indicator, which uses mathematical calculations to normalize the difference between the price increase and the price decrease to obtain a value ranging from 0 to 100. In a bull market where the price increase is greater than the price decrease, the RSI value will be higher, and vice versa. An asset is usually considered overbought when the RSI value is above 70 and oversold when it is below 30.
**
**
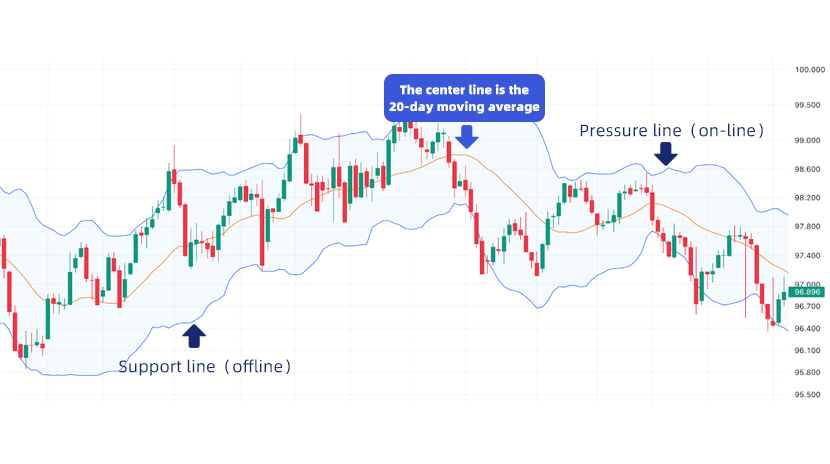
A Bollinger Band (BB) is also a popular technical indicator. It draws the possible price range on a candlestick chart combining a moving average and standard deviations. Specifically, it puts the SMA of the past prices of n days in the center, calculates the standard deviation of the prices of n days, and then extends m*standard deviations up and down as the boundary. The feature of Bollinger Bands is that when the price oscillates back and forth along the moving average, the probability of occurrence of different prices can be calculated by statistical methods. Under the normal distribution, about 95% of the values will fall within the range of 2 times the standard deviation from the central value. When the price is close to the upper or lower edge of the Bollinger Band, it usually indicates a large deviation from the mean, which may be a potential buying or selling opportunity.**
**
**
**
Limitations of Technical Analysis
Although technical analysis is easier and convenient to use, there are still some limitations that need to be paid attention to. First of all, we should know that technical analysis is only a tool for traders to analyze the market. Therefore, the results of technical analysis are usually rather subjective, mixed with personal prejudice and biases. Different people may come to completely different conclusions using the same technical indicators. However, technical analysis has the potential to create self-fulfilling prophecies. When a big group of traders in the market behaves the same way, the price will move in the direction expected by the group, though this has nothing to do with the correctness of the analysis itself. In addition, technical analysis ignores many factors of fundamental analysis and is based on historical statistics only. However, we should know that exceptional cases may occur and unidentified factors exist no matter how thorough the analysis is. When using technical analysis, we should always fully understand its limitations to avoid being misled.
Conclusion
* The information is not intended to be and does not constitute financial advice or any other recommendation of any sort offered or endorsed by Gate.
* This article may not be reproduced, transmitted or copied without referencing Gate. Contravention is an infringement of Copyright Act and may be subject to legal action.


Related Articles

What Is Fundamental Analysis?

Risks You Must Be Aware Of When Trading Crypto

Influence360 Introduces AI-Powered Infrastructure for Data-Driven Web3 Influencer Campaigns

What Kalshi’s New Employer Disclosure Rule Means for Prediction Markets and Insider Trading

Why Michael Saylor’s Latest Post Is Fueling Bitcoin Buying Speculation Again