

DoorDash launches stablecoin payments: Delivery platform advances digital financial integration
I. Introduction: Why a Framework Matters More Than Price Targets for Bitcoin in Q2
As we enter the second quarter of 2026, Bitcoin (BTC) pricing is still shaped by both the internal dynamics of the crypto market and broader global macro liquidity. Public data shows that US spot Bitcoin ETFs have recently posted notable weekly net inflows, with some reports citing single-week totals nearing or exceeding $1 billion and highlighting products like BlackRock IBIT as major contributors to these flows. At the same time, technical narratives frequently reference “key resistance zones—lower support zones” as central to price action. For investors and researchers, the most prudent approach is to break down Q2’s market moves into verifiable data, interpretable drivers, and risks that can be reviewed, rather than chasing a single target price.
This article organizes recent media reports and public discussions, supplemented by an analytical framework. It does not constitute investment advice; readers should independently verify all data sources and consider their own risk preferences.
II. Recent Market Developments: Three Core Threads
Marginal Pricing via Spot ETFs and Institutional Channels
Since April 2026, market attention has focused on:
Weekly net inflow strength: Some reports put net inflows for the week ending mid-April at roughly $996 million, noting this as one of the strongest single-week levels since mid-January 2026.
Sustained net inflows: Other reports highlight even larger cumulative net inflows over longer periods (about seven trading days), and remind readers that phrases like “new stage highs” often depend on statistical intervals and product definitions.
Product concentration: Leading products like IBIT are frequently cited as main contributors to net inflows, while newly listed or smaller ETFs may see inflows that are “modest in absolute terms but consistently positive.”
It’s important to note: ETF net inflows do not guarantee price appreciation. Their impact typically follows the path of “rising spot demand—adjustments in market-making and arbitrage chains—shifts in volatility and basis,” and may be offset by factors such as futures funding rates, options hedging, and stablecoin liquidity.
Price and Technical Levels: Interpreting Volatility Through Ranges
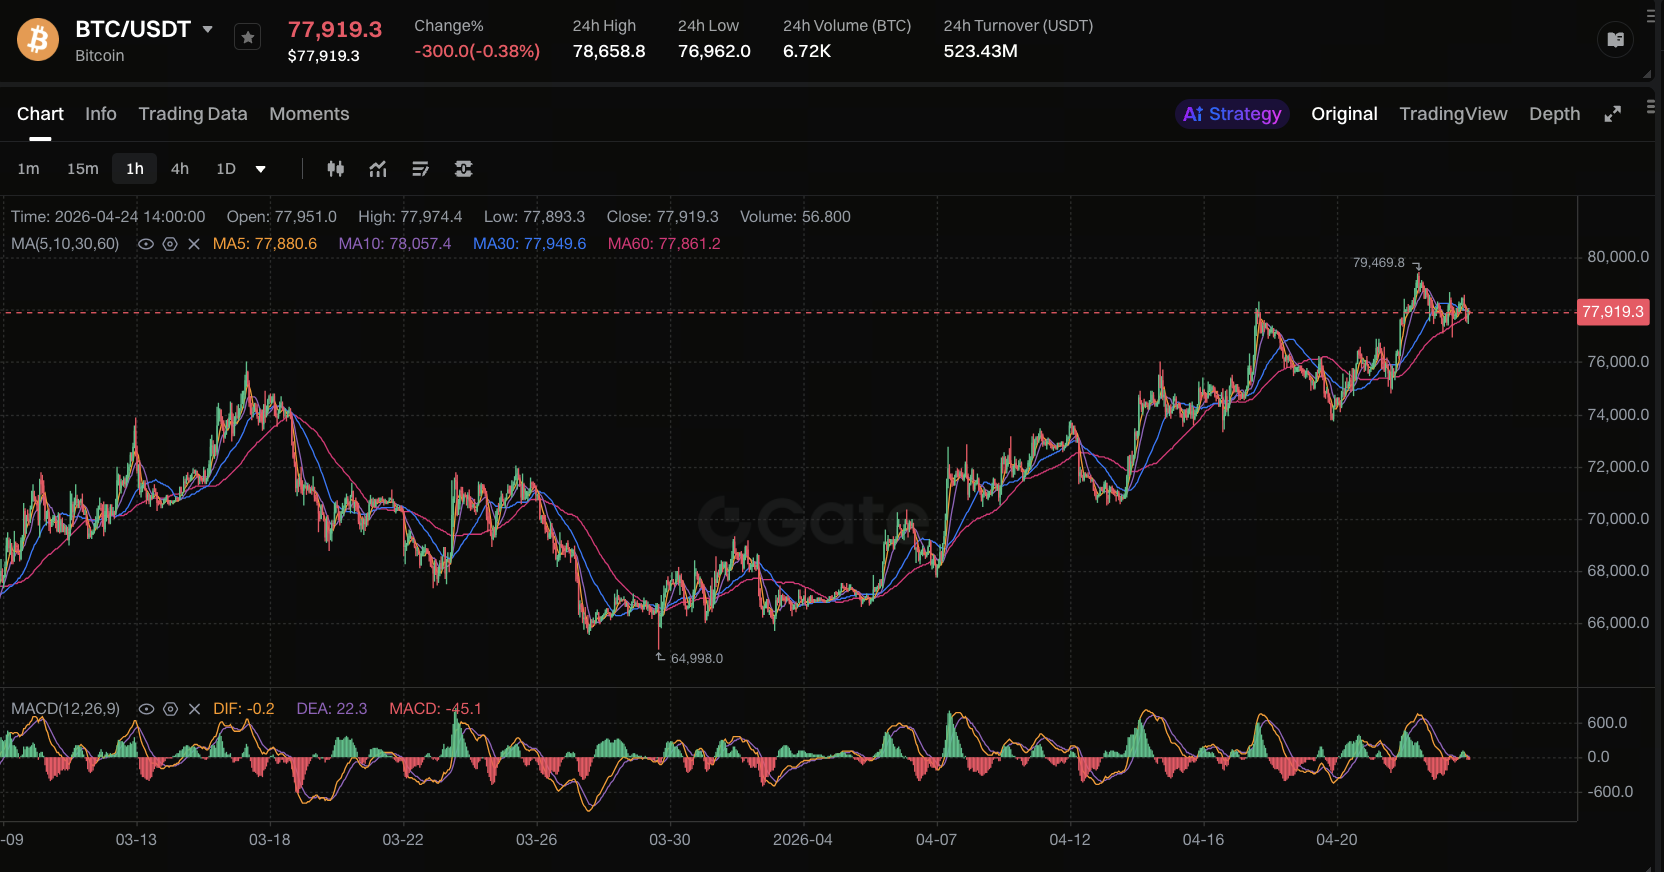
Source: Gate Market Page
In April 2026, multiple research firms describe BTC’s short-term trading range as roughly $70,000–$77,000, with the $76,000 area flagged as a key resistance and breakout test zone. Technical analysis provides valuable coordinates for crowded trades and stop-loss distributions, but its predictive power is inherently limited: the same technical level can yield very different breakout or false breakout outcomes depending on the macro backdrop.
Macro Variables: Interest Rate Trajectories and Risk Appetite
Bitcoin often correlates with risk assets like the Nasdaq, but this relationship is not always stable. Key macro drivers for Q2 include:
Fed policy expectations: Employment, inflation, and official commentary reshape the probability curve for rate cuts or hikes.
Dollar liquidity and credit conditions: Tighter financing environments tend to be less favorable for high-volatility assets.
Geopolitical and regulatory surprises: These often trigger sharp spikes in short-term crypto market volatility.
Macro analysis is best used to adjust scenario weightings, not as a daily price explainer.
III. Analytical Framework: Scenario Matrix vs. Single Path Forecasts
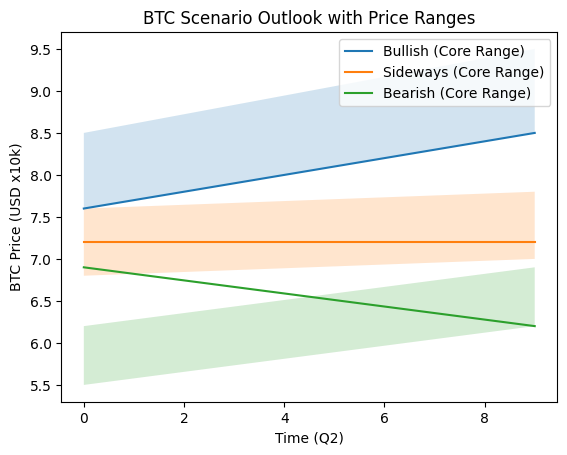
Three-Scenario Matrix Price Forecast
Bullish Scenario (Risk Asset Resonance + Sustained Fund Inflows)
Core assumption: Macro data does not significantly dampen risk appetite, ETF and institutional net inflows remain positive, and there are no major on-chain selling signals. In this scenario, the price center typically shifts up to $76,000–$85,000. If sustained volume breakouts occur alongside risk preference resonance, the short-term upside zone could reach $85,000–$95,000 (still event-driven and volatility-dependent, not suitable for linear extrapolation).
Potential market features:
BTC breaks through key resistance with volume and retests for confirmation.
Volatility indicators rebound from lows but don’t escalate into runaway spikes.
Stablecoin supply and related liquidity indicators do not exhibit a sustained contraction.
Key risks (invalidating signals): Macro black swan events driving risk premium spikes; regulatory enforcement news prompting liquidity withdrawal; extreme positive funding rates in derivatives markets followed by rapid deleveraging.
Range-Bound Scenario (Information Vacuum + Balanced Forces)
Core assumption: Macro is in a phase of “mixed data, policy path repeatedly repriced,” ETF inflows and price moves are not synchronized, and the market trades in a range. In this scenario, Q2 is likely to see broad oscillation between $68,000–$78,000: the upper boundary near $76,000–$78,000 as resistance, the lower boundary seeing repeated contests and false breakouts around $68,000–$72,000.
Potential market features:
Price repeatedly tests key support and resistance, with false breakouts becoming more frequent.
Filled amount and volatility trend lower, and the narrative shifts between “institutional buying” and “cycle consolidation.”
Altcoins and BTC diverge in relative strength, with structural opportunities favored over broad beta rallies.
In range-bound scenarios, research focus should shift from directional calls to volatility trading, position management, and event-driven strategies.
Bearish Scenario (Liquidity Tightening + Leverage Chain Clearing)
Core assumption: Rate expectations turn hawkish or credit conditions worsen, risk assets face broad selling pressure, and the crypto market sees excessive leverage, liquidation chain triggers, or large-scale sell-offs. In this scenario, prices are more likely to test the $62,000–$69,000 downside zone. If liquidity shocks and deleveraging chain reactions combine, the extreme tail could reach $55,000–$62,000 (tail scenarios are low probability, high volatility—focus should be on risk control and position management, not baseline forecasts).
Potential market features:
ETF net inflows slow or turn negative (distinguish redemption, arbitrage, and rebalancing technical factors).
Perpetual futures funding rates turn negative or swing sharply.
Prices fail to rebound after breaking below key support.
Note: The bearish scenario does not necessarily signal “the end of the long-term trend,” but rather describes a phase of pricing pressure within the Q2 window.
IV. Recommended Indicator Checklist
To minimize narrative bias, researchers should track the following indicators (roughly in order of priority):
US spot Bitcoin ETF daily/weekly net inflows: Ensure consistent definitions (whether ETH is included, whether internal conversions are excluded).
Fed rate path implied probabilities: Monitor dot plots, official statements, and market repricing after data releases.
Total stablecoin market cap and major stablecoin on-chain activity: Serves as a proxy for crypto market liquidity.
Exchange balances and large transfer tags: Identify potential selling pressure, but remember “depositing to exchange ≠ immediate sell-off.”
Funding rates, open interest (OI), and liquidation heatmaps: Assess leverage levels and short-term squeeze risk.
Implied volatility and option skew: Especially important for event windows around Q2’s end (macro data, quarterly settlements).
V. Sources of Information Bias and Data Verification Methods
With “latest news” highly fragmented, the most common research mistake is not misreading direction, but confusing correlation for causation. To improve research quality, explicitly list sources of information bias and conduct comparative verification:
Statistical definition differences: The same week’s “net inflow” may vary significantly depending on whether newly listed products are included, share conversions are excluded, or multi-asset ETFs are merged. Align product sets and time windows before comparing across media.
Survivor bias and headline amplification: Extreme inflow days often grab headlines, but continuity and tail distributions are equally important. Review both median levels and percentile ranges.
Misreading on-chain indicators: Exchange net inflows, long-term holder (LTH) supply changes, etc., require interpretation based on address tag quality, mixer interference, and seasonal factors. Avoid single-indicator conclusions.
Self-fulfilling and reverse harvesting of technical levels: Widely circulated key price levels can prompt short-term false breakouts and liquidity hunting. Validate technical conclusions with filled amount and derivatives structure.
Operational verification process:
Record the original data source (official disclosures, data vendors, media summaries).
Use two or more independent sources to cross-verify key figures.
Limit conclusions to “phenomena observed under a specific definition,” and clearly state uncertainties and counterexamples.
VI. Conclusion: Q2 Is Likely to See High Volatility and Directional Moves, Not Linear Extrapolation
Synthesizing recent public information, the most reasonable outlook for Bitcoin in Q2 2026 is: under the combined influence of ETF fund flows, technical key levels, and macro trajectories, the market is likely to experience range consolidation or directional breakouts amid high volatility. Any conclusion mapping short-term net inflows directly to “inevitable price increases” risks overlooking the nonlinear effects of derivatives hedging, arbitrage structures, and macro shocks.
Mid-Q2 through quarter-end typically features denser macro data releases and policy communication windows. When implied volatility is priced low and event uncertainty is high, prices are prone to rapid, one-way moves. Overlaying CME futures expiry, concentrated option strikes, and key macro events helps elevate “static price target judgments” into “range and tail risk assessments under event-driven conditions.”
Risk reminder: Crypto assets are highly volatile and may see sharp drawdowns and liquidity crunches. This article is for research and informational purposes only and does not constitute investment advice or any promise of returns.
* The information is not intended to be and does not constitute financial advice or any other recommendation of any sort offered or endorsed by Gate.
* This article may not be reproduced, transmitted or copied without referencing Gate. Contravention is an infringement of Copyright Act and may be subject to legal action.
Share
Content


