Understanding the Liquidation Heat Map: How Traders Use It to Spot Hidden Risk Zones
What Is a Liquidation Heat Map?
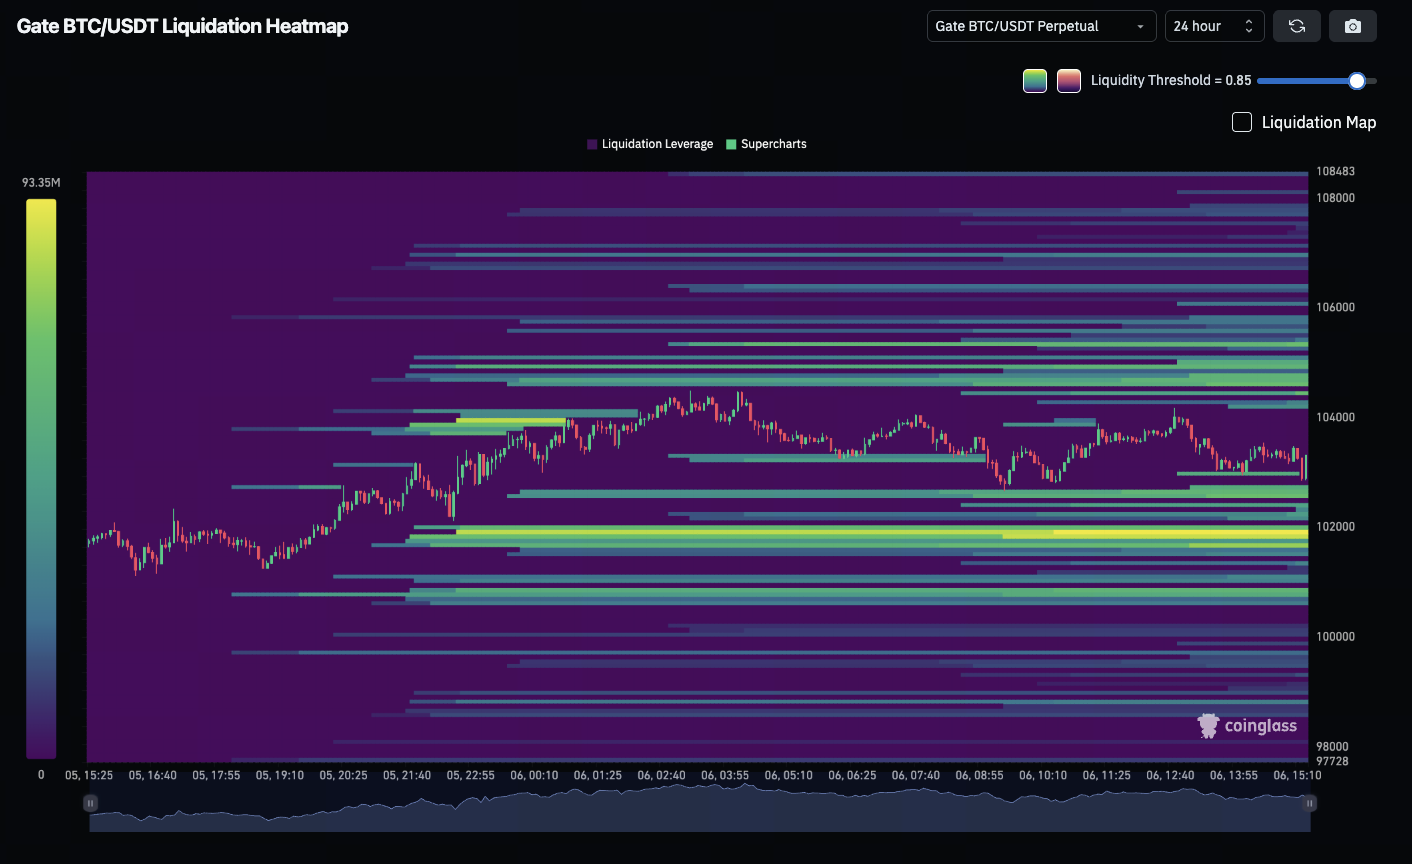
A liquidation heat map is a visual representation of potential liquidation zones in crypto futures markets. It shows where traders’ long or short positions are most vulnerable to forced closures when prices move sharply.
In simple terms:
Each color represents the “intensity” of liquidation risk.
The hotter (redder) the color, the more leveraged positions are likely to be liquidated around that price.
These maps are often provided by analytics platforms like Coinglass or Laevitas, and traders use them to identify “clusters” — price levels where large groups of traders might get wiped out if the market hits those points.
Why It Matters for Traders
The liquidation heat map is more than just colorful data — it’s a psychological snapshot of the market. It reveals where most traders are betting, and where the market could “hunt” those positions next.
Here’s why it’s crucial:
Identifying Risk Zones: When prices approach a dense cluster of liquidations, volatility often spikes. The market tends to “flush” those positions before stabilizing.
Predicting Price Reversals: A strong heat zone above the current price often signals trapped short positions. If prices break above it, a short squeeze may occur.Conversely, if a heavy liquidation cluster sits below, the risk of long liquidation grows.
Risk Management: By visualizing where the crowd is most exposed, traders can avoid opening positions in high-risk areas or adjust stop-loss levels accordingly.
For beginners, understanding these “hot zones” is the first step toward trading like professionals who always keep one eye on market sentiment.
Current Market Update: Where Are the Hot Zones?
As of early November 2025, the crypto market has seen another round of heavy liquidations following sudden volatility in Bitcoin (BTC) and Ethereum (ETH).
Bitcoin briefly dropped below the $118 000 mark, triggering over $1 billion in combined liquidations across futures exchanges.
Ethereum also saw a wave of forced closures as leveraged long positions were wiped out during a sharp 5 % correction.
Altcoins like Solana (SOL) and Dogecoin (DOGE) showed abnormal liquidation imbalances, signaling concentrated leveraged bets that were rapidly unwound.
These events illustrate a key takeaway: liquidation heat maps often “light up” right before big market moves.By checking the heat map regularly, traders can visually spot where the next major flush might occur — and position themselves safely.
How to Read the Heat Map Step by Step
For beginners, here’s a simple guide to reading liquidation heat maps:
Choose a Time Frame: Start with a 12-hour or 24-hour view. Shorter intervals (like 5 min or 1 h) may show too much noise.
Identify the Color Zones: Red/Orange areas: High liquidation potential — many open positions are clustered here.Green/Yellow areas: Moderate risk.Blue/Gray: Low liquidation density.
Compare With Current Price: See whether the current market price is near a “hot” zone.If it’s below a large red cluster, short squeezes may occur if price rises into it. If it’s above a red cluster, a long squeeze could happen if price drops into that level.
Look for Symmetry or Imbalance: Sometimes, one side (longs or shorts) dominates. When you see one-sided buildup, it’s often a precursor to a liquidation event in that direction.
Combine With Technical Analysis: Liquidation heat maps don’t show why the price will move — they just show where pressure is built up. Combine them with key support/resistance levels, moving averages, and volume spikes for confirmation.
Common Mistakes Beginners Make
Even though liquidation heat maps are powerful, new traders often misinterpret them. Avoid these common errors:
Using Heat Maps as Trading Signals Alone: The heat map is not a crystal ball. It indicates risk, not guaranteed movement. Many traders lose money by blindly shorting near hot zones or chasing liquidations without context.
Ignoring Time Sensitivity: Liquidation clusters can shift quickly as new positions are opened or closed. What was a “hot zone” yesterday may be irrelevant today. Always check the latest data before acting.
Overleveraging: Ironically, the same traders who use liquidation maps to avoid liquidations often end up overleveraging — a self-defeating cycle. Keep leverage low and manage risk first.
Not Understanding the Crowd Effect: When everyone sees the same hot zone, liquidity providers and institutions may intentionally drive price through it to trigger forced liquidations and grab liquidity. That’s why it’s important to plan exits and not panic.
Practical Example
Imagine Bitcoin trading at $118 000. The liquidation heat map shows a huge red cluster at $117 000. This means a large number of long positions are likely to be liquidated if price dips below that level.
If you’re holding a long position, you might:
Reduce exposure before $117 000.
Move your stop loss just above $117 000 to avoid being “swept.”
If you’re flat or planning a short entry, you might:
Wait for the flush below $117 000 to complete.
Look for a reversal signal once liquidations clear out.
This simple adjustment — guided by the heat map — can save you from being caught in a cascading liquidation event.
Final Thoughts
The liquidation heat map is one of the most insightful yet underused tools in modern crypto trading. It gives you a real-time visual of where leverage is concentrated and where volatility might erupt next.
To recap:
Hot colors mark risk zones where forced liquidations are likely.
Price proximity to those zones determines short-term volatility potential.
Smart traders use the map not to predict but to prepare — adjusting stops, leverage, and entry timing.
For beginners, it’s a fantastic way to learn market psychology and improve timing.Before opening any leveraged trade, take 30 seconds to glance at the heat map — it might show you where others are about to get wiped out.
In fast-moving markets, knowledge of liquidation zones can mean the difference between being liquidated or surviving the storm.
Disclaimer:
This is not investment advice. This information is provided for informational purposes only and should not be construed as a recommendation to buy, sell, or hold any asset. Cryptocurrency trading involves a risk of loss. Gate US services may be restricted in certain jurisdictions. For more information, please see our legal disclosures: https://us.gate.com/legal/disclosures
Share
Content


Related Articles

Bitcoin Halving Chart: Key Dates, Trends, and Future Predictions

Bitcoin Halving Chart:Understanding the Changes in Bitcoin Supply and Price Trends

US December Rate Cut Forecast: Will the Federal Reserve Finally Pivot?

Midnight Network Ignites Cardano’s Next Chapter with NIGHT Token Mining and Privacy Innovation

DeFi TVL Hits $237 Billion: What the 2025 Surge Means for Crypto Investor
