BTC Dominance Chart Explained: Why Bitcoin Still Leads the Crypto Market
What Is the BTC Dominance Chart?
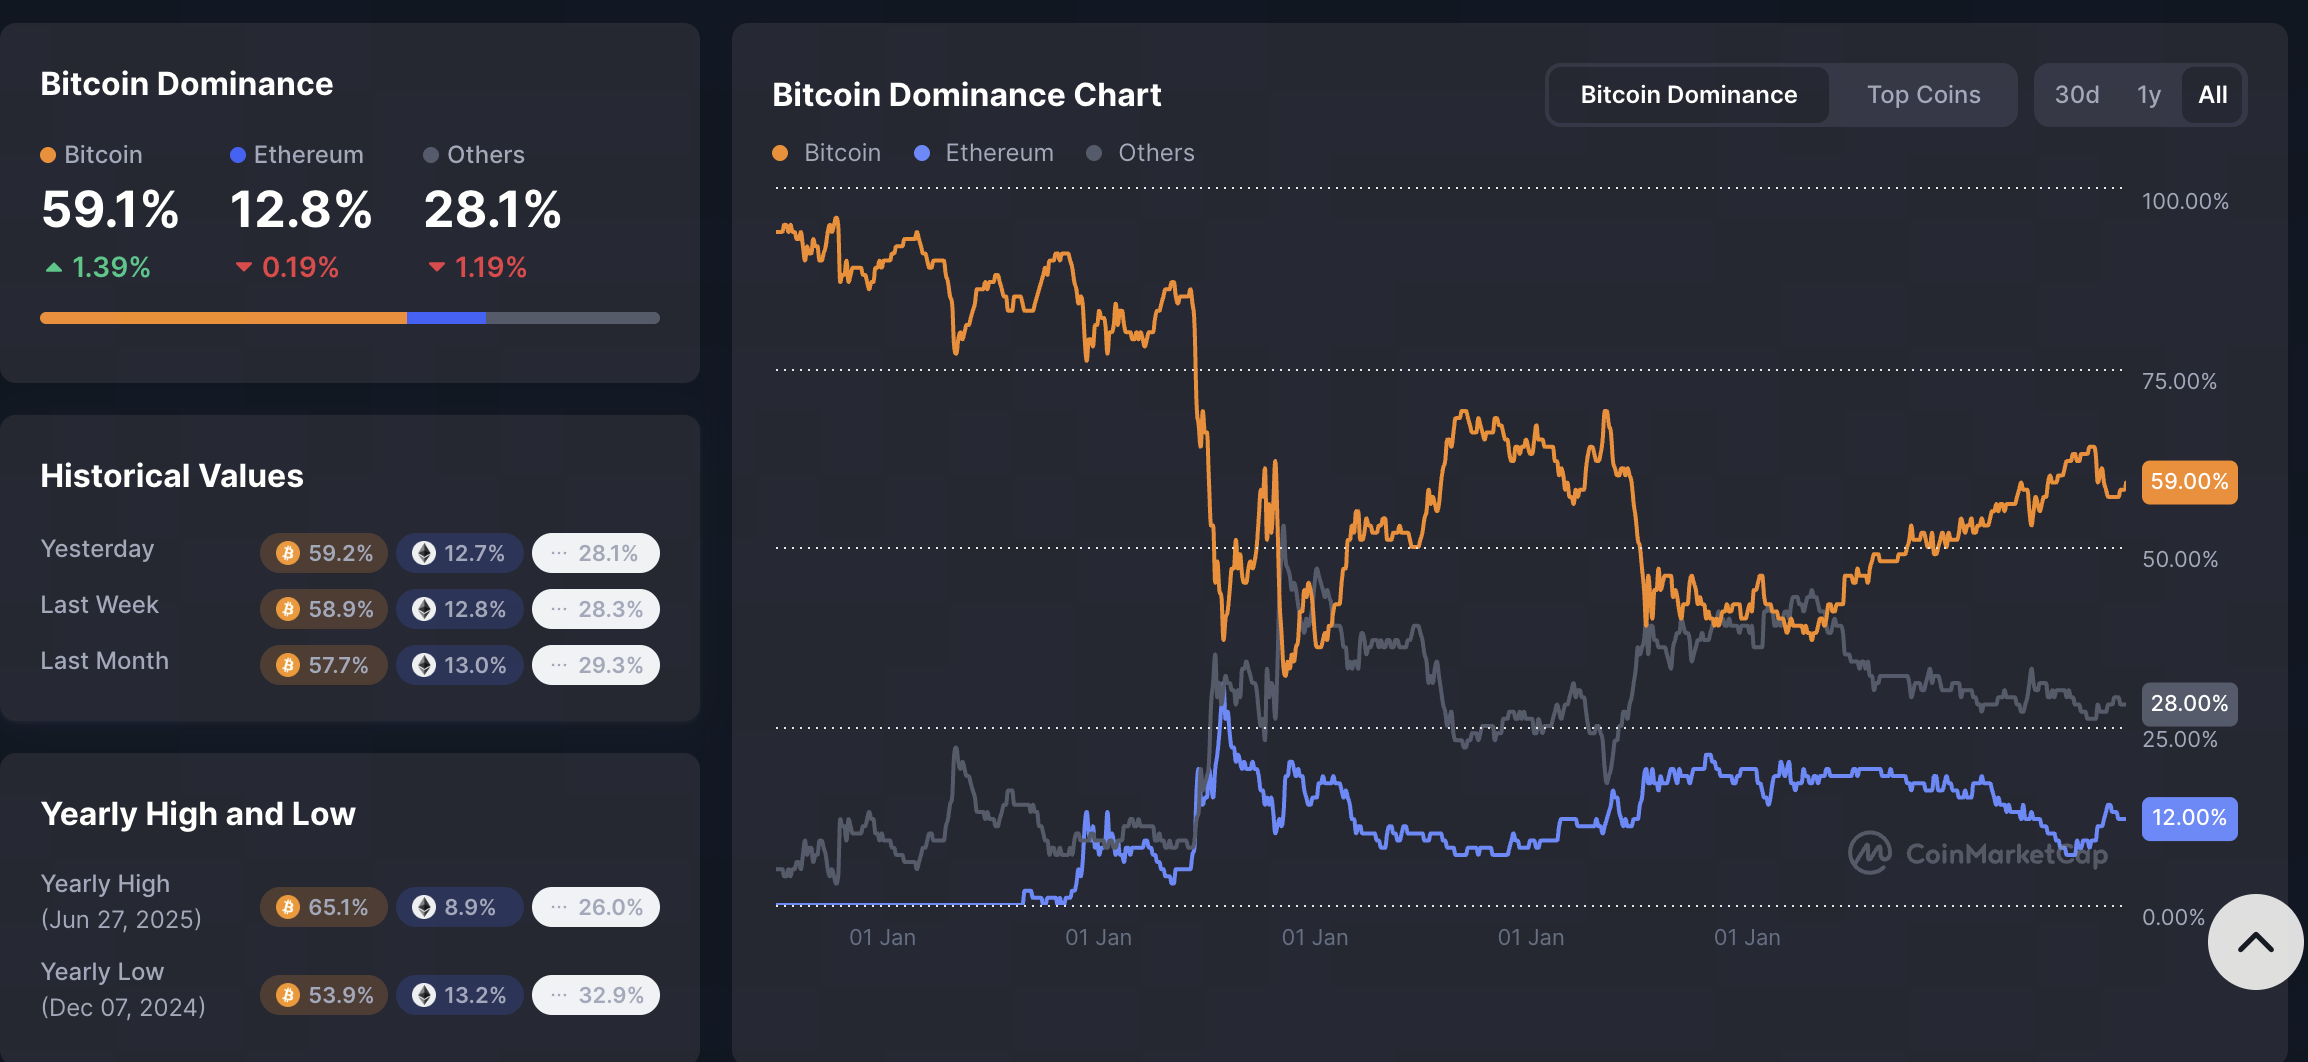
图:https://coinmarketcap.com/charts/bitcoin-dominance/
The BTC Dominance Chart measures Bitcoin’s percentage share of the total cryptocurrency market capitalization. In simple terms, it shows how much of the entire crypto market’s value is held in Bitcoin. When BTC dominance rises, it typically means investors are moving funds back into Bitcoin — often seeking safety during uncertain or volatile times.
Why Bitcoin’s Market Share Still Matters
Even with the rise of thousands of altcoins and new blockchain ecosystems, Bitcoin remains the benchmark of the entire crypto market. Its dominance reflects trust, liquidity, and institutional adoption. When BTC dominance exceeds 55%, it usually signals a period of consolidation for the broader market, suggesting that risk appetite is low and investors prefer the relative safety of Bitcoin.
The Relationship Between BTC Dominance and Altcoins
Historically, Bitcoin dominance and altcoin performance move in opposite directions. When BTC dominance falls, altcoins often experience significant rallies — known as “alt seasons.” Conversely, when dominance rises sharply, it often leads to capital outflows from altcoins into Bitcoin. Traders and analysts monitor this chart to identify potential rotation opportunities between BTC and other crypto assets.
2025 Trends: Institutional Demand and ETF Impact
In 2025, Bitcoin dominance hovers around 54%, influenced by the sustained inflow of institutional capital through spot Bitcoin ETFs and treasury allocations by public companies. This renewed institutional trust in Bitcoin has created a stabilizing force in the market, contrasting with the volatility seen in smaller-cap tokens. Additionally, macroeconomic uncertainty — including fluctuating interest rates and geopolitical risk — has reinforced Bitcoin’s role as a digital store of value.
How to Use BTC Dominance in Your Investment Strategy
For traders, the BTC Dominance Chart can be a useful signal.
Rising dominance: Consider reducing exposure to altcoins or focusing on Bitcoin-led assets.
Falling dominance: Indicates increasing risk appetite, often a good time to research high-quality altcoin projects.
However, this indicator should be used alongside other metrics such as total market capitalization, trading volume, and stablecoin flows for a complete picture.
Conclusion: Reading Between the Lines of Market Sentiment
The BTC Dominance Chart remains one of the most valuable tools for gauging the pulse of the crypto market. As 2025 unfolds, Bitcoin continues to assert its leadership through resilience, liquidity, and growing institutional adoption. For both beginners and seasoned investors, keeping an eye on BTC dominance can help anticipate market cycles and manage risk effectively.
Disclaimer:
This is not investment advice. This information is provided for informational purposes only and should not be construed as a recommendation to buy, sell, or hold any asset. Cryptocurrency trading involves a risk of loss. Gate US services may be restricted in certain jurisdictions. For more information, please see our legal disclosures: https://us.gate.com/legal/disclosures
Share
Content


Related Articles

Bitcoin Halving Chart: Key Dates, Trends, and Future Predictions

Bitcoin Halving Chart:Understanding the Changes in Bitcoin Supply and Price Trends

US December Rate Cut Forecast: Will the Federal Reserve Finally Pivot?

Midnight Network Ignites Cardano’s Next Chapter with NIGHT Token Mining and Privacy Innovation

DeFi TVL Hits $237 Billion: What the 2025 Surge Means for Crypto Investor
