2025 XLM Fiyat Tahmini: Olgunlaşan Kripto Ekosisteminde Stellar Lumens’in Potansiyel Büyüme Yolu

Giriş: XLM’in Piyasa Konumu ve Yatırım Değeri
Stellar (XLM), sınır ötesi ödemeler ve varlık tokenizasyonu için önde gelen bir blokzincir platformu olarak, 2014’teki kuruluşundan bu yana önemli başarılar elde etti. 2025 yılı itibarıyla Stellar’ın piyasa değeri 12,14 milyar dolara yükselmiş, dolaşımdaki arzı yaklaşık 31,74 milyar adet ve fiyatı 0,38 dolar seviyesinde seyretmiştir. Sıklıkla “geleneksel finans ile kripto paralar arasındaki köprü” olarak anılan bu dijital varlık, hızlı ve düşük maliyetli uluslararası işlemleri kolaylaştırmada giderek daha kritik bir rol üstleniyor.
Bu makalede, Stellar’ın 2025–2030 dönemi fiyat eğilimleri; tarihsel desenler, piyasa arz-talep dengesi, ekosistem gelişimi ve makroekonomik değişkenler ışığında profesyonel fiyat öngörüleri ve yatırımcılara yönelik pratik stratejilerle kapsamlı biçimde analiz edilecektir.
I. XLM Fiyat Geçmişi ve Güncel Piyasa Durumu
XLM Tarihsel Fiyat Gelişimi
- 2014: Stellar (XLM) piyasaya sürüldü, ilk fiyatı yaklaşık 0,002 dolar oldu
- 2018: Boğa piyasası zirvesinde, XLM 3 Ocak’ta tüm zamanların zirvesi olan 0,875563 dolara ulaştı
- 2020: Piyasa toparlanırken, XLM fiyatı 0,05–0,20 dolar aralığında dalgalandı
- 2021: Büyüme ivmesiyle, XLM fiyatı Mayıs ayında 0,70 doları geçti
XLM Mevcut Piyasa Durumu
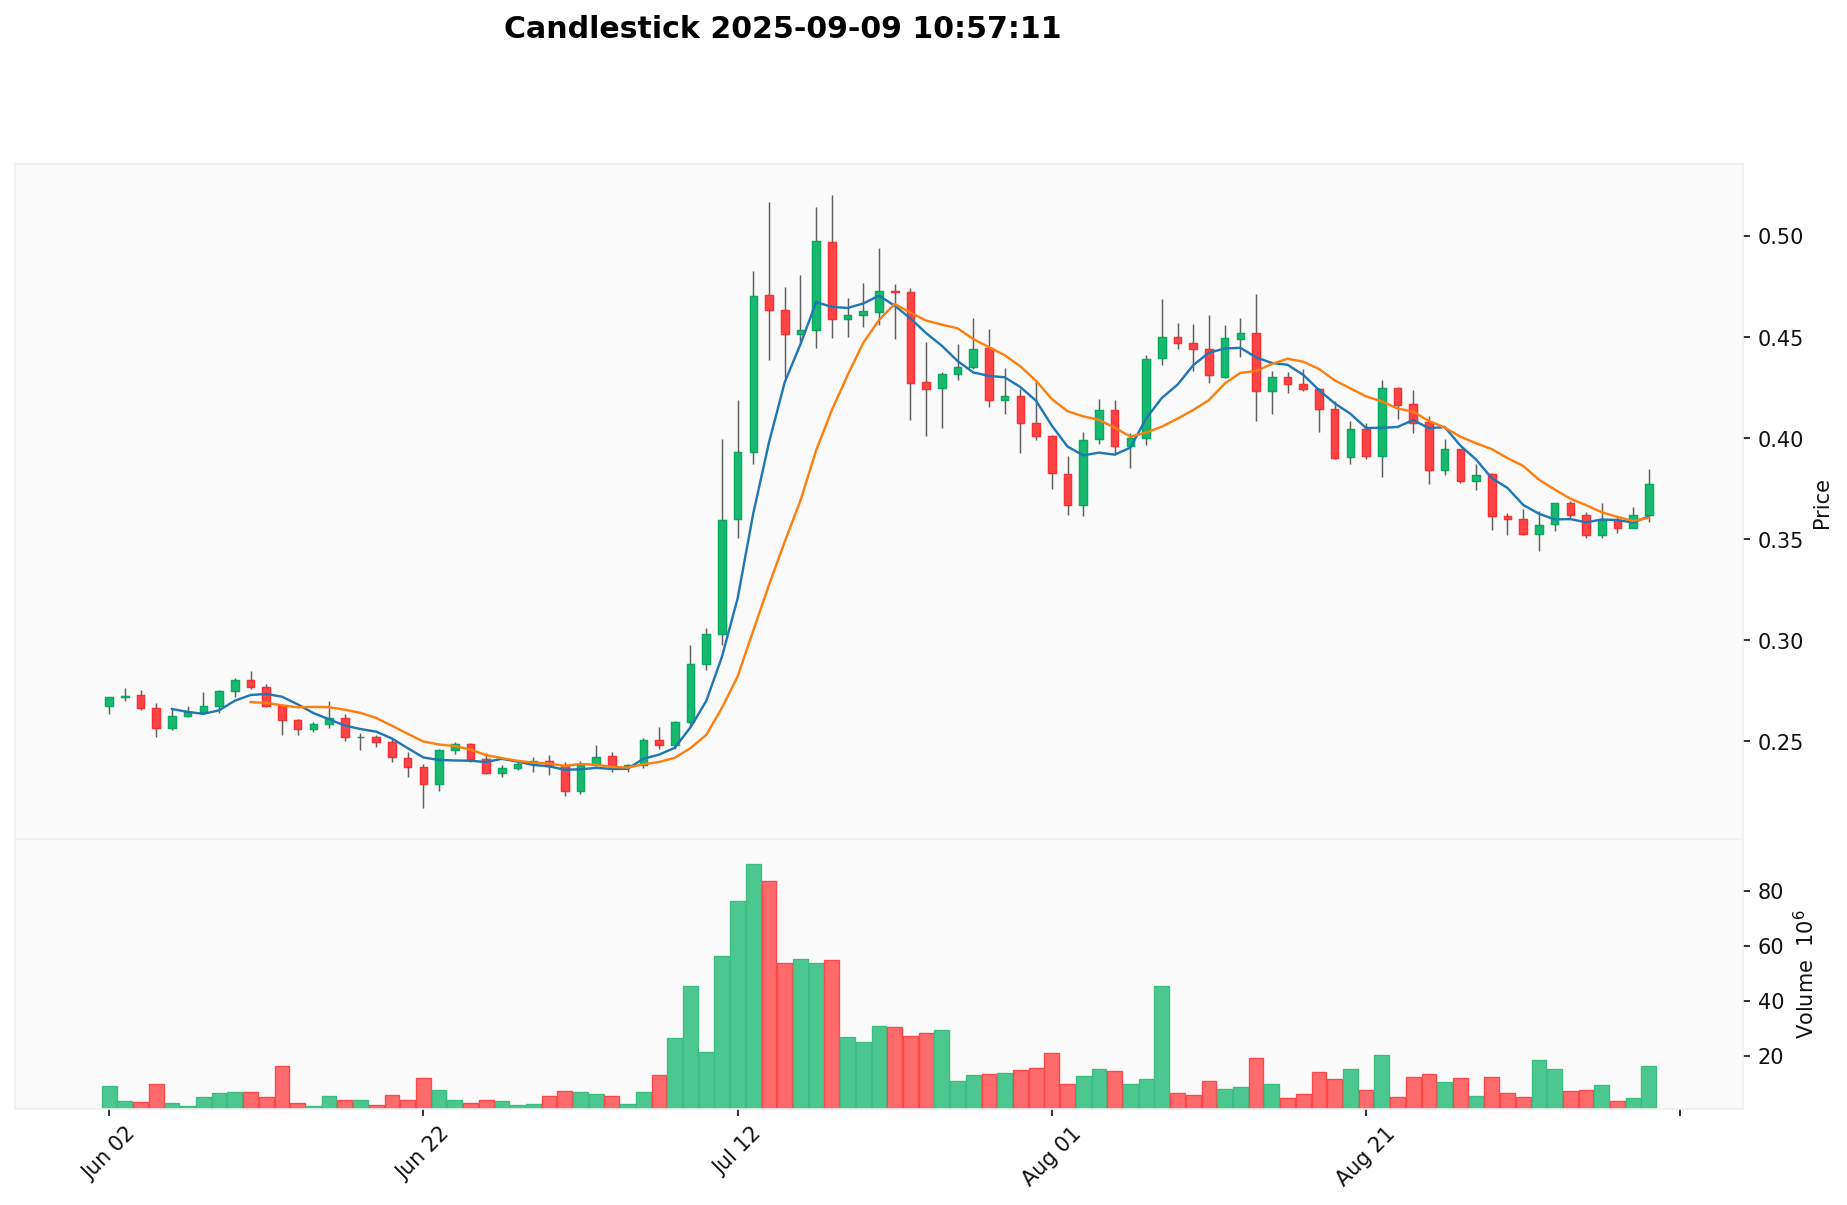
9 Eylül 2025 tarihi itibarıyla XLM, 0,38239 dolar seviyesinden işlem görüyor. Piyasa değeri ise 12.135.525.812 dolar olup, küresel kripto para sıralamasında 19. sırada yer alıyor. Kısa vadede güçlü bir ivmeyle, son 24 saatte %3,16 ve son bir haftada %5,029 oranında değer kazandı. Ancak son 30 günde %13,19'luk bir düşüş yaşandı. Uzun vadeli performansa bakıldığında ise, yıllık bazda %324,71'lik ciddi bir artış görülüyor.
Mevcut fiyat, XLM’in tüm zamanların en yüksek seviyesi olan 0,875563 doların oldukça altında seyretmekte ve ilerisi için büyüme fırsatı bulunduğuna işaret etmektedir. Son 24 saatlik işlem hacmi 6.816.586 dolar seviyesinde olup; piyasa hareketliliğinin orta düzeyde seyrettiği görülüyor. 31.735.991.558 XLM dolaşımda ve toplam arz 50.001.786.892 ile dolaşım oranı %63,47’dir.
Güncel XLM piyasa fiyatını görmek için tıklayın
XLM Piyasa Duyarlılık Endeksi
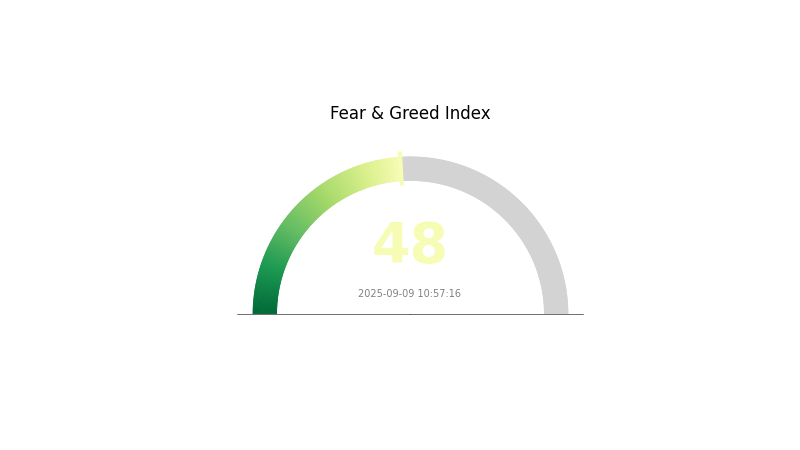
09 Eylül 2025 Korku ve Açgözlülük Endeksi: 48 (Nötr)
Güncel Korku & Açgözlülük Endeksi’ni görmek için tıklayın
XLM’in kripto piyasasındaki duyarlılığı “nötr” olup, Korku ve Açgözlülük Endeksi 48 seviyesindedir. Bu dengeli görünüm, yatırımcılarda ne aşırı korku ne de aşırı açgözlülük olduğunu gösterir. Temkinlik devam etmekle birlikte, piyasada ılımlı bir iyimserlik var. Yatırımcılar ve trader’lar, piyasa riskleri karşısında uyanık olmalı ve portföy çeşitlendirmesini mutlaka değerlendirmelidir. Her yatırım kararı öncesi derinlemesine araştırma yapmak ve riskleri dikkatli şekilde yönetmek büyük önem taşır.
XLM Varlık Dağılımı
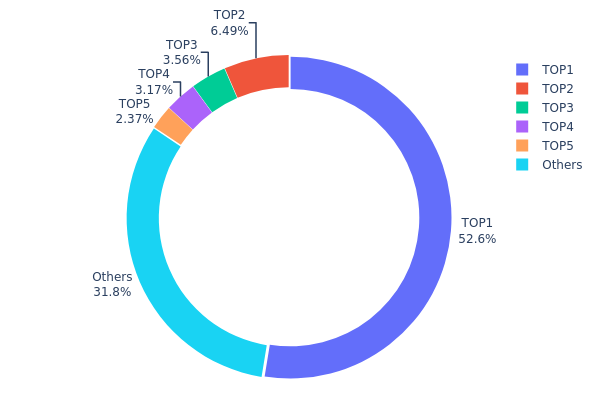
XLM adreslerindeki varlık dağılımı, oldukça yoğunlaşmış ve merkezileşmiş bir sahiplik yapısı sergiliyor. En üstteki adres toplam arzın %52,57’sini kontrol ediyor ve bu da yüksek bir merkezileşmeye işaret ediyor. Onu izleyen dört adres ise her biri %2,37–%6,49 arasında paya sahip olup; toplamda arzın %15,59’unu ellerinde bulunduruyor. Kalan %31,84’lük kısım ise diğer tüm adresler arasında dağılıyor.
Böyle bir yoğunlaşma, XLM’in merkeziyetsizlik derecesi ve piyasa istikrarı açısından risk oluşturur. Arzın yarısından fazlasının tek bir varlık tarafından kontrol edilmesi, piyasa manipülasyonu ve dalgalanma potansiyelini yükseltir. En büyük sahip, büyük ölçekli alım-satımlar ile fiyatlar üzerinde ciddi etki kurabilir. Ayrıca, bu merkezileşme ağın yönetişimi ve stratejik karar alma süreçlerini zayıflatabilir ve projenin uzun vadeli gelişimini olumsuz etkileyebilir.
Birçok kripto projede belli oranda merkezileşme bulunsa da, XLM’in bu düzeydeki asimetrik dağılımı, piyasa dayanıklılığı ve sistemik risklerin azaltılması için daha fazla çeşitliliğe ihtiyaç olduğunu gösteriyor. Yatırımcıların ve ekosistem paydaşlarının bu dağılımda yaşanacak değişiklikleri yakından izlemesi; çünkü bu değişimlerin XLM piyasası ve ekosistemi üzerinde önemli etkileri olabilir.
Güncel XLM Varlık Dağılımını görüntülemek için tıklayın
| Üst | Adres | Miktar | Yüzde |
|---|---|---|---|
| 1 | GALAXY...ZILUTO | 554.421.152,01K | 52,57% |
| 2 | GDUY7J...LDERI4 | 68.461.825,43K | 6,49% |
| 3 | GDKIJJ...CCWNMX | 37.565.991,80K | 3,56% |
| 4 | GBFZPA...ZJJFNP | 33.459.507,10K | 3,17% |
| 5 | GB6NVE...4MY4AQ | 25.008.201,71K | 2,37% |
| - | Diğerleri | 335.522.342,82K | 31,84% |
II. XLM’in Gelecekteki Fiyatını Etkileyen Temel Faktörler
Arz Mekanizması
- Güncel Arz: Toplam XLM arzı 50.001.786.886,69552 iken, 31.735.991.411,799892 adedi dolaşımdadır.
- Tarihsel Desen: XLM, zaman içinde kademeli büyüme sergilemiş, piyasa rallilerinde belirgin fiyat artışları yaşamıştır.
- Güncel Etki: XLM’in sabit arz limiti, talep yükseldiğinde fiyat değerlenmesini destekleyebilir.
Kurumsal ve Büyük Yatırımcı Dinamikleri
- Kurumsal Varlıklar: Çok sayıda finansal kurum, sınır ötesi ödemeler için Stellar teknolojisini değerlendiriyor ya da uygulamaya alıyor.
- Kurumsal Benimsenme: Stellar, hızlı ve düşük maliyetli sınır ötesi işlemler nedeniyle çeşitli şirketler tarafından tercih ediliyor.
- Devlet Politikaları: Kripto para düzenlemelerinde yaşanan yasal değişiklikler ve devlet yaklaşımları, XLM’in piyasa performansını önemli ölçüde etkileyebiliyor.
Makroekonomik Çevre
- Parasal Politika Etkisi: Başta büyük ekonomiler olmak üzere merkez bankalarının politikaları, XLM dahil tüm kripto piyasasında dalgalanmalara yol açabilir.
- Enflasyona Karşı Koruma: Enflasyonist dönemlerde, XLM tıpkı diğer kripto paralar gibi bir değer saklama aracı olarak öne çıkabilir.
- Jeopolitik Faktörler: Küresel belirsizlikler ve siyasi gerilimler, yatırımcıların kripto paralara yönelmesine ve bu yolla XLM’in fayda sağlamasına neden olabilir.
Teknolojik Gelişmeler ve Ekosistem Gelişimi
- Stellar Consensus Protocol: Stellar’ın konsensüs mekanizmasında yapılan sürekli iyileştirmeler, ağ ölçeklenebilirliğini ve verimliliğini artırıyor.
- Akıllı Sözleşme Potansiyeli: Stellar’da akıllı sözleşme işlevlerinin geliştirilmesi, platformun kullanım alanını büyüterek daha fazla geliştiricinin ilgisini çekebilir.
- Ekosistem Uygulamaları: Stellar üzerinde geliştirilen merkeziyetsiz uygulamalar (DApp) ve projelerin büyümesi, XLM’in kullanım değerini ve talebini artırır.
III. 2025–2030 Dönemi İçin XLM Fiyat Tahminleri
2025 Öngörüsü
- Ihtiyatlı tahmin: 0,22543 – 0,34000 dolar
- Nötr tahmin: 0,34000 – 0,42000 dolar
- İyimser tahmin: 0,42000 – 0,47378 dolar (pozitif piyasa duyarlılığı ve artan benimsenme gerektirir)
2027–2028 Öngörüsü
- Piyasa fazı: Konsolidasyon sonrası kademeli büyüme potansiyeli
- Fiyat aralığı öngörüsü:
- 2027: 0,37196 – 0,48082 dolar
- 2028: 0,29902 – 0,59803 dolar
- Temel katalizörler: Stellar ağındaki teknolojik ilerlemeler, yeni ortaklıklar ve artan kullanım örnekleri
2030 Uzun Vadeli Öngörü
- Temel senaryo: 0,50000 – 0,60000 dolar (istikrarlı büyüme ve benimsenme ile)
- İyimser senaryo: 0,60000 – 0,70503 dolar (yaygın benimsenme ve olumlu piyasa koşulları ile)
- Dönüştürücü senaryo: 0,70503 – 0,80000 dolar (kripto piyasasında ve Stellar ekosisteminde aşırı iyimser gelişmeler halinde)
- 31 Aralık 2030: XLM 0,5779 dolar (ortalama öngörü, piyasa dalgalanmalarına bağlı olarak değişebilir)
| Yıl | Tahmini En Yüksek Fiyat | Tahmini Ortalama Fiyat | Tahmini En Düşük Fiyat | Değişim (%) |
|---|---|---|---|---|
| 2025 | 0,47378 | 0,38208 | 0,22543 | 0 |
| 2026 | 0,47928 | 0,42793 | 0,34662 | 11 |
| 2027 | 0,48082 | 0,45361 | 0,37196 | 18 |
| 2028 | 0,59803 | 0,46721 | 0,29902 | 22 |
| 2029 | 0,62317 | 0,53262 | 0,35686 | 39 |
| 2030 | 0,70503 | 0,5779 | 0,31784 | 51 |
IV. XLM için Profesyonel Yatırım Stratejileri ve Risk Yönetimi
XLM Yatırım Metodolojisi
(1) Uzun Vadeli Tutma Stratejisi
- Uygun profil: Yüksek risk toleransına sahip uzun vadeli yatırımcılar
- Öneriler:
- Piyasa düşüşlerinde XLM biriktirin
- Fiyat hedefleri belirleyerek portföyünüzü düzenli olarak yeniden dengeleyin
- XLM varlıklarınızı güvenli bir donanım cüzdanında ya da itibarlı bir saklama hizmetinde muhafaza edin
(2) Aktif Alım-Satım Stratejisi
- Teknik analiz araçları:
- Hareketli Ortalamalar: Trend belirleme ve giriş/çıkış zamanlamasında kullanılır
- Göreceli Güç Endeksi (RSI): Aşırı alım-aşırı satım durumunu saptamada yardımcıdır
- Swing trade için önemli noktalar:
- XLM’in Bitcoin ile korelasyonunu ve genel piyasa duyarlılığını izleyin
- Risk yönetimi için mutlaka stop-loss emirleri koyun
XLM Risk Yönetim Çerçevesi
(1) Varlık Dağıtım İlkeleri
- Temkinli yatırımcı: Portföyün %1–3’ü
- Saldırgan yatırımcı: Portföyün %5–10’u
- Profesyonel yatırımcı: Portföyün %15’ine kadar
(2) Riskten Korunma Seçenekleri
- Çeşitlendirme: Birden fazla kripto para ve geleneksel varlığa yayılan portföy oluşturun
- Stop-loss emirleri: Olası kayıpları sınırlamak için kesinlikle uygulanmalı
(3) Güvenli Saklama Yöntemleri
- Donanım cüzdanı önerisi: Gate Web3 Wallet tercih edilebilir
- Soğuk depolama: Uzun vadeli tutum için kağıt cüzdan kullanın
- Güvenlik: İki faktörlü kimlik doğrulama kullanın, özel anahtarlarınızı paylaşmayın
V. XLM’e Yönelik Potansiyel Riskler ve Zorluklar
XLM Piyasa Riskleri
- Fiyat dalgalanması: XLM, önemli volatilite gösterebilir
- Rekabet: Diğer blokzincir projeleri, Stellar’ı benimsenme ya da teknolojide geçebilir
- Piyasa duyarlılığı: Olumsuz haber akışı XLM fiyatlarını etkileyebilir
XLM Düzenleyici Riskler
- Belirsiz regülasyonlar: Kripto para yasalarındaki değişiklikler XLM’in kullanımını ve değerini etkileyebilir
- Sınır ötesi düzenlemeler: Uluslararası kısıtlamalar Stellar’ın küresel piyasada yayılımını sınırlandırabilir
- Uyum sorunları: Sürekli değişen KYC/AML gerekliliklerine uyum sağlamakta zorluk yaşanabilir
XLM Teknik Riskleri
- Ağ güvenliği: Stellar ağında açıklar oluşabilir
- Ölçeklenebilirlik sınırları: Gelecekteki büyüme, ağ kapasitesini zorlayabilir
- Akıllı sözleşme kısıtları: Rakiplerine göre Stellar’ın akıllı sözleşme olanakları daha sınırlı
VI. Sonuç ve Eylem Önerileri
XLM Yatırım Değeri Değerlendirmesi
XLM, sınır ötesi ödeme çözümleri ve varlık tokenizasyonunda uzun vadeli potansiyel sunar; ancak kısa vadeli dalgalanma ve regülasyon belirsizlikleri barındırır. Güçlü bir değer önerisi taşımakla birlikte, yatırımcılar dalgalı seyirlere karşı hazırlıklı olmalıdır.
XLM Yatırım Tavsiyeleri
✅ Yeni başlayanlar: Piyasayı anlamak için küçük ve düzenli alımlarla başlayın ✅ Deneyimli yatırımcılar: Uzun vade tutma ve aktif alım-satım stratejilerini birleştirin ✅ Kurumsal yatırımcılar: Stellar ile blokzincir entegrasyon projelerinde işbirliği fırsatlarını araştırın
XLM İşlem Katılım Yöntemleri
- Spot alım-satım: Gate.com üzerinden XLM alıp satın
- Staking: Pasif gelir için XLM staking programlarına katılın
- DeFi: Stellar tabanlı merkeziyetsiz finans uygulamalarını keşfedin
Kripto para yatırımları yüksek risk içerir, bu içerik yatırım tavsiyesi değildir. Kendi risk toleransınızı dikkate alın ve yatırım kararı öncesi mutlaka profesyonel danışmanlardan destek alın. Asla kaybetmeyi göze alabileceğinizden fazla yatırım yapmayın.
SSS
XLM 2025’te ne kadar yükselebilir?
Dalga teorisi analizine göre, XLM 2025 sonunda 0,144 – 0,315 dolar aralığına ulaşabilir.
XLM 10 dolara ulaşabilir mi?
XLM’in 10 dolara ulaşma potansiyeli mevcut. Piyasa eğilimleri ve öngörüler, uzun vadede bunun da ötesine geçip 40–50 dolar seviyelerini görebileceğini göstermektedir.
XLM 5 doları görebilir mi?
Mevcut piyasa trendleri ve büyüme potansiyeline bakılırsa, XLM’in 2027’ye kadar 5 dolara ulaşması beklenebilir. Ancak token arzı, fiyat artışını sınırlayan bir faktör olmuştur.
XLM gerçekçi olarak ne kadar yükselebilir?
Piyasa öngörülerine ve benimsenme trendlerine göre, XLM gerçekçi olarak 2025’te 1,41 dolara, 2030’da 4,25 dolara ve 2040’ta 233,82 dolara ulaşabilir.
Share
Content
Giriş: XLM’in Piyasa Konumu ve Yatırım Değeri
I. XLM Fiyat Geçmişi ve Güncel Piyasa Durumu
II. XLM’in Gelecekteki Fiyatını Etkileyen Temel Faktörler
III. 2025–2030 Dönemi İçin XLM Fiyat Tahminleri
IV. XLM için Profesyonel Yatırım Stratejileri ve Risk Yönetimi
V. XLM’e Yönelik Potansiyel Riskler ve Zorluklar
VI. Sonuç ve Eylem Önerileri
SSS
How to Buy Cryptocurrency


Trending Cryptocurrencies


2025 DGB Fiyat Tahmini: DigiByte Kripto Para Piyasasında Yeni Zirvelere Ulaşabilir mi?

2025 SOUL Fiyat Tahmini: Dijital Varlık İçin Piyasa Trendleri ve Gelecek Perspektiflerinin Analizi
2025 NANO Fiyat Tahmini: Dijital Para Biriminin Büyüme Potansiyeli ve Piyasa Trendlerinin Analizi
2025 QANX Fiyat Tahmini: Piyasa Trendleri ve Olası Büyüme Faktörlerinin Analizi
2025 DKA Fiyat Tahmini: Piyasa Eğilimleri ve Olası Büyüme Faktörlerinin Analizi

2025 BLY Fiyat Tahmini: Bluey Token’ın Piyasa Trendleri ve Olası Büyüme Faktörlerinin Analizi

Blockchain Oracle’ı Anlamak: Kapsamlı Bir Rehber

Nostr'a Yakından Bakış: Merkeziyetsiz Sosyal Medyanın Geleceği

BEP-20 Token Standardı: Temel Özellikleri ve Avantajları

Tap Crypto’yu Anlamak: Dijital Takas Üzerine Kapsamlı Bir Rehber
ENS Alan Adları: Web3’te Kimlik Yönetimini Kolaylaştırıyor