What Is Technical Analysis?

Last Updated 2026-03-04 06:35:45
Learn from the past - To explore the law of price movements and the market trends in the ever-changing market.

Technical analysis is an analytical method to forecast future trends and changes by reviewing past price trends and trading data, looking for the law of price changes in the trading market. Compared with fundamental analysis that evaluates market prices from multiple facets, technical analysis is simpler as it focuses on price action and various indicators calculated from extensive transaction data.

The History of Technical Analysis


Technical analysis can be dated back to human observation of financial markets over the past hundreds of years. Technical analysis has been used in Japan since the 18th century. It is said that Homma Munehisa, a Japanese rice merchant, began recording the open, high, low and close price of rice on a daily basis, and created the candlestick chart that is widely used in financial markets like stocks, futures, and cryptocurrencies. However, a more systematic theory of technical analysis was put forward and improved by Charles Dow, who put forward the famous Dow Theory in the 19th century. Dow theory can be seen as the foundation of technical analysis, which is designed to project future trends of a stock based on its past price and trading volumes. Technical analysis is usually made in the form of charts and has now evolved into a perfect one that contains hundreds of different patterns and indicators.


Assumptions of Technical Analysis


Three basic assumptions:

1.Price is always a reflection of the latest market information and news. Price is like a mirror that demonstrates the impacts of news on price movements in real time.


2.Identifiable patterns and trends can still be found even in a seemingly random price action. Prices are susceptible to past trends and may continue to move in this direction.


3.Influenced by market participants’ psychology and emotions, history tends to repeat itself. Therefore, prices move in one direction periodically and are less likely to reverse abruptly.


Based on the above assumptions, technical analysis researchers believe it is achievable to predict price trends as long as we identify the hidden laws of price movements.


Application


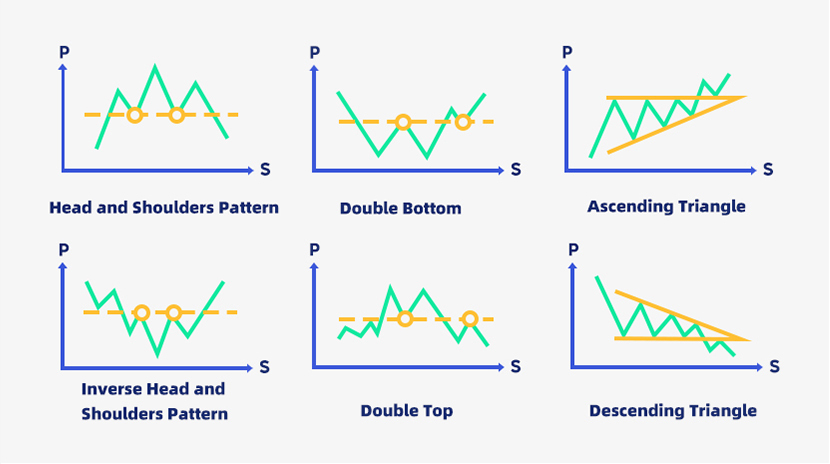
Generally, we discuss technical analysis from two facets: patterns and indicators. When price changes regularly, we can draw specific patterns on the candlestick chart, such as head and shoulders Pattern, inverse head and shoulders pattern, double bottoms, double tops, ascending triangle, descending triangle, etc. Key price zones, commonly known as support and resistance zones, can be identified from different patterns and be used as a reference for trading.


Determining the support and resistance zones is critical in technical analysis. The price range, usually accompanied by a large number of chips, is used to judge whether a trend forms or reverses. The prevailing trend may reverse when resistance occurs in an uptrend or support occurs in a downtrend. Therefore, traders may buy a stock when its price approaches the support level and sell off when the price approaches the resistance level.


Let’s take the W pattern as an example. When a rebound after a drop goes even higher than the previous high, the price zone of the previous high would form key support, meaning that the selling pressure in this zone turns into buying, which is a bullish sign. In contrast, for the M pattern, if the pullback falls below the previous low, the price band of the previous low forms a key resistance, indicating that the buying pressure in this zone turns into selling, which is a bearish sign.


Technical indicators use statistical methods to study historical transaction data and make mathematical calculations to predict future market trends. According to the variables being used, technical indicators can be grouped into three types - trends, oscillators, and volumes; and short-term, medium-term and long-term indicators if we categorize them by time frame.


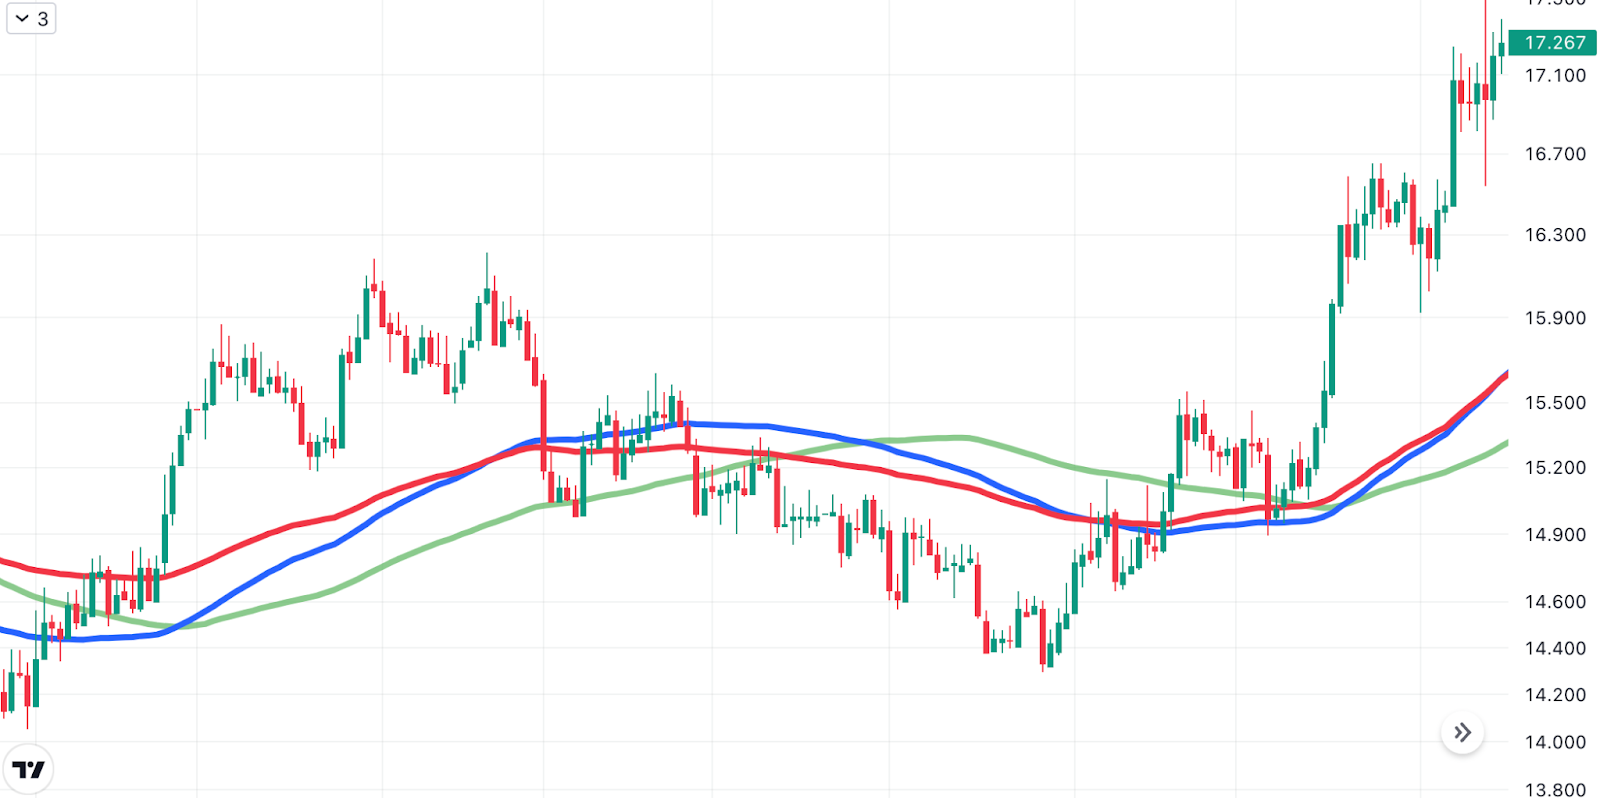
A handy and commonly used indicator is the moving average. A moving average is calculated based on historical prices over a specified period and can be viewed as a price trend over a period of time in the past. Based on whether weight is given to the price, moving average can be divided into simple moving average (SMA), exponential moving average (EMA) (which places a greater significance on the most recent prices), and weighted moving average

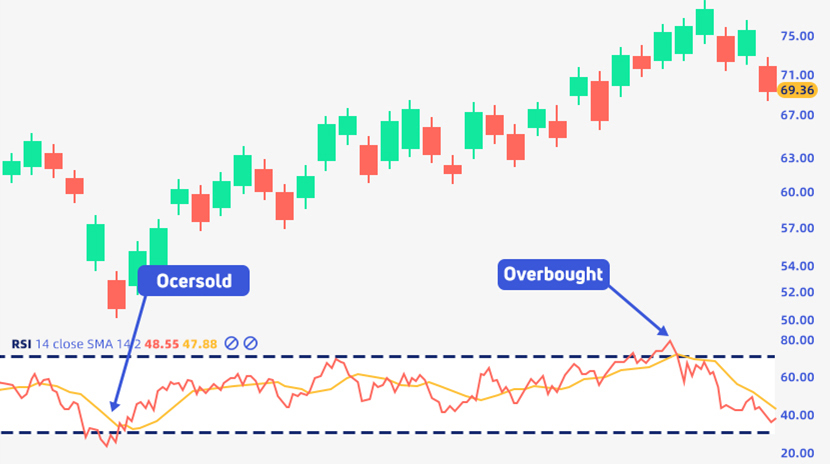
(WMA). WMA uses the most recent weighted prices to highlight trend deviations and reversals. The Relative Strength Index (RSI) is another commonly used indicator, which uses mathematical calculations to normalize the difference between the price increase and the price decrease to obtain a value ranging from 0 to 100. In a bull market where the price increase is greater than the price decrease, the RSI value will be higher, and vice versa. An asset is usually considered overbought when the RSI value is above 70 and oversold when it is below 30.


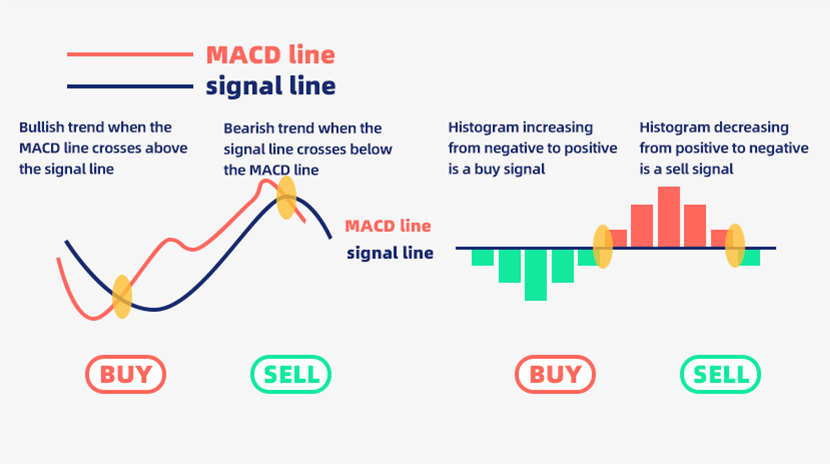
Some indicators are calculated on the basis of other indicators, such as the Moving Average Convergence Divergence (MACD). The MACD line (DIF line) is the difference in EMA prices between two time periods. The result will show the move trends of the MACD, which is also known as the signal line (DEA line). By subtracting the value of the MACD line from the signal line, we can get the MACD histogram. When the MACD line crosses the signal line from bottom to top, it means that the recent exponential average price difference is positive and greater than the average value, indicating a bullish trend; when the MACD line crosses the signal line from top to bottom, it means that the recent exponential average price difference is negative and less than the average value, indicating a bearish market.


**

**

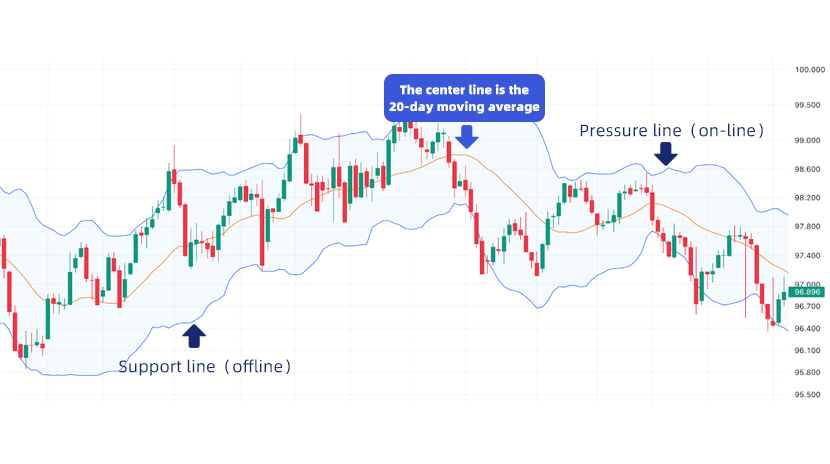
A Bollinger Band (BB) is also a popular technical indicator. It draws the possible price range on a candlestick chart combining a moving average and standard deviations. Specifically, it puts the SMA of the past prices of n days in the center, calculates the standard deviation of the prices of n days, and then extends m*standard deviations up and down as the boundary. The feature of Bollinger Bands is that when the price oscillates back and forth along the moving average, the probability of occurrence of different prices can be calculated by statistical methods. Under the normal distribution, about 95% of the values will fall within the range of 2 times the standard deviation from the central value. When the price is close to the upper or lower edge of the Bollinger Band, it usually indicates a large deviation from the mean, which may be a potential buying or selling opportunity.

**

**


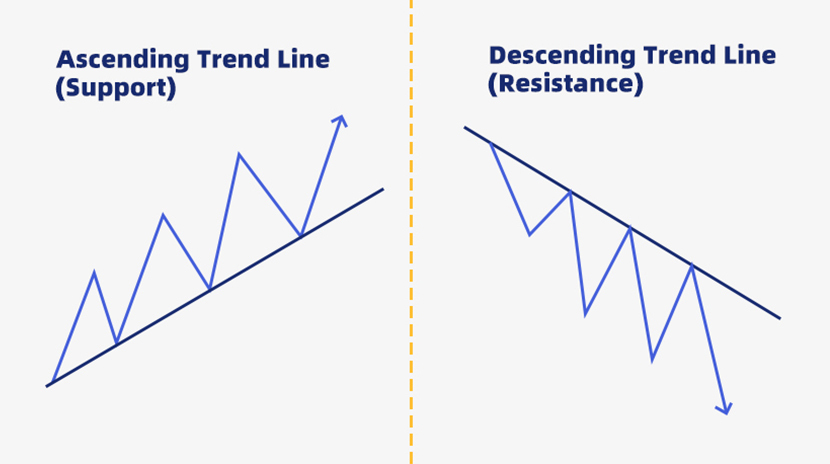
If you don’t want to do complicated calculations, drawing trend lines would be easier to analyze the market. In an uptrend, higher-lows will occur and a line connecting two more higher-lows forms an uptrend line. Prices may continue to rise before falling below the uptrend line. Conversely, in a downtrend, lower-highs may occur and a line connecting two more lower-highs forms a downtrend line. Prices may continue to drop before falling below the downtrend line.

**

**


Limitations of Technical Analysis


Although technical analysis is easier and convenient to use, there are still some limitations that need to be paid attention to. First of all, we should know that technical analysis is only a tool for traders to analyze the market. Therefore, the results of technical analysis are usually rather subjective, mixed with personal prejudice and biases. Different people may come to completely different conclusions using the same technical indicators. However, technical analysis has the potential to create self-fulfilling prophecies. When a big group of traders in the market behaves the same way, the price will move in the direction expected by the group, though this has nothing to do with the correctness of the analysis itself. In addition, technical analysis ignores many factors of fundamental analysis and is based on historical statistics only. However, we should know that exceptional cases may occur and unidentified factors exist no matter how thorough the analysis is. When using technical analysis, we should always fully understand its limitations to avoid being misled.


Conclusion


From traditional finance to cryptocurrency and from short-term speculation to long-term value investing, the question on how to profit in volatile markets has always been a matter of concern to investors. Although technical analysis is not as objective and comprehensive as fundamental analysis, and its argument that the market is highly efficient and the future is an extended projection of history has always been criticized, its cross-disciplinary versatility and efficient data interpretation make it extremely popular among traders and venture capitals. Using fundamental analysis coupled with technical analysis is one of the ideal ways to improve asset management and financial performance.
Author: Piccolo
Translator: Binyu
Reviewer(s): Hugo, Echo, Yuler
Disclaimer
This is not investment advice. This information is provided for informational purposes only and should not be construed as a recommendation to buy, sell or hold any asset. Cryptocurrency trading involves a risk of loss.
Gate US services may be restricted in certain jurisdictions. For more information, please see our legal disclosures: https://www.gate.com/en-us/legal/disclosures

Related Articles

What Is Inflation?
Intermediate

What Is Inflation?

Prolonged fall in the price value of financial assets and decline in the overall market index over time.
2025-11-26 11:24:21
Applying Fibonacci Tools in Cryptocurrency Trading
Intermediate

Applying Fibonacci Tools in Cryptocurrency Trading

This article explores Fibonacci retracement and extension tools for crypto technical analysis. It explains how these tools identify support and resistance levels, demonstrates their use through Bitcoin trading examples, and discusses their integration with on-chain data and technical indicators. The guide covers practical applications while noting limitations with low-cap tokens.
2025-09-19 08:59:41
How to Build a Trading System
Beginner

How to Build a Trading System

This article delves into the creation of a consistently profitable personal trading system, focusing on essential elements like entry and exit strategies, trading timeframes, and position sizing—empowering traders to identify their edge in the market.
2025-09-19 09:00:14
PayFi: The DeFi Settlement Infrastructure Connecting the Crypto World with Real-World Payments
Intermediate

PayFi: The DeFi Settlement Infrastructure Connecting the Crypto World with Real-World Payments

Explore how PayFi builds an on-chain settlement network connecting stablecoin issuers, DeFi protocols, and payment merchants through a modular architecture. This article outlines its core mechanisms, technical framework, and representative application scenarios, analyzing how it enhances on-chain payment efficiency, reduces trading costs, and enables cross-chain liquidation, bridging real-world payments and the crypto ecosystem.
2025-09-19 08:57:27
What Is Fundamental Analysis?
Beginner

What Is Fundamental Analysis?

Suitable indicators and tools combined with crypto news make up the best possible fundamental analysis for decision-making
2026-03-04 06:42:44
Risks You Must Be Aware Of When Trading Crypto
Beginner

Risks You Must Be Aware Of When Trading Crypto

What do you know about the risks of trading cryptocurrencies? As numerous cryptocurrency projects thrive, there are more and more risks to consider, including common scams, hacks, and regulatory risks.
2026-03-04 06:39:23