ANI vs XLM: Dil Modellerinde Yapay Zekâ Liderliği Yarışı

Giriş: ANI ve XLM Yatırımlarının Karşılaştırılması
Kripto para piyasasında ANI ve XLM’nin karşılaştırılması, yatırımcılar açısından kaçınılmaz bir başlık olmuştur. Bu iki varlık, piyasa değeri sıralamasından kullanım alanlarına ve fiyat performanslarına kadar önemli farklılıklar gösterirken, kripto varlık ekosisteminde de farklı şekillerde konumlanmaktadır.
ANI (ANI): Piyasaya yakın zamanda sürülen bu token, memecoin evreninde sevimli bir yapay zekâ dostu olarak piyasa tarafından hızla benimsenmiştir.
XLM (XLM): 2014’ten bu yana, dijital ve itibari para transferlerinde merkeziyetsiz bir ağ olarak görülmekte, bankalar, ödeme kurumları ve bireyler arasında dijital varlıkların hızlı ve düşük maliyetli transferlerine olanak sağlamaktadır.
Bu makalede, ANI ve XLM yatırımlarının değerleri; tarihsel fiyat hareketleri, arz mekanizmaları, kurumsal benimsenme düzeyi, teknolojik ekosistemleri ve gelecek öngörüleri temelinde kapsamlı biçimde ele alınarak, yatırımcıların en çok merak ettiği soruya yanıt aranmaktadır:
"Şu anda hangisi daha iyi bir alım fırsatı?"
I. Fiyat Geçmişi ve Güncel Piyasa Durumu Karşılaştırması
ANI ve XLM Tarihsel Fiyat Eğilimleri
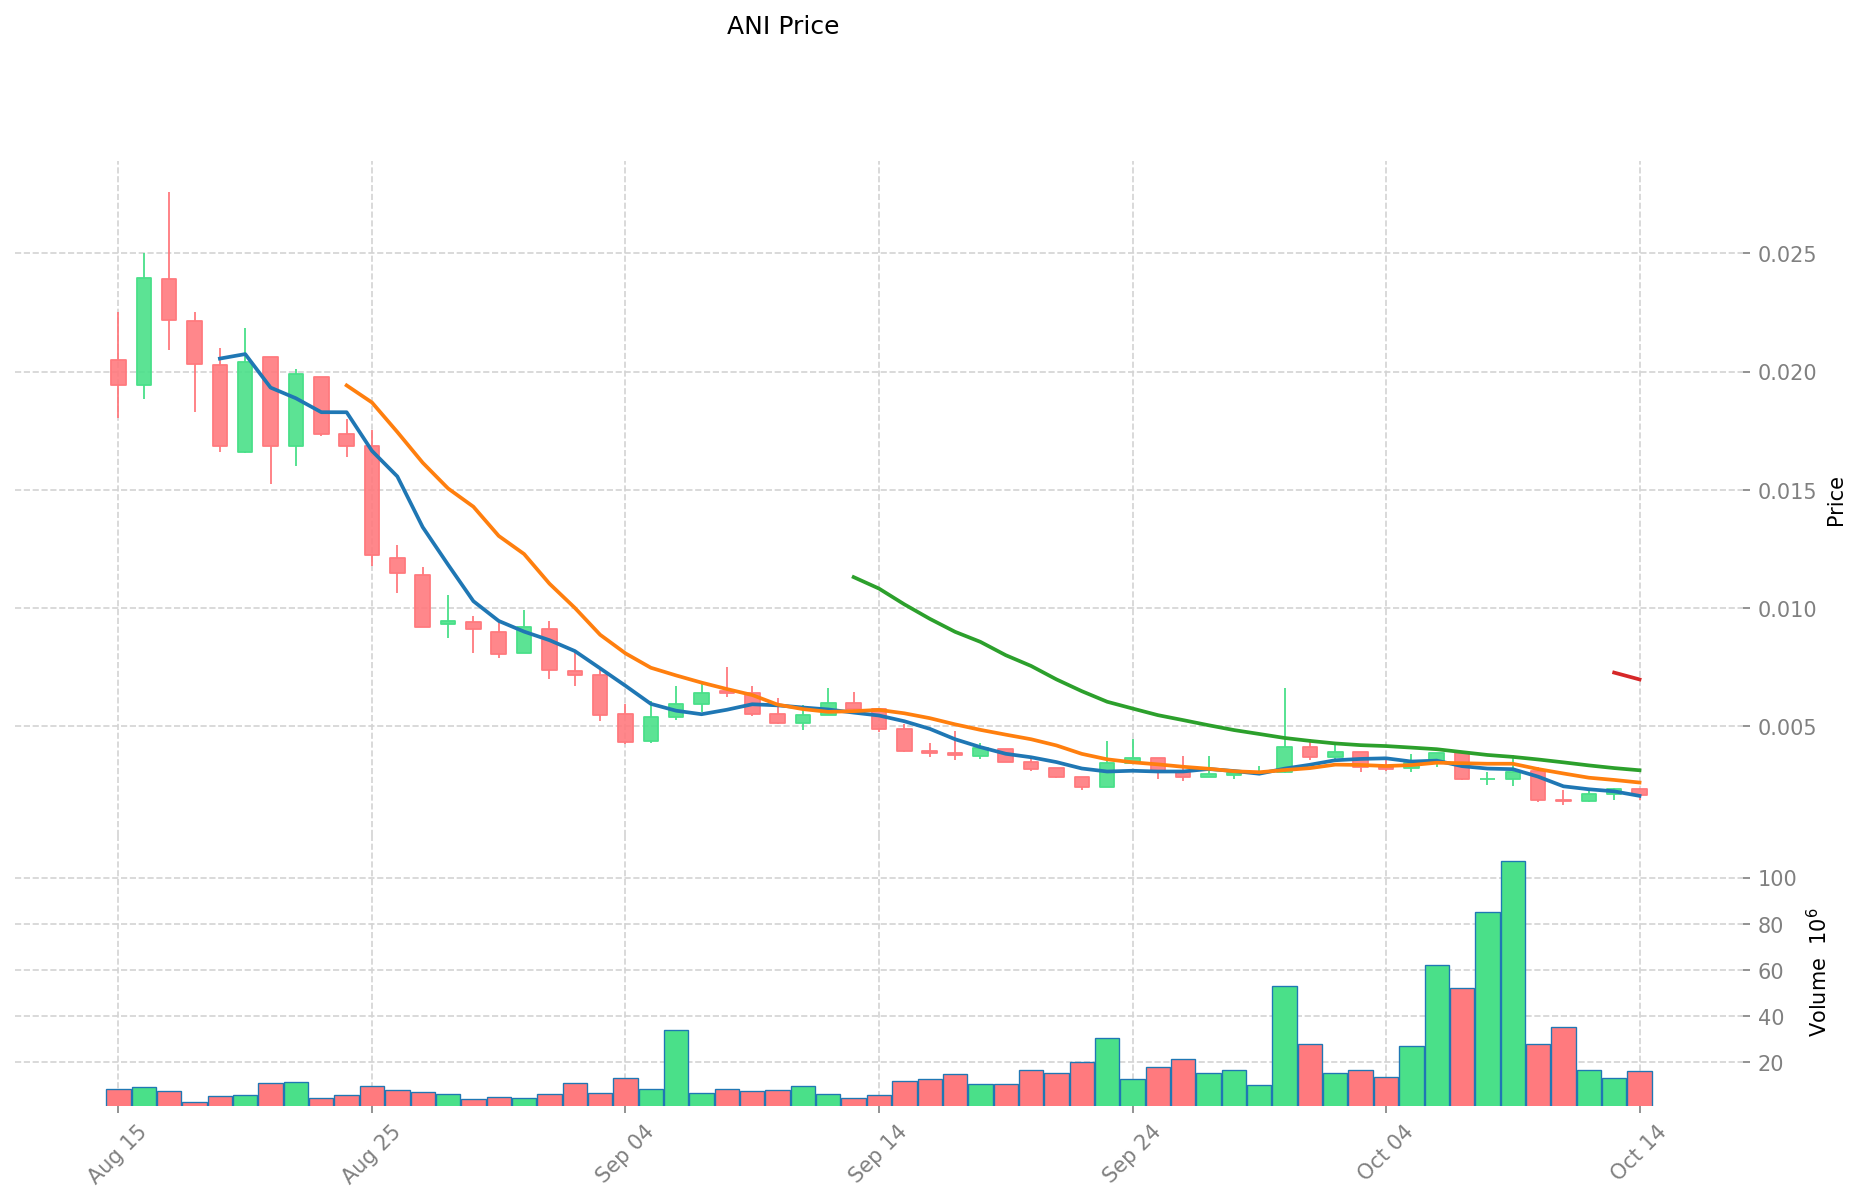
- 2025: ANI, 17 Ağustos 2025’te 0,0276 $ ile tüm zamanların en yüksek seviyesini gördü.
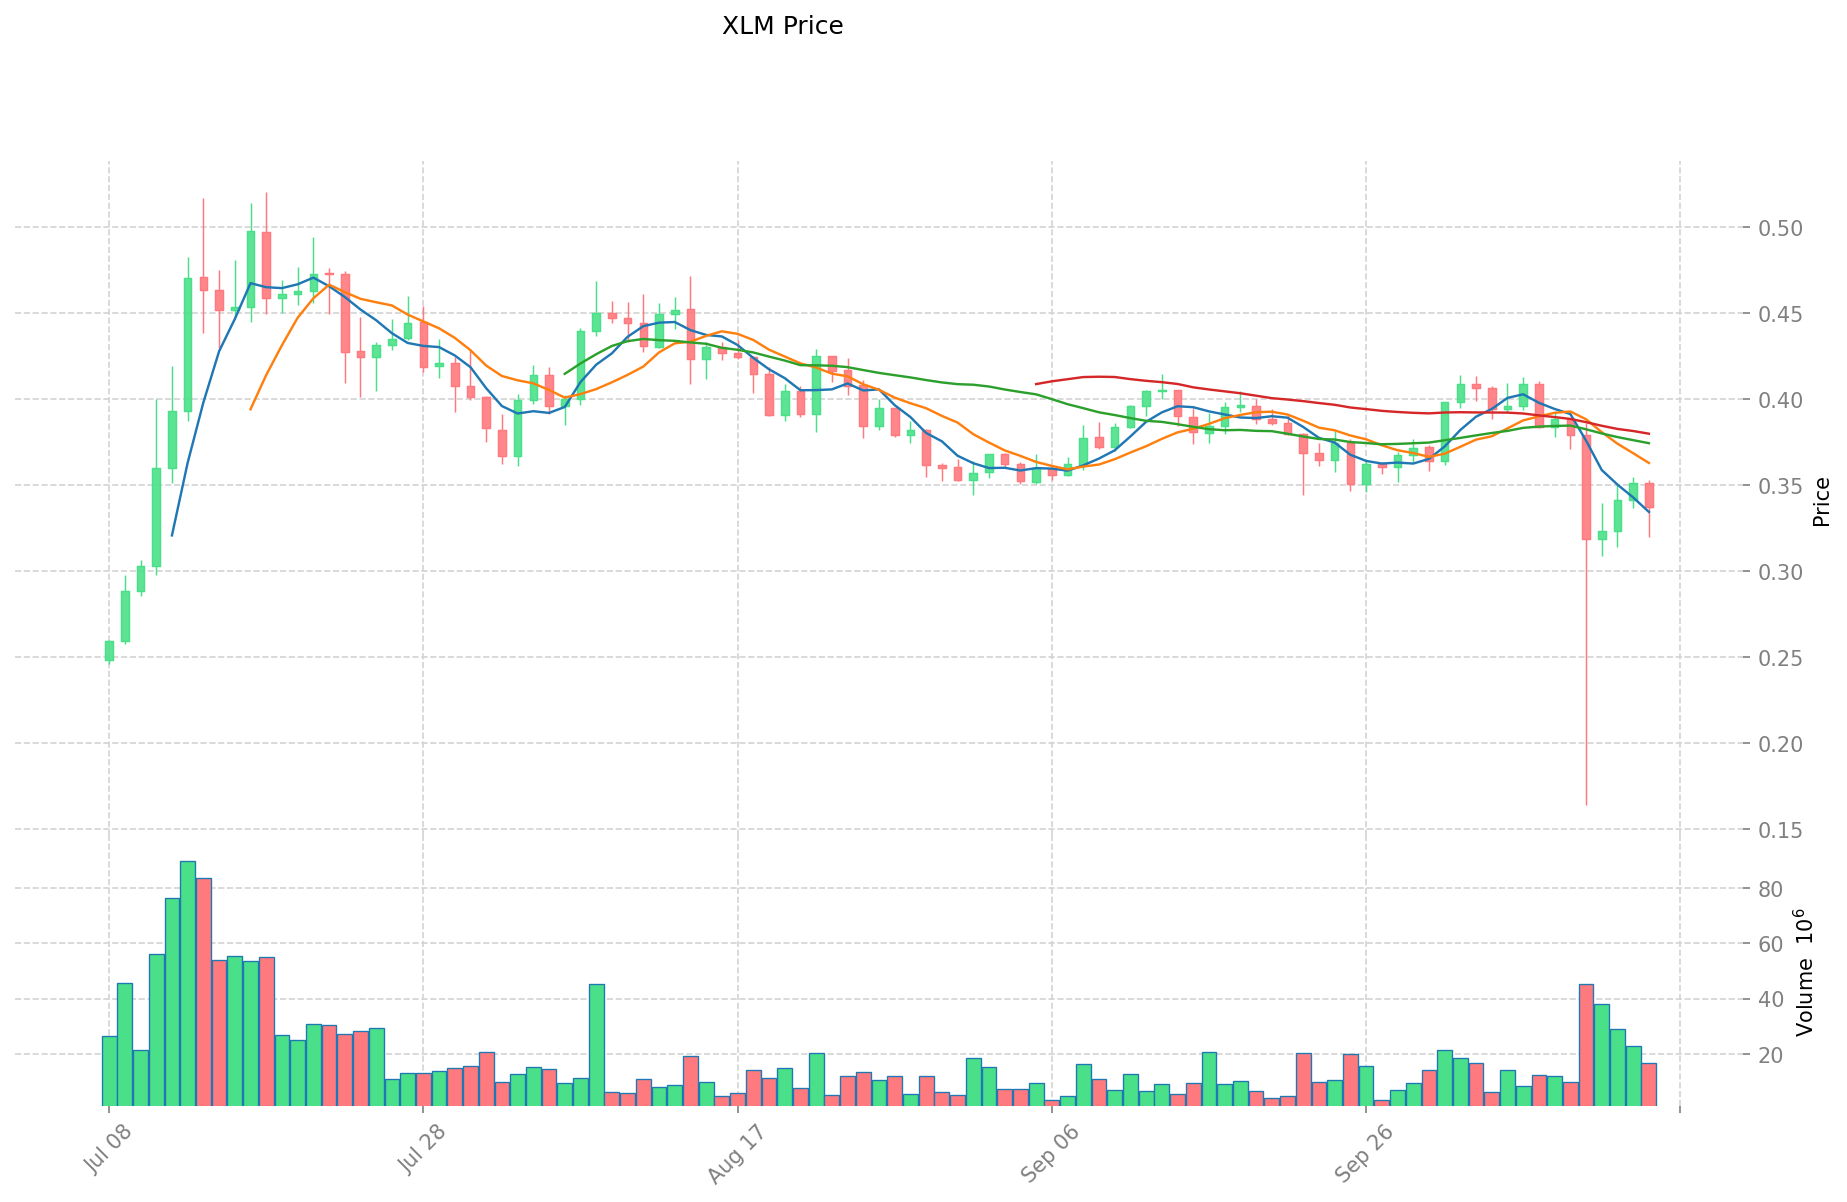
- 2025: XLM, 52 haftalık dönemde 0,089523 $ ile 0,634248 $ arasında dikkate değer dalgalanmalar yaşadı.
- Kıyaslamalı analiz: Mevcut piyasada ANI, 0,0276 $’lık zirveden 0,001661 $’a kadar gerilerken; XLM, yaklaşık 0,33574 $ ile görece daha istikrarlı bir seyir izledi.
Güncel Piyasa Durumu (15 Ekim 2025)
- ANI güncel fiyat: 0,002125 $
- XLM güncel fiyat: 0,33574 $
- 24 saatlik işlem hacmi: ANI 32.754,85 $ | XLM 5.565.789,39 $
- Piyasa Duyarlılığı (Korku & Açgözlülük Endeksi): 34 (Korku)
Canlı fiyatları görmek için tıklayınız:
- ANI güncel fiyatı için Piyasa Fiyatı
- XLM güncel fiyatı için Piyasa Fiyatı
ANI ve XLM Yatırım Değeri Faktörlerinin Analizi
I. ANI ve XLM’nin Yatırım Değerini Etkileyen Faktörler
Piyasa Duyarlılığı ve Yatırımcı Güveni
- Piyasa duyarlılığı, ANI ve XLM fiyatlarını doğrudan etkiler
- Benimsenme veya teknolojik gelişmelerle ilgili olumlu haberler, güçlü fiyat hareketlerine yol açabilir
- Yatırımcı güveni, kripto varlık değerinin temel belirleyicisidir
Makroekonomik Eğilimler
- Her iki token de genel ekonomik dalgalanmalardan etkilenir
- Piyasa arz ve talep dengesi fiyat değişimlerini belirler
- Ekonomik döngüler, kripto varlıklara yönelik risk iştahını etkiler
Düzenleyici Çevre
- Politika ve düzenleyici gelişmeler, ANI ve XLM üzerinde doğrudan etkilidir
- Farklı ülkeler, kripto para düzenlemelerine farklı yaklaşabilir
- Düzenleme netliği ya da belirsizliği fiyat oynaklığını artırabilir
Teknolojik İnovasyon
- Teknolojik gelişmeler ve güncellemeler değer önerisini doğrudan etkiler
- Blokzincir altyapısındaki yenilikler, uzun vadeli sürdürülebilirliği belirler
- Teknolojik ilerlemeler, rekabetçi avantaj ya da dezavantaj yaratabilir
II. ANI ve XLM’nin Değerlendirilmesinde Temel Göstergeler
Piyasa Performansı Göstergeleri
- İşlem hacmi eğilimleri
- Başlıca kripto paralarla fiyat korelasyonu
- Volatilite karşılaştırması
Teknik Analiz
- Destek ve direnç seviyeleri
- Piyasa trendlerinin tespiti
- Tarihsel fiyat paternleri
Risk Değerlendirme Çerçevesi
- Likitide riski
- Teknik açıklar
- Benimsenme zorlukları
III. Yatırımcılar İçin Stratejik Değerlendirmeler
Portföy Entegrasyonu
- Kripto portföylerinde çeşitlendirme avantajı
- Geleneksel varlıklarla korelasyon
- Risk ayarlı getiri potansiyeli
Yatırım Süresi
- Kısa vadeli al-sat fırsatları
- Orta vadeli pozisyonlar
- Uzun vadeli değer analizi
Piyasa Takibi
- Takip edilmesi gereken ana göstergeler
- Önemli gelişmeler
- Risk yönetim stratejileri
IV. Gelecek Beklentisi
Piyasa Gelişim Potansiyeli
- Mevcut konumlanmaya göre büyüme eğilimleri
- Kurumsal benimsenme potansiyeli
- Rekabet ortamının evrimi
III. 2025-2030 Fiyat Tahmini: ANI vs XLM
Kısa Vadeli Tahmin (2025)
- ANI: Temkinli 0,00186384 $ - 0,002118 $ | İyimser 0,002118 $ - 0,00315582 $
- XLM: Temkinli 0,248418 $ - 0,3357 $ | İyimser 0,3357 $ - 0,46998 $
Orta Vadeli Tahmin (2027)
- ANI, büyüme evresine geçebilir; fiyat aralığı 0,001711090899 $ - 0,003395021625 $ olarak öngörülmektedir
- XLM, boğa piyasasına girebilir; fiyat aralığı 0,31290597 $ - 0,52953318 $ olabilir
- Temel etkenler: Kurumsal sermaye girişi, ETF, ekosistem gelişimi
Uzun Vadeli Tahmin (2030)
- ANI: Temel senaryo 0,002312215464935 $ - 0,003919009262602 $ | İyimser senaryo 0,003919009262602 $ - 0,004350100281488 $
- XLM: Temel senaryo 0,38141516760165 $ - 0,73349070692625 $ | İyimser senaryo 0,73349070692625 $ - 0,931533197796337 $
Feragatname: Yukarıdaki tahminler, tarihsel veriler ve piyasa analizlerine dayanmaktadır. Kripto para piyasaları yüksek dalgalanma gösterir ve hızla değişebilir. Bu bilgiler yatırım tavsiyesi değildir. Yatırım kararı öncesi kendi araştırmanızı yapmalısınız.
ANI:
| 年份 | 预测最高价 | 预测平均价格 | 预测最低价 | 涨跌幅 |
|---|---|---|---|---|
| 2025 | 0.00315582 | 0.002118 | 0.00186384 | 0 |
| 2026 | 0.0027951246 | 0.00263691 | 0.0022941117 | 24 |
| 2027 | 0.003395021625 | 0.0027160173 | 0.001711090899 | 27 |
| 2028 | 0.00433883763675 | 0.0030555194625 | 0.00262774673775 | 43 |
| 2029 | 0.00414083997558 | 0.003697178549625 | 0.002883799268707 | 73 |
| 2030 | 0.004350100281488 | 0.003919009262602 | 0.002312215464935 | 84 |
XLM:
| 年份 | 预测最高价 | 预测平均价格 | 预测最低价 | 涨跌幅 |
|---|---|---|---|---|
| 2025 | 0.46998 | 0.3357 | 0.248418 | 0 |
| 2026 | 0.5599476 | 0.40284 | 0.362556 | 20 |
| 2027 | 0.52953318 | 0.4813938 | 0.31290597 | 43 |
| 2028 | 0.7430313303 | 0.50546349 | 0.3892068873 | 50 |
| 2029 | 0.8427340037025 | 0.62424741015 | 0.3433360755825 | 85 |
| 2030 | 0.931533197796337 | 0.73349070692625 | 0.38141516760165 | 118 |
IV. Yatırım Stratejisi Karşılaştırması: ANI ve XLM
Uzun Vadeli ve Kısa Vadeli Yatırım Stratejileri
- ANI: Memecoin potansiyeli ve yapay zekâ trendlerini takip eden yatırımcılar için uygundur
- XLM: Merkeziyetsiz ödeme çözümleri ve sınır ötesi transferlerle ilgilenen yatırımcılar için uygundur
Risk Yönetimi ve Varlık Dağılımı
- Temkinli yatırımcılar: ANI %5 | XLM %15
- Agresif yatırımcılar: ANI %15 | XLM %25
- Korumacı araçlar: Stablecoin tahsisi, opsiyonlar, çapraz para portföyleri
V. Potansiyel Risk Karşılaştırması
Piyasa Riski
- ANI: Memecoin doğası gereği yüksek oynaklığa sahip
- XLM: Genel kripto piyasası eğilimlerinden etkilenir
Teknik Risk
- ANI: Ölçeklenebilirlik, ağ istikrarı
- XLM: Merkezileşme endişeleri, güvenlik açıkları
Düzenleyici Risk
- Küresel düzenleyici politikalar, iki token üzerinde farklı etkiler yaratabilir
VI. Sonuç: Hangisi Daha İyi Alım Fırsatı?
📌 Yatırım Değeri Özeti:
- ANI avantajları: Memecoin cazibesi, viral büyüme potansiyeli
- XLM avantajları: Kurulu ağ, gerçek dünya ödeme uygulamaları
✅ Yatırım Tavsiyesi:
- Yeni yatırımcılar: Kripto piyasasına maruz kalmak için XLM’ye küçük bir pay ayırmayı değerlendirebilir
- Deneyimli yatırımcılar: Risk toleransına göre dengeli şekilde ANI ve XLM portföyü oluşturabilir
- Kurumsal yatırımcılar: Daha köklü ekosistemi ve kullanım alanları nedeniyle XLM’ye odaklanabilir
⚠️ Risk Uyarısı: Kripto para piyasası yüksek oynaklığa sahiptir. Bu makale yatırım tavsiyesi değildir. None
SSS
S1: ANI ve XLM arasındaki temel farklar nelerdir? C: ANI, yapay zekâ dostu olarak konumlandırılan yeni bir memecoin’dir; XLM ise, hızlı ve düşük maliyetli dijital varlık transferine odaklanan köklü bir kripto paradır. XLM, sınır ötesi transferler ve ödemelerde daha uzun geçmişe ve daha gelişmiş kullanım alanlarına sahiptir.
S2: Son dönemde hangi kripto para daha iyi fiyat performansı gösterdi? C: Güncel verilere göre XLM, fiyat istikrarı açısından ANI’ye göre daha iyi bir performans sergilemiştir. ANI, 2025’te 0,0276 $ ile rekor kırsa da sonrasında ciddi bir düşüş yaşadı. XLM ise görece daha istikrarlı bir fiyat aralığını korudu.
S3: ANI ve XLM’nin yatırım değerini etkileyen başlıca faktörler nelerdir? C: Temel faktörler; piyasa duyarlılığı, makroekonomik eğilimler, düzenleyici ortam ve teknolojik yeniliklerdir. Bu unsurlar iki varlığı da etkiler, ancak etkileri ANI ve XLM’nin farklı doğası ve kullanım alanlarına göre değişebilir.
S4: ANI ve XLM için uzun vadeli fiyat tahminleri nasıl karşılaştırılıyor? C: 2030 için yapılan tahminlerde, XLM’nin potansiyel fiyat aralığı (0,38141516760165 $ - 0,931533197796337 $) ANI’ya (0,002312215464935 $ - 0,004350100281488 $) göre daha yüksektir. Ancak bunların yalnızca tahmin olduğu ve gerçek sonuçların farklılık gösterebileceği unutulmamalıdır.
S5: ANI ve XLM yatırımlarında başlıca riskler nelerdir? C: Her iki kripto varlık da volatiliteye bağlı piyasa risklerine tabidir. Memecoin olan ANI, daha yüksek oynaklığa sahip olabilir. Teknik risklerde ANI için ölçeklenebilirlik, XLM için merkezileşme kaygıları öne çıkar. Her ikisi de farklı kullanım alanları nedeniyle düzenleyici risklere maruz kalır.
S6: Farklı yatırımcı tipleri ANI ve XLM’ye nasıl yaklaşmalı? C: Yeni yatırımcılar, daha oturmuş ekosistemi nedeniyle XLM’ye küçük bir pay ayırabilir. Deneyimli yatırımcılar, risk toleranslarına göre ANI ve XLM’yi dengeli şekilde portföylerine ekleyebilir. Kurumsal yatırımcılar ise sınır ötesi işlemlerdeki gelişmiş kullanım alanları nedeniyle XLM’ye daha çok odaklanabilir.
S7: Gelecekte ANI ve XLM için büyüme potansiyelini artıracak etkenler nelerdir? C: ANI için büyüme, memecoinlere ve yapay zekâ trendlerine ilginin artmasından kaynaklanabilir. XLM içinse, sınır ötesi ödemelerde yaygınlaşma, finansal kurumlarla iş birlikleri ve merkeziyetsiz finans ekosisteminin gelişimi başlıca büyüme faktörlerindendir.
Share
Content
Giriş: ANI ve XLM Yatırımlarının Karşılaştırılması
I. Fiyat Geçmişi ve Güncel Piyasa Durumu Karşılaştırması
I. ANI ve XLM’nin Yatırım Değerini Etkileyen Faktörler
II. ANI ve XLM’nin Değerlendirilmesinde Temel Göstergeler
III. Yatırımcılar İçin Stratejik Değerlendirmeler
IV. Gelecek Beklentisi
III. 2025-2030 Fiyat Tahmini: ANI vs XLM
IV. Yatırım Stratejisi Karşılaştırması: ANI ve XLM
V. Potansiyel Risk Karşılaştırması
VI. Sonuç: Hangisi Daha İyi Alım Fırsatı?
SSS
How to Buy Cryptocurrency


Trending Cryptocurrencies


kripto neden çöküyor ve toparlanacak mı?

2025 GROK Fiyat Tahmini: Yapay Zeka Destekli Kripto Para İçin Potansiyel Yükseliş mi, Piyasa Düzeltmesi mi?
2025 LCAT Fiyat Tahmini: Yeni Nesil Kripto Para Birimi İçin Potansiyel Büyüme ve Piyasa Trendlerinin Analizi

2025 ANI Fiyat Tahmini: Animoca Brands'in Token'ı İçin Piyasa Trendleri ve Olası Büyüme Faktörlerinin Analizi

GORK vs SHIB: Kripto Para Ekosisteminde Meme Coin Savaşı

Lion Cat (LCAT) iyi bir yatırım mı?: Bu yeni meme coin’in potansiyelini ve risklerini inceliyoruz
Wrapped Bitcoin’ın Avantajları ve Merkeziyetsiz Finans Alanındaki Kullanımına Dair Bir İnceleme

Kripto para alım satımında sürekli vadeli sözleşmelerin mantığını anlamak
2024 Yılında Dogecoin Madenciliği İçin En İyi Seçenekler

Dijital Varlıkların En İyi Koruyucuları: Kripto Paraların Güvenli Saklanmasını Sağlayan Çözümler

Kripto cüzdanınızı kullanırken güvenliği en üst seviyeye çıkarmak