Trade
Basic
Futures
Futures
Hundreds of contracts settled in USDT or BTC
Options
HOT
Trade European-style vanilla options
Unified Account
Maximize your capital efficiency
Demo Trading
Futures Kickoff
Get prepared for your futures trading
Futures Events
Participate in events to win generous rewards
Demo Trading
Use virtual funds to experience risk-free trading
Earn
Launch
CandyDrop
Collect candies to earn airdrops
Launchpool
Quick staking, earn potential new tokens
HODLer Airdrop
Hold GT and get massive airdrops for free
Launchpad
Be early to the next big token project
Alpha Points
NEW
Trade on-chain assets and enjoy airdrop rewards!
Futures Points
NEW
Earn futures points and claim airdrop rewards
Investment
Simple Earn
Earn interests with idle tokens
Auto-Invest
Auto-invest on a regular basis
Dual Investment
Buy low and sell high to take profits from price fluctuations
Soft Staking
Earn rewards with flexible staking
Crypto Loan
0 Fees
Pledge one crypto to borrow another
Lending Center
One-stop lending hub
VIP Wealth Hub
Customized wealth management empowers your assets growth
Private Wealth Management
Customized asset management to grow your digital assets
Quant Fund
Top asset management team helps you profit without hassle
Staking
Stake cryptos to earn in PoS products
Smart Leverage
NEW
No forced liquidation before maturity, worry-free leveraged gains
GUSD Minting
Use USDT/USDC to mint GUSD for treasury-level yields
More
Sykodelicc
No content yet
Sykodelicc
This is a staggering metric.
The 1M RSI on GOLD is now at the second highest level ever...
Second only to a period in 1968, almost 60 years ago, when GOLD was $55.
This is a truly generational run from GOLD and one of the strongest parabolas I have ever seen.
At some point, this comes to an end, as all parabolas do...
But it is anyones guess when.
One of the craziest things I've seen in my entire investment journey.

- Reward
- like
- Comment
- Repost
- Share
It will be very obvious in hindsight.
If we were at higher prices now with sentiment good and everyone was looking back on this current setup we have in front of us today...
Almost every single person would say they would be allocating hard into Crypto.
But because sentiment is so shot and everyone is so fried... they can't see how obvious it is.
We have:
- Metals giga sending
- Small cap stocks mooning
- Liquidity in all areas pumping from the bottom
- New FED Chair coming
- Market under pricing how many cuts this year
- Japan record breaking stimulus announced
- China continuing QE
- Bitcoin
BTC-0,75%
- Reward
- like
- Comment
- Repost
- Share
This is the last time I will post something like this.
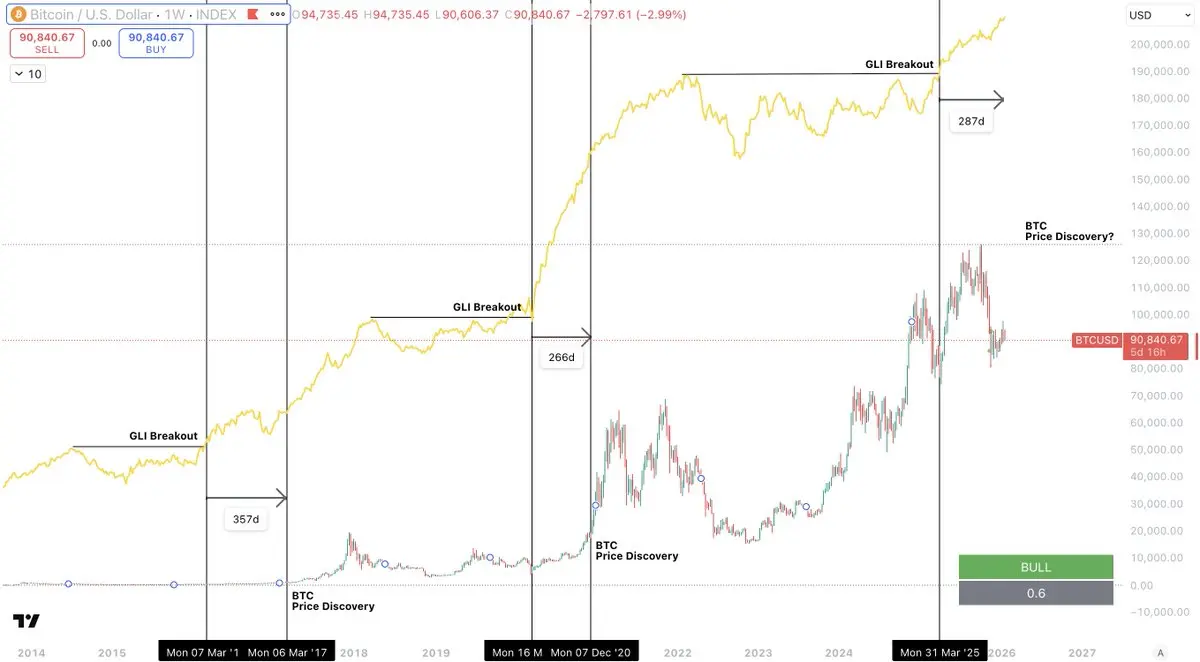
Global Liquidity is all that matters... and it has not topped.
In fact, it only broke out 9 months ago.
During the last two cycles in 2017 and 2021 it took Bitcoin...
357 Days to enter price discovery - 2017
266 days to enter price discovery - 2021
And right now we are at 287 days, with GLI making fresh new highs today.
During start of 2022 correction GLI had topped after 730 days of expansion and was making lower highs.
This is not the same situation and if you are betting on the bear market you are betting against global macro liquidity.
BTC-0,75%
- Reward
- like
- Comment
- Repost
- Share
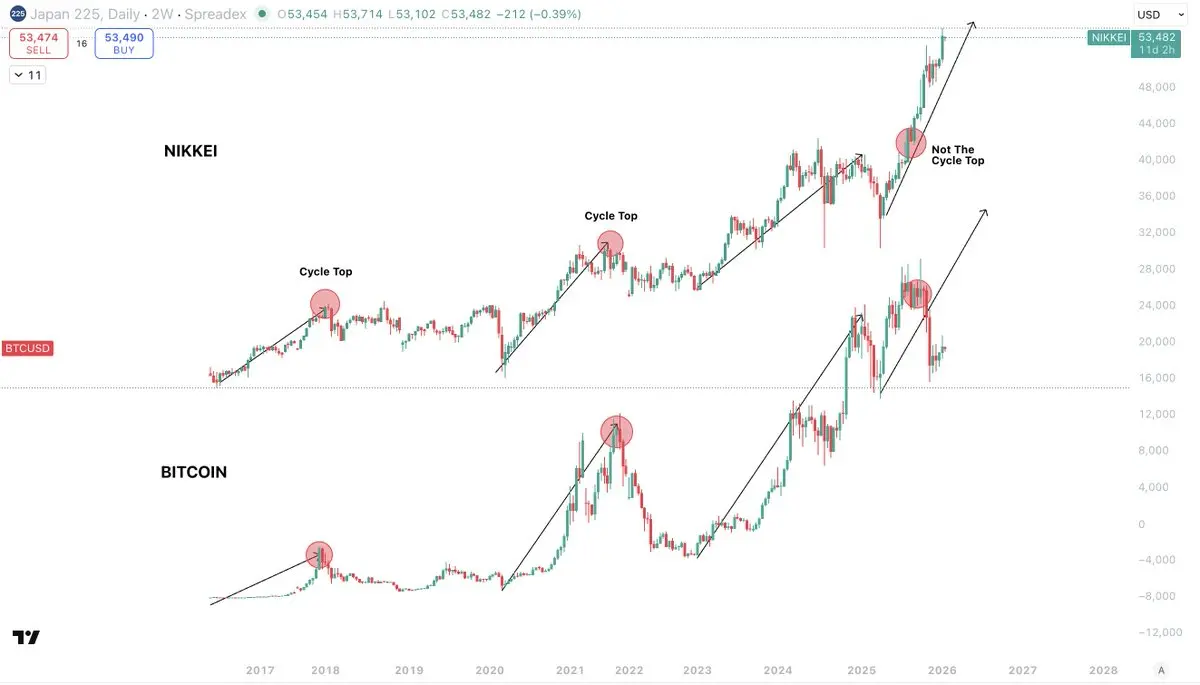
No one is talking about this.
And this is how you know that the vast majority of CT accounts have no idea about global macro.
Japan is the money machine of the world.
It has been their role to make money cheap and available for the rest of the world.
And right now, they have approved their largest ever fiscal stimulus for 2026.
In the below chart you can see this in action.
The NIKKEI is Japans stock exchange, and it is ripping!
Its very easy to see that Bitcoin moves in a very close lock-step with the NIKKEI...
And each cycle top for Bitcoin has been at the same time as the other.
This is bec
BTC-0,75%
- Reward
- like
- Comment
- Repost
- Share
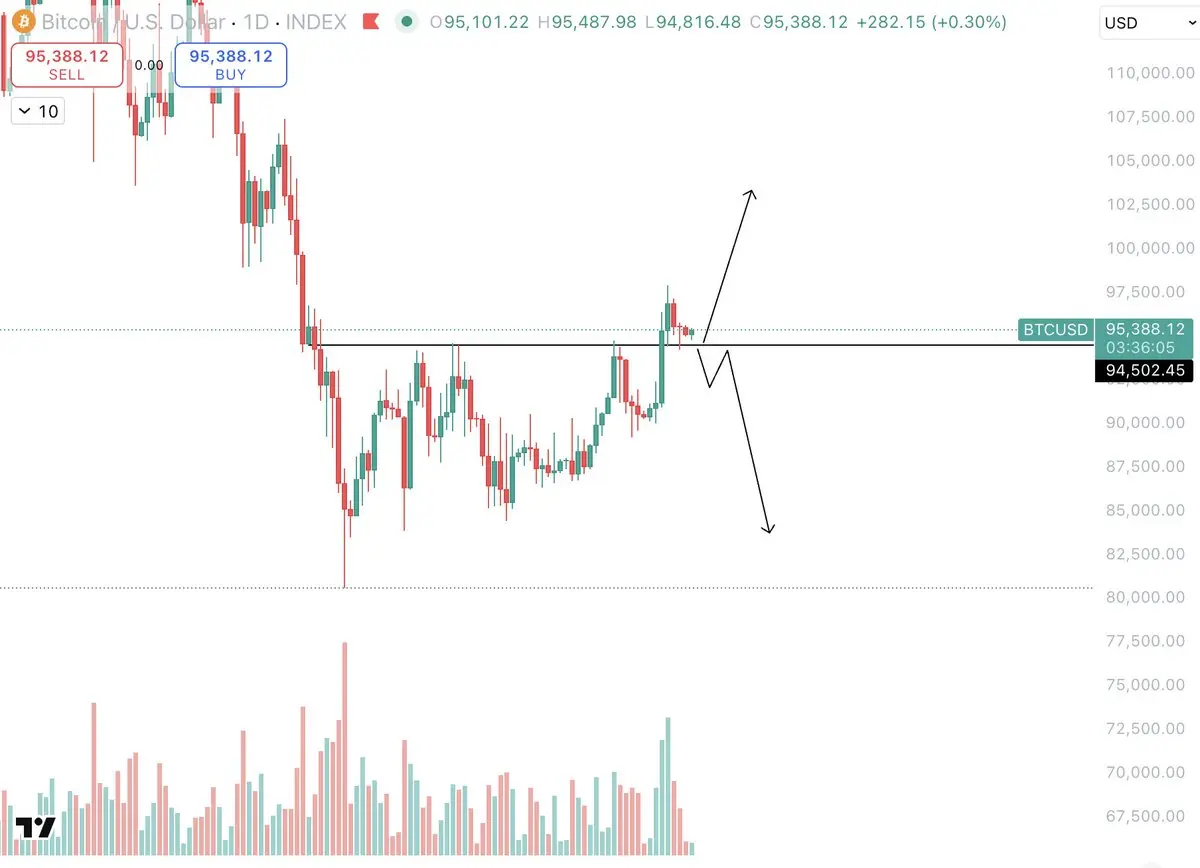
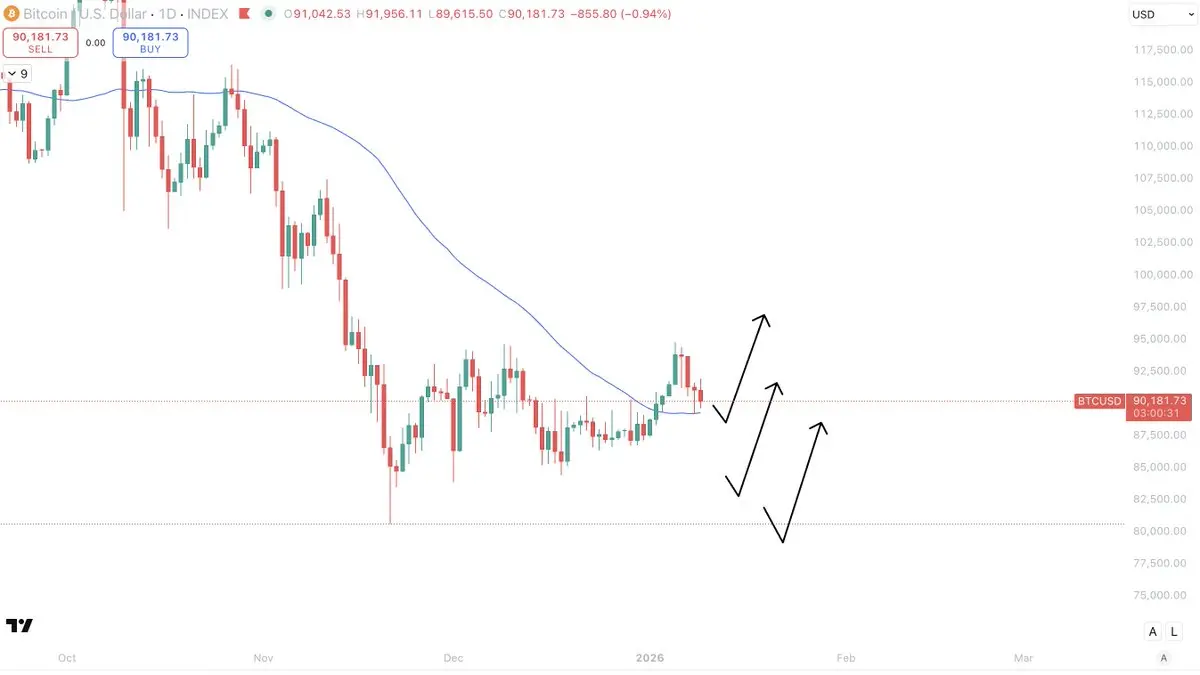
It could go up or down...
Lol.
But, yes, seriously, here is what to watch for to understand direction.
Price has held well above $94,500 for days now and overall looks very strong.
Close weekly here, I think we see a push higher into $100,000.
Get above $100,000 and hold and we invalidate any lower scenario.
Lose $94,500 with daily close and we start taking out lower regions.
My bias is on higher however, for following reasons:
- This has been a strong move with great rising volume
- Spot buying has been the main driver
- OBV is signalling strength
- Strong ETF inflows last week
- DSS Bresser,
- Reward
- like
- Comment
- Repost
- Share
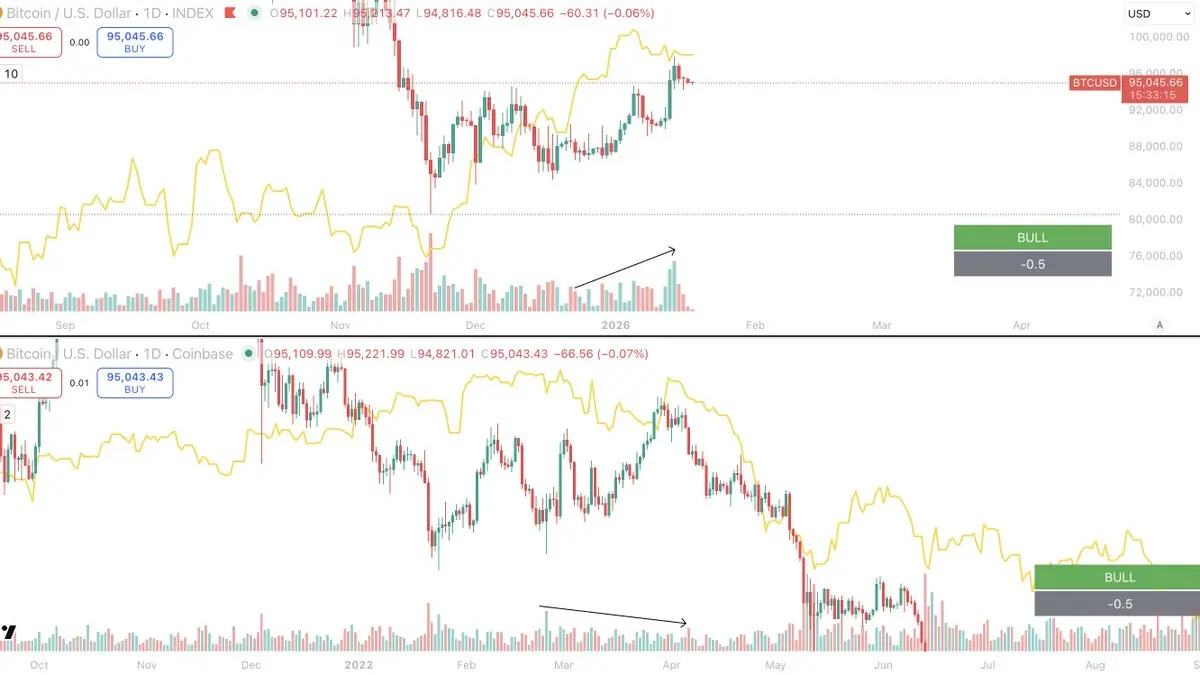
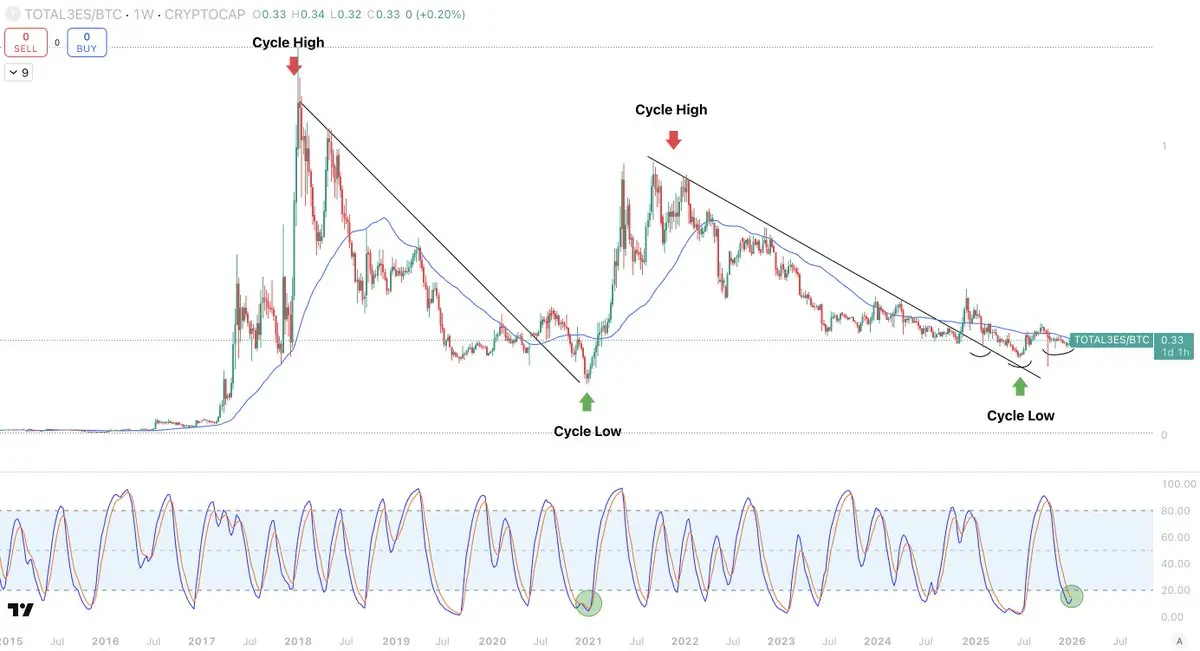
This is a very important observation.
There are a large number of people trying to say we are in the same market position as the start of 2022...
And even though the chart pattern has it similarities for sure, it is important to understand the bigger picture.
In 2022(bottom chart) we can see Global liquidity was in a downtrend and not making new highs. Inflation was insane and QT was set to begin, along with interest rate hikes. In addition, volume was decreasing as the price moved higher.
This is textbook exhausted PA that has its lifeblood(liquidity) draining from its foundation.
Right now,
- Reward
- like
- Comment
- Repost
- Share
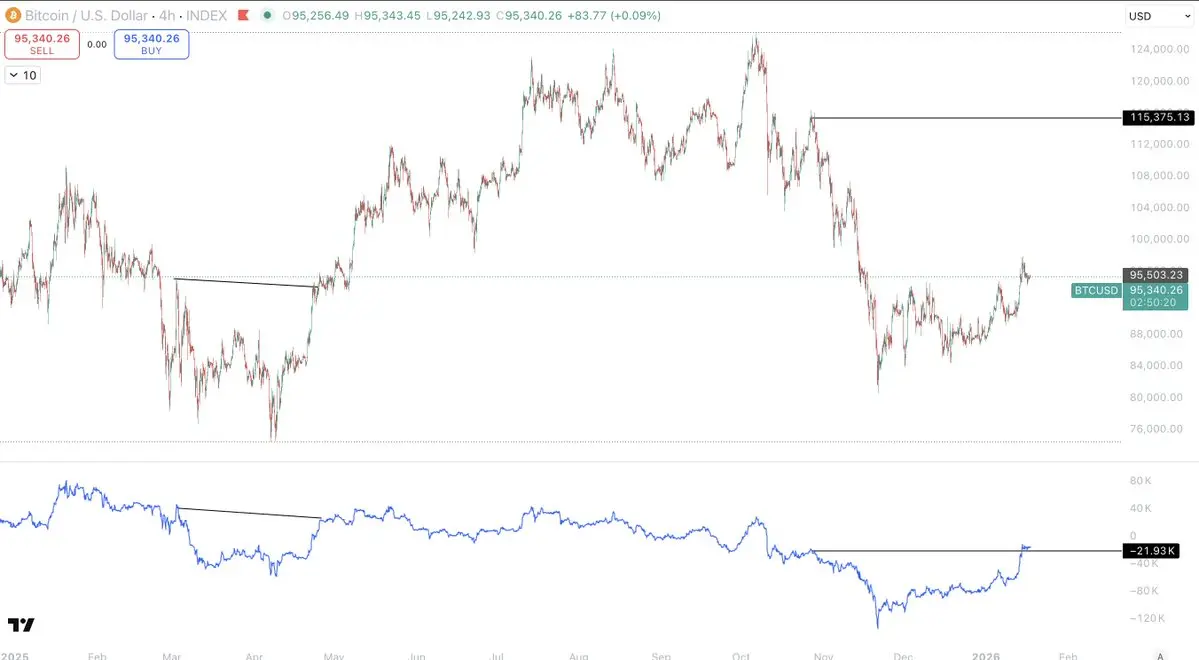
The strength here on Bitcoin is staggering.
I can't find another time that the OBV has been this much ahead of price.
OBV is already back at the same levels it was when Bitcoin was at $115k.
For reference, in the April breakout, it was pretty much in line with price.
But right now, it is $20,000 in Bitcoin price ahead.
As I said, I can't see another time it has been this strong compared to price.
BTC-0,75%
- Reward
- like
- Comment
- Repost
- Share
What is the only thing that matters?
You should know by now.
Liquidity.
I think when a chart like ETH/BTC gets posted, most people don't understand that it follows a very strict pattern.
They think that it doesn't matter if its going up today... they think it could just reverse tomorrow and go all the way down again.
But that is not how it works.
Different charts follow different patterns, and ETH/BTC is one of the most important ones to understand when it comes to overall market position.
Ethereum is a risky asset and highly sensitive to liquidity.
And as we can see from this chart, ETH/BTC b
- Reward
- like
- Comment
- Repost
- Share
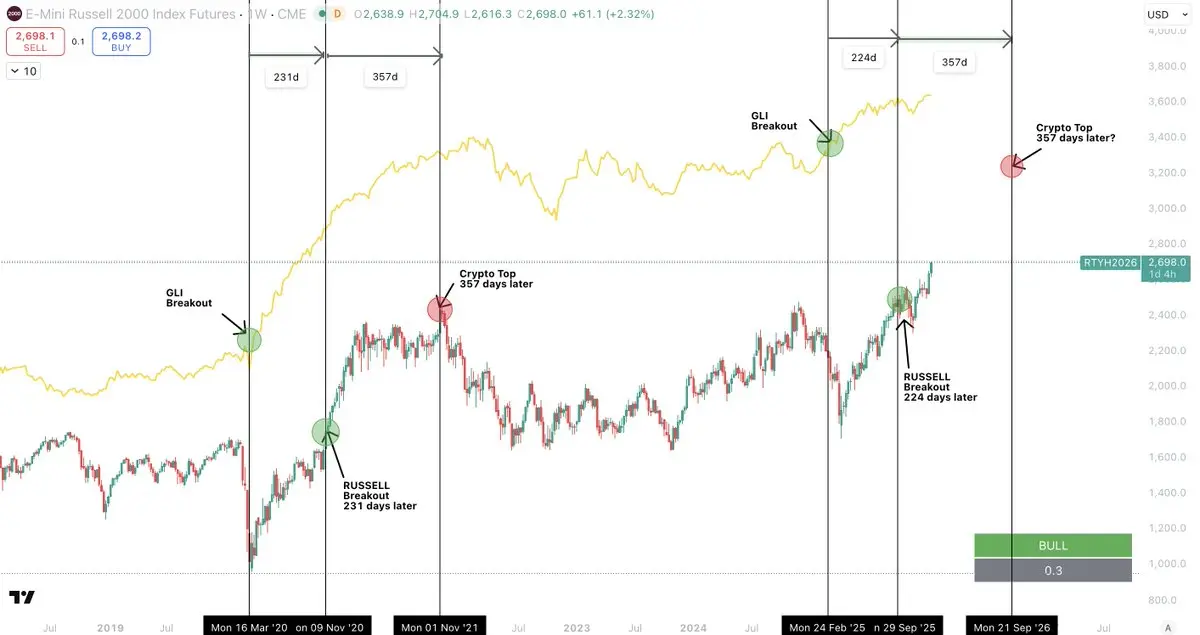
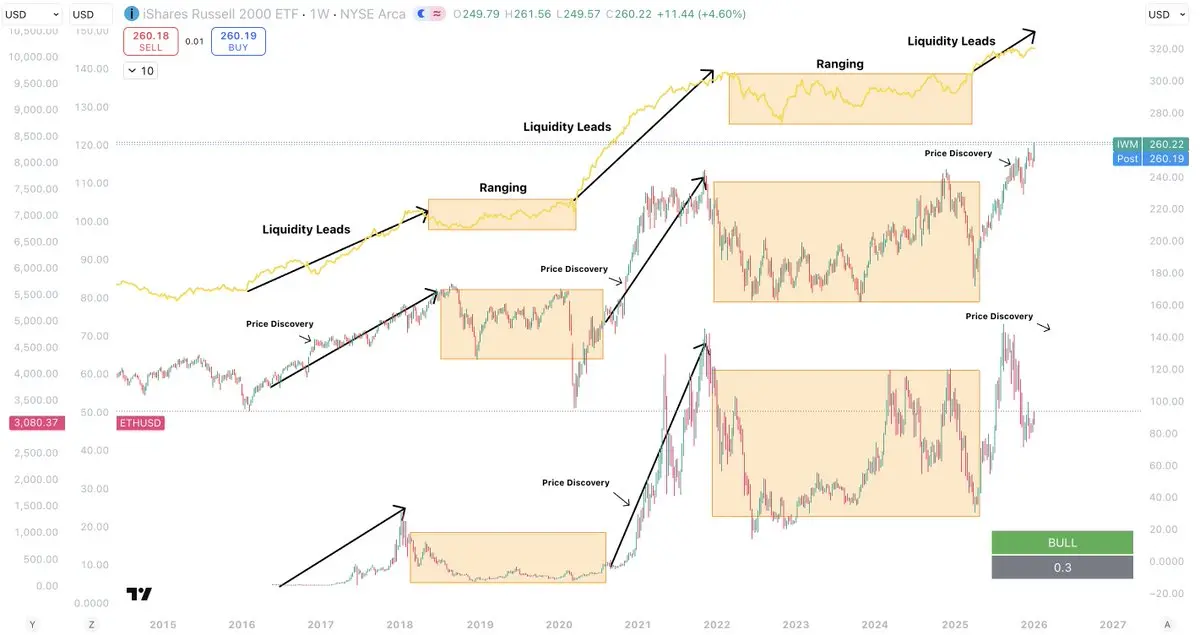
There is at least 9 months left of this bull cycle.
That is according to global liquidity.
If you want to understand the fundamental difference between where we currently are now, and where we were at the end of 2021...
This is an important chart to digest.
We have GLI(Global liquidity index) at the top, and the Russell 2000 at the bottom.
I like to view the Russell as a proxy for a hybrid of Bitcoin and Ethereum, together.
All three of the Russell, Bitcoin and Eth, are all highly sensitive to Global liquidity, and have been throughout every cycle.
So what are we looking at here?
We can see t
- Reward
- like
- Comment
- Repost
- Share
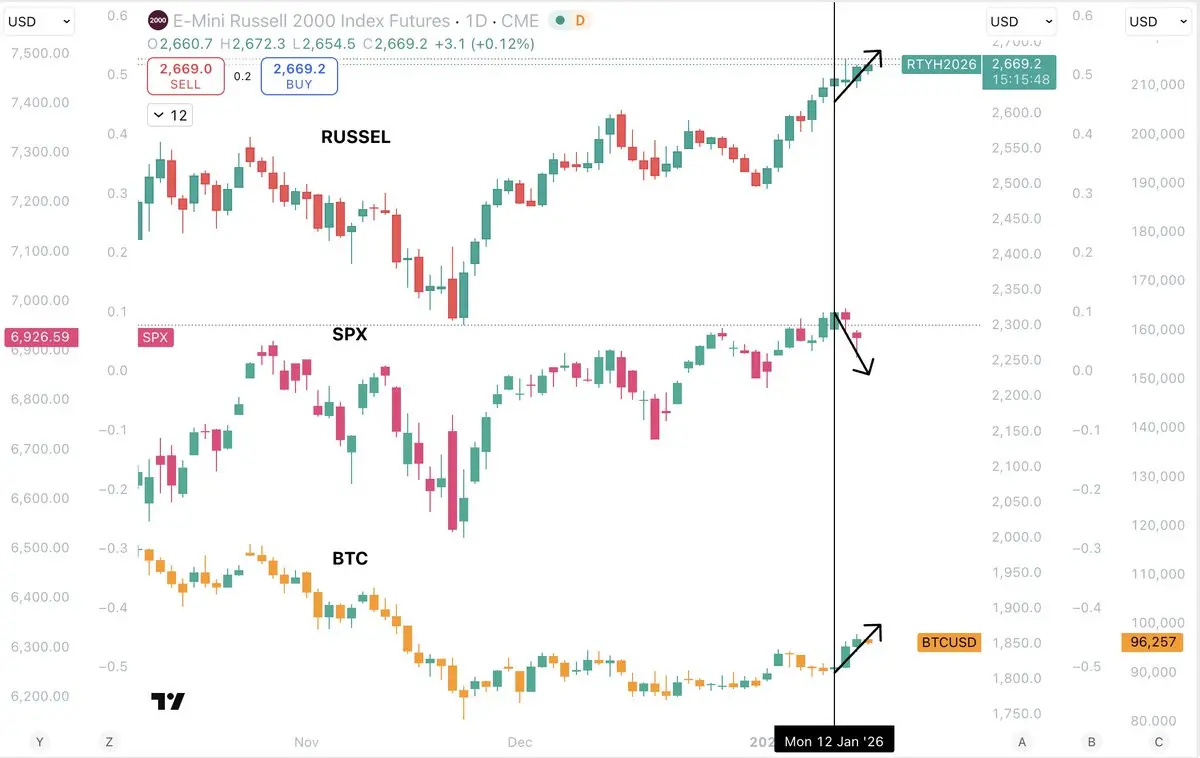
The macro has not looked more bullish in YEARS.
And over the last few days we have had...
SPX - Down
Russell - Up
Bitcoin - Up
This not a bear market for anyone still clinging onto that.
And for everyone that mocks the rotation... well, here it is.
Liquidity is starting to make its way down the risk curve and Russell and BTC are at the higher level.
Bitcoin is essentially a liquidity pressure valve that soaks up liquidity as it begins to infiltrate the markets.
There is still time for you to understand the overall macroeconomic environment and change your bias so you can get positioned...
But
BTC-0,75%
- Reward
- like
- Comment
- Repost
- Share
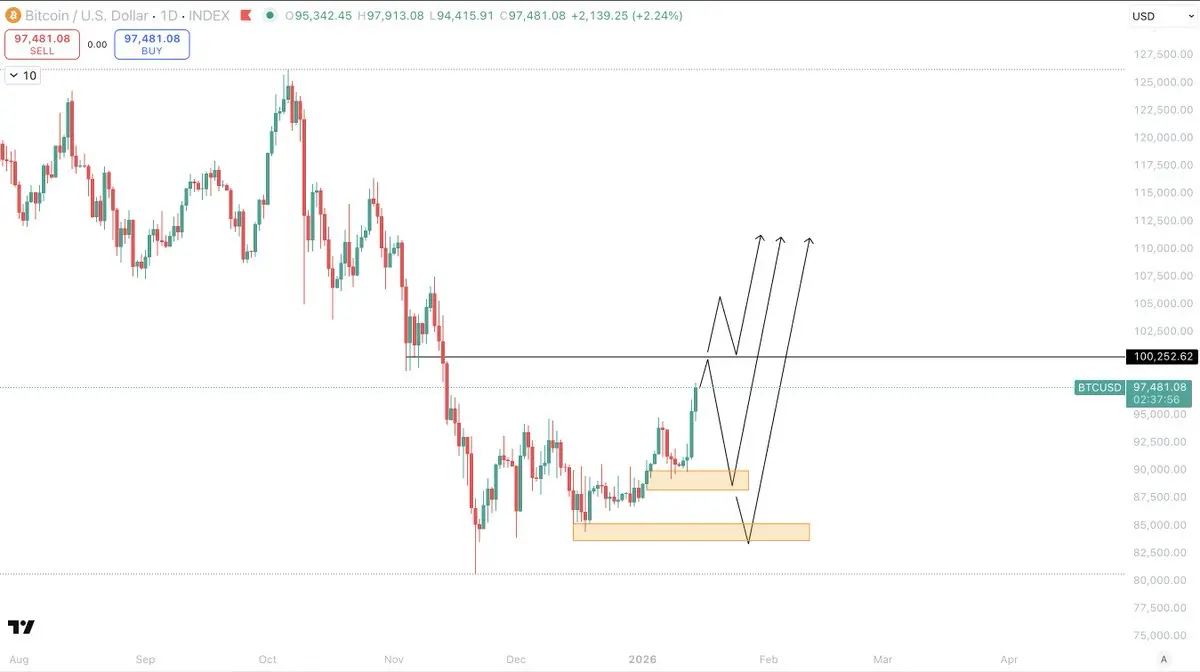
This has been a decent push from Bitcoin.
However, we need to pay attention to levels now more than ever.
We currently have $16bn in long liquidations down to $86k... that is a lot.
There is a high enough chance that the market makers will take it, so we have to entertain that outcome.
And in an ideal world, we want them to take it before we move too much higher, because there will always be a chance they will go back for it.
We have broken 96k which is a great start.
If we can get above $100k and the 50SMA then both downside scenarios are invalidated...
But the whole time we are below $100k,
BTC-0,75%
- Reward
- like
- Comment
- Repost
- Share
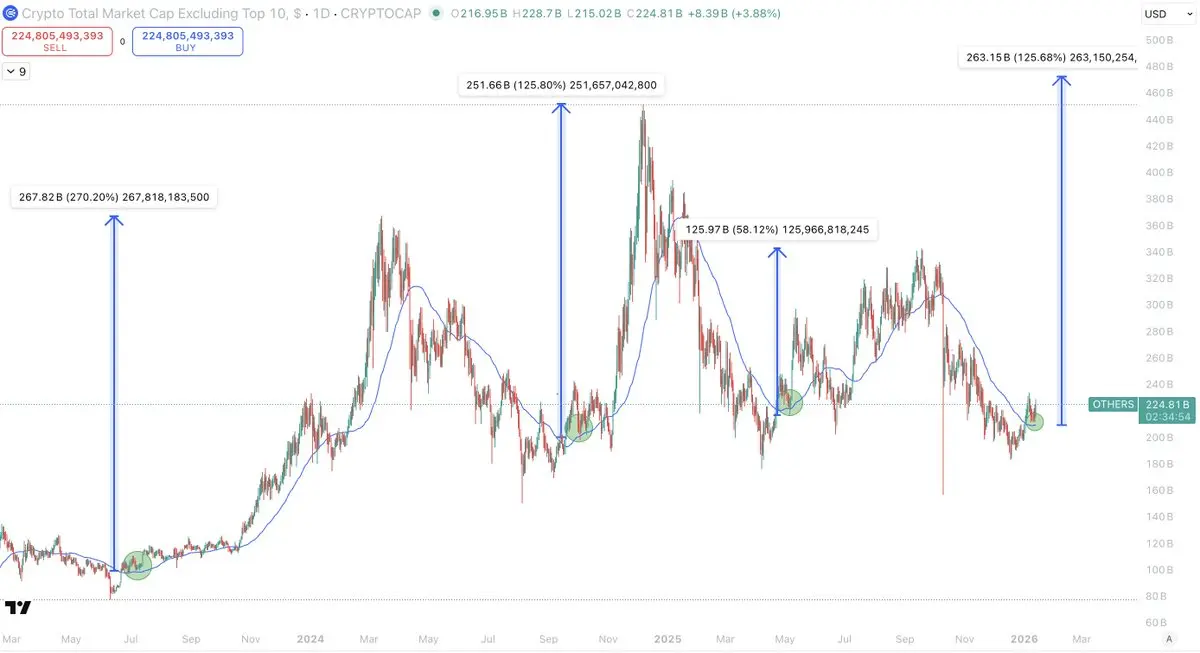
Alts are preparing to go on a very big move here.
Every time this cycle OTHERS has broken above the 1D 50SMA after a downtrend and held it, it has led to:
1. 267% move
2. 125% move
3. 58% move
Everything is lining up for overall market expansion very soon.
Every time this cycle OTHERS has broken above the 1D 50SMA after a downtrend and held it, it has led to:
1. 267% move
2. 125% move
3. 58% move
Everything is lining up for overall market expansion very soon.
- Reward
- 3
- 2
- Repost
- Share
GateUser-bccc97b8:
Vryvaytes 🚀View More
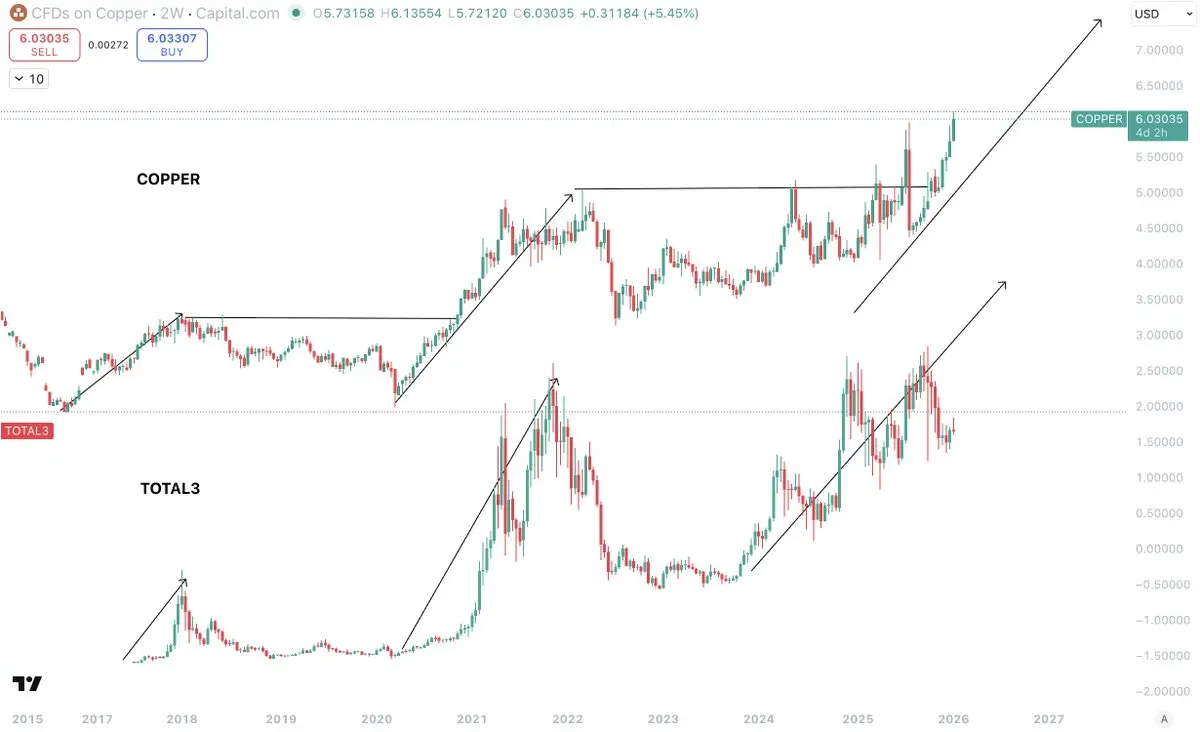
Every single sign you need is there.
Every single chart that matters is signalling to you the underlying liquidity shift and overall economic position.
And it all points one way.... up
Right now we have COPPER making new highs and entering price discovery.
COPPER performs best in periods just preceding and during economic expansion because it is the main metal used in all forms of infrastructure and development.
Which happen to be during times of liquidity expansion.
And as you can see, TOTAL3(alts), move in a very close lock step pattern with it.
That is not a coincidence guys.
Crypto is alwa
- Reward
- like
- Comment
- Repost
- Share
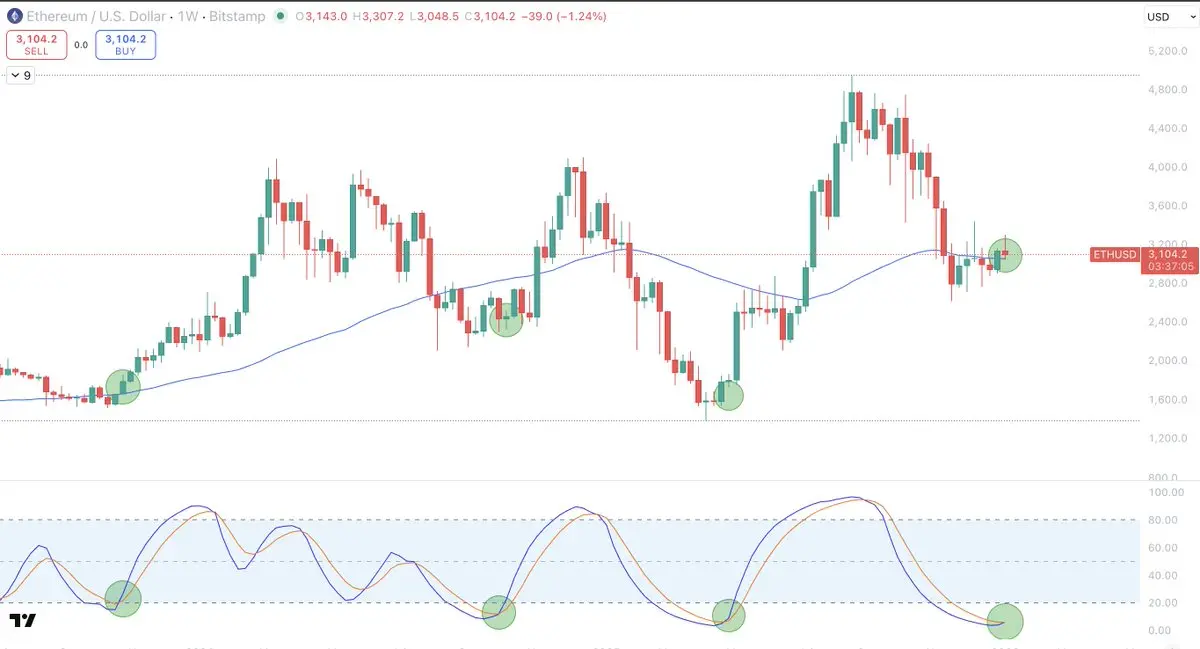
We are looking good here for a solid bounce on $ETH.
$ETH is looking much stronger than $BTC currently, and we observe this in the way in which ETH/BTC is also moving.
DSS Bressert 1W coiling for expansion whilst we are about to close the week above 50SMA.
If we see further weakness in BTC that could drag $ETH down a bit, but it's only going to be temporary.
$ETH is prepping for new highs.
- Reward
- like
- Comment
- Repost
- Share
There are many out there grave dancing on alts right now.
And that's expected.
Alts have been dominated by Bitcoin for years in a liquidity strapped environment.
But this is how the emotional curve of investing ruins people.
Let me explain...
You have Asset A at the highs, and asset B at the lows.
Owners of asset A are euphoric, and they victory lap their own asset and grave dance on Asset B to make themselves feel superior.
Owners of Asset B are sad and emotional, and seeing all of the FUD about their asset and the green candles of Asset A.... they capitulate ad chase, hungry to get a win.
Se
BTC-0,75%
- Reward
- like
- Comment
- Repost
- Share
Let me lay this out for your as clear as I can.
Liquidity leads, it always has.
And there is one massive fundamental difference between right now and previous cycles.
When liquidity breaks higher, it typically does it for an average of around 550 days.
Right now, it has been 250 days.
I don't know who still needs to hear this but cycles are about liquidity, not time.
We can see here that every single cycle...
Liquidity leads, breaks higher, then $IWM follows, and $ETH follows after.
Then when liquidity ranges, so do $IWM and $ETH.
This is because both $IWM and $ETH follow liquidity.
And right
ETH-2,03%
- Reward
- like
- Comment
- Repost
- Share
You just need to chill out.
I see so many stressing over the next 2% move Bitcoin makes and changing their bias.
Get it into your mind that we can sweep the lows at $80k, and it is fine.
Yeh, your alts will drop a bit, but are you selling them?
No.
So whether they drop a bit for a week, it doesn't matter.
I cannot tell you when the low of this reversal will be, but I feel as If I can very confidently say that this is the bottoming zone.
I have shared countless pieces of data that show why I believe this, and I have high conviction in the data.
Right now, Bitcoin is compressing above the 1D 50S
BTC-0,75%
- Reward
- like
- Comment
- Repost
- Share
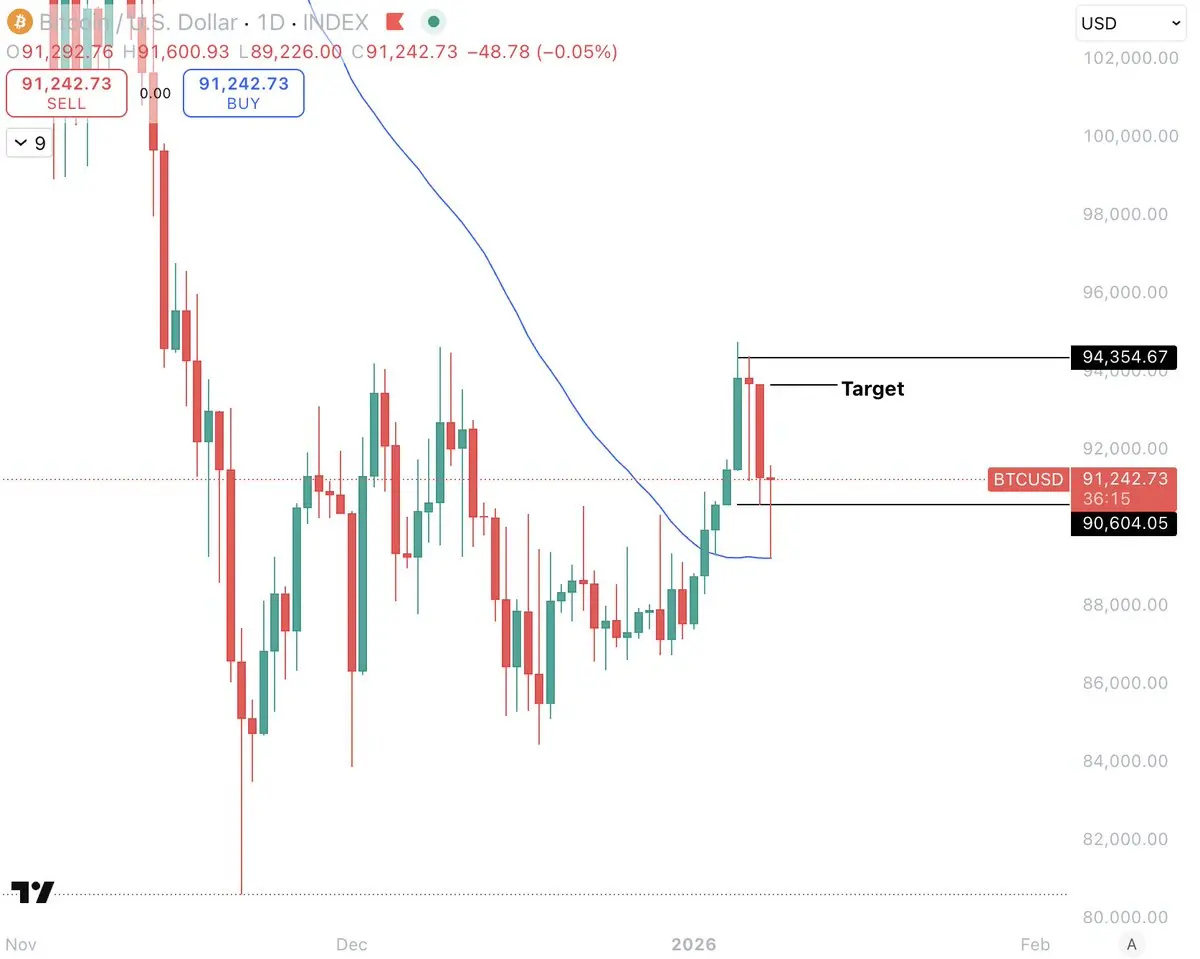
Eyeing a BTC long here.
Close the daily within the range and ill be targeting the previous daily candle high at $93,600.
Solid reaction from $89,200 where the 1D 50SMA and 4h 100/200SMA were all sitting.
There is also no wick on the top of the candle, and they usually get swept.
Using @breakoutprop
Close the daily within the range and ill be targeting the previous daily candle high at $93,600.
Solid reaction from $89,200 where the 1D 50SMA and 4h 100/200SMA were all sitting.
There is also no wick on the top of the candle, and they usually get swept.
Using @breakoutprop
BTC-0,75%
- Reward
- like
- Comment
- Repost
- Share