#GateGoldenTouch
#GateGoldenTouch #Gate金手指
The Moment Before the Touch — Where One Decision Changes Everything
I was sitting in front of the screen… but this time, the market felt different.
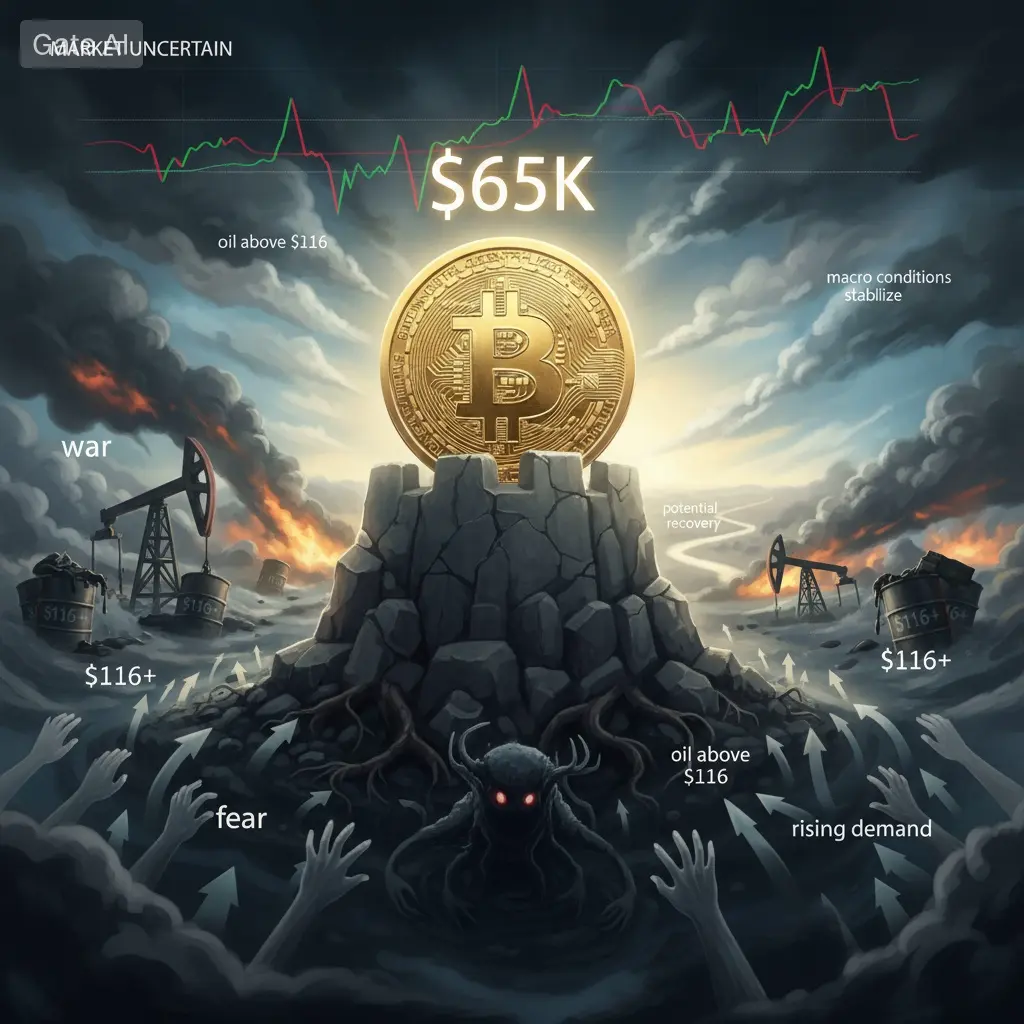
Not fully red. Not fully green. Just uncertainty.
Charts were moving — but without clear direction. Indicators were giving mixed signals. News wasn’t helping either. Everything felt… unclear.
And there I was, stuck with one simple question:
“Do I touch… or do I wait?”
That exact moment — that pause between action and patience — is where the real meaning of the Golden Touch begins to reveal itself.
Golden Touch Is Not Luck — It’s Timing
Most people think the Golden Touch means winning every trade.
But the truth is the opposite.
Golden Touch means:
Not touching every opportunity
Not chasing every pump
Not buying every dip blindly
Because not every move is meant for you.
Real traders understand one powerful truth:
Sometimes doing nothing is the strongest move you can make.
Every Click on Gate Is a Decision
On Gate, you’re not just trading — you’re making decisions.
And every decision carries weight:
An early entry → unnecessary risk
A late exit → lost opportunity
An emotional trade → broken discipline
But when you develop the Golden Touch…
Every action becomes intentional.
Every move becomes calculated.
Every risk is understood — not guessed.
The Difference That Changes Everything
Same chart.
Same coin.
Same market conditions.
Yet:
One trader loses
Another trader wins
The difference isn’t the market.
It isn’t even the strategy.
The difference is execution and self-control.
Golden Touch is when you stop reacting… and start deciding.
The Power of Waiting
The market always gives opportunities — just not all at once.
If you try to catch every move, you lose focus, energy, and capital.
But if you learn to wait:
Your entries become sharper
Your mistakes become fewer
Your decisions become clearer
Your capital stays protected
Patience is the core of the Golden Touch.
The Real Formula Behind the Golden Touch
There’s no secret indicator.
No hidden signal.
It’s a combination of four things:
Clarity — understanding what the market is actually doing
Control — managing your emotions under pressure
Confidence — trusting your strategy without hesitation
Calmness — staying stable when volatility rises
When these align…
Your touch becomes golden.
Final Thought
Golden Touch doesn’t mean you’re always right.
It means:
You don’t break after being wrong
You wait until the moment is clear
You act based on logic — not emotion
Gate gives you the platform.
The market gives you opportunities.
But the Golden Touch?
That’s built when you learn
when to act…
when to stop…
and when to simply wait.
Trade less. Think deeper. Touch wisely.
#GateGoldenTouch #Gate金手指
The Moment Before the Touch — Where One Decision Changes Everything
I was sitting in front of the screen… but this time, the market felt different.
Not fully red. Not fully green. Just uncertainty.
Charts were moving — but without clear direction. Indicators were giving mixed signals. News wasn’t helping either. Everything felt… unclear.
And there I was, stuck with one simple question:
“Do I touch… or do I wait?”
That exact moment — that pause between action and patience — is where the real meaning of the Golden Touch begins to reveal itself.
Golden Touch Is Not Luck — It’s Timing
Most people think the Golden Touch means winning every trade.
But the truth is the opposite.
Golden Touch means:
Not touching every opportunity
Not chasing every pump
Not buying every dip blindly
Because not every move is meant for you.
Real traders understand one powerful truth:
Sometimes doing nothing is the strongest move you can make.
Every Click on Gate Is a Decision
On Gate, you’re not just trading — you’re making decisions.
And every decision carries weight:
An early entry → unnecessary risk
A late exit → lost opportunity
An emotional trade → broken discipline
But when you develop the Golden Touch…
Every action becomes intentional.
Every move becomes calculated.
Every risk is understood — not guessed.
The Difference That Changes Everything
Same chart.
Same coin.
Same market conditions.
Yet:
One trader loses
Another trader wins
The difference isn’t the market.
It isn’t even the strategy.
The difference is execution and self-control.
Golden Touch is when you stop reacting… and start deciding.
The Power of Waiting
The market always gives opportunities — just not all at once.
If you try to catch every move, you lose focus, energy, and capital.
But if you learn to wait:
Your entries become sharper
Your mistakes become fewer
Your decisions become clearer
Your capital stays protected
Patience is the core of the Golden Touch.
The Real Formula Behind the Golden Touch
There’s no secret indicator.
No hidden signal.
It’s a combination of four things:
Clarity — understanding what the market is actually doing
Control — managing your emotions under pressure
Confidence — trusting your strategy without hesitation
Calmness — staying stable when volatility rises
When these align…
Your touch becomes golden.
Final Thought
Golden Touch doesn’t mean you’re always right.
It means:
You don’t break after being wrong
You wait until the moment is clear
You act based on logic — not emotion
Gate gives you the platform.
The market gives you opportunities.
But the Golden Touch?
That’s built when you learn
when to act…
when to stop…
and when to simply wait.
Trade less. Think deeper. Touch wisely.