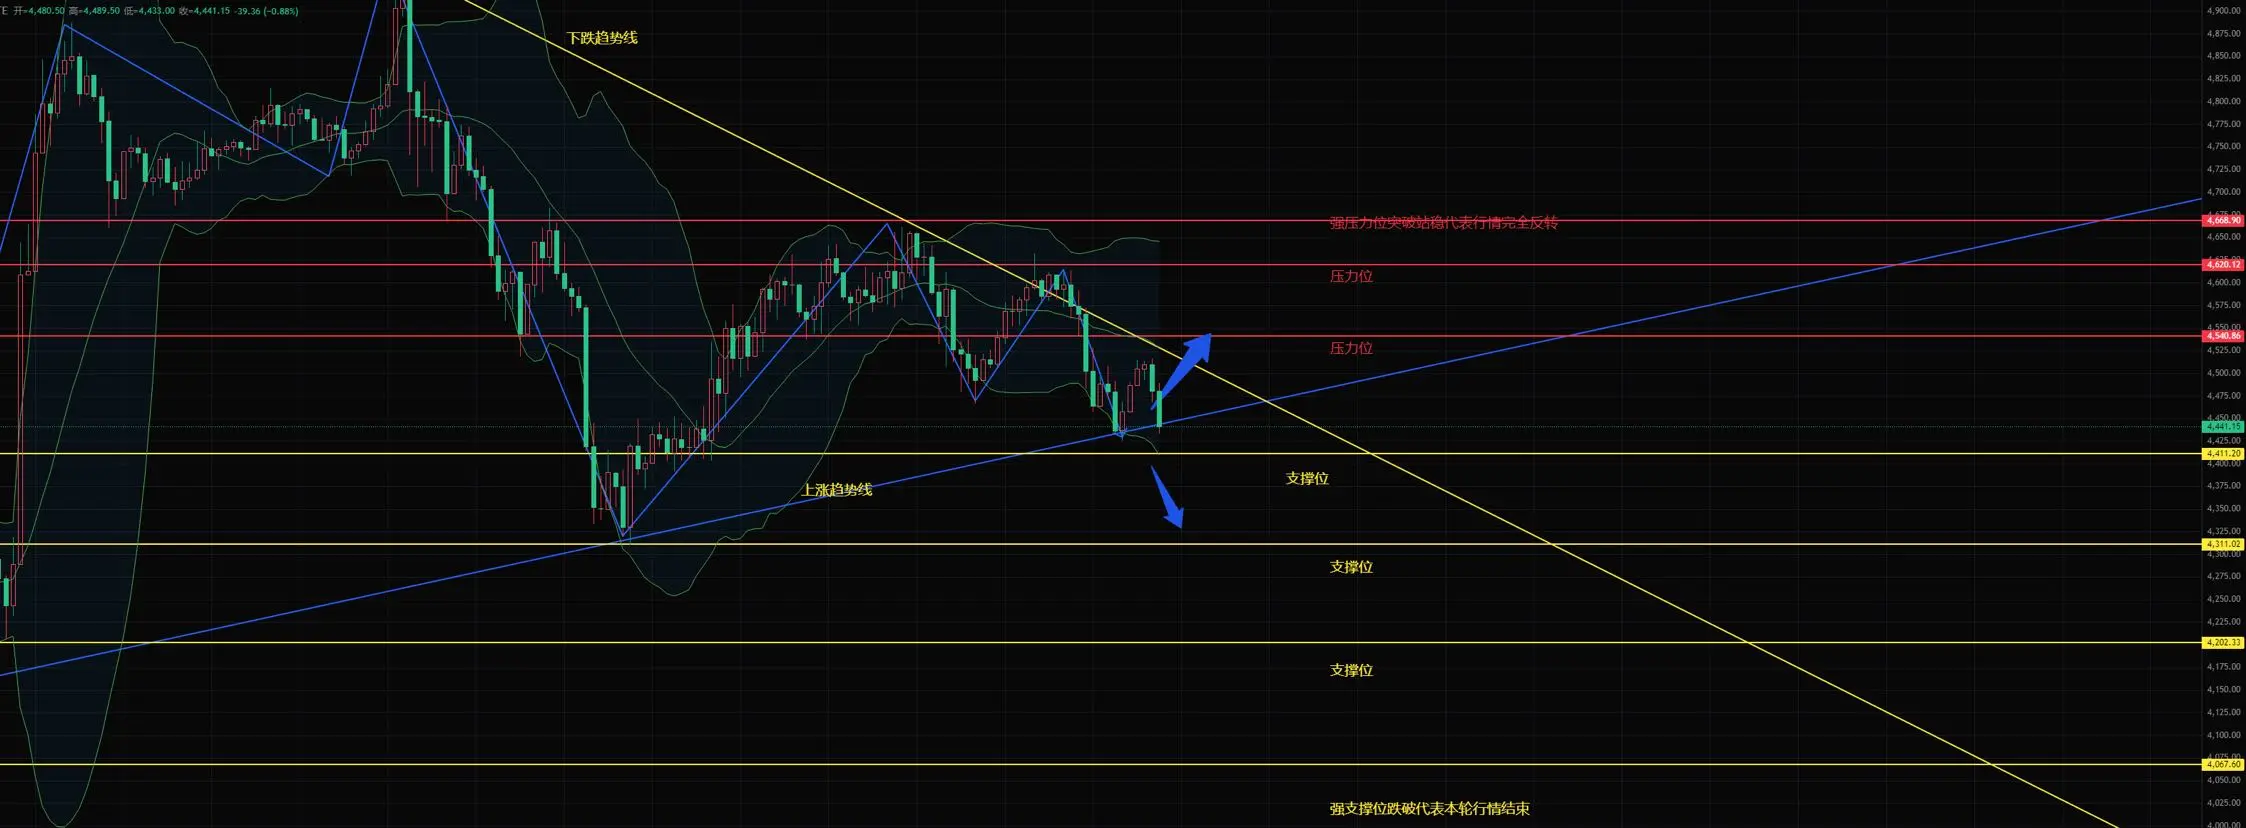
Ethereum yesterday review
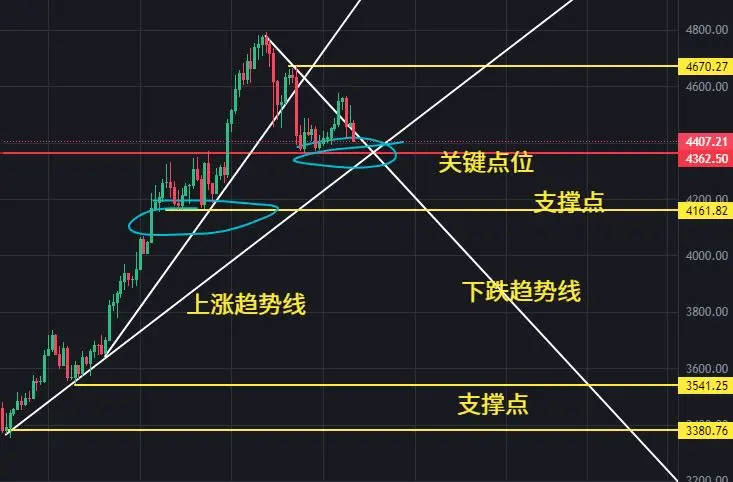
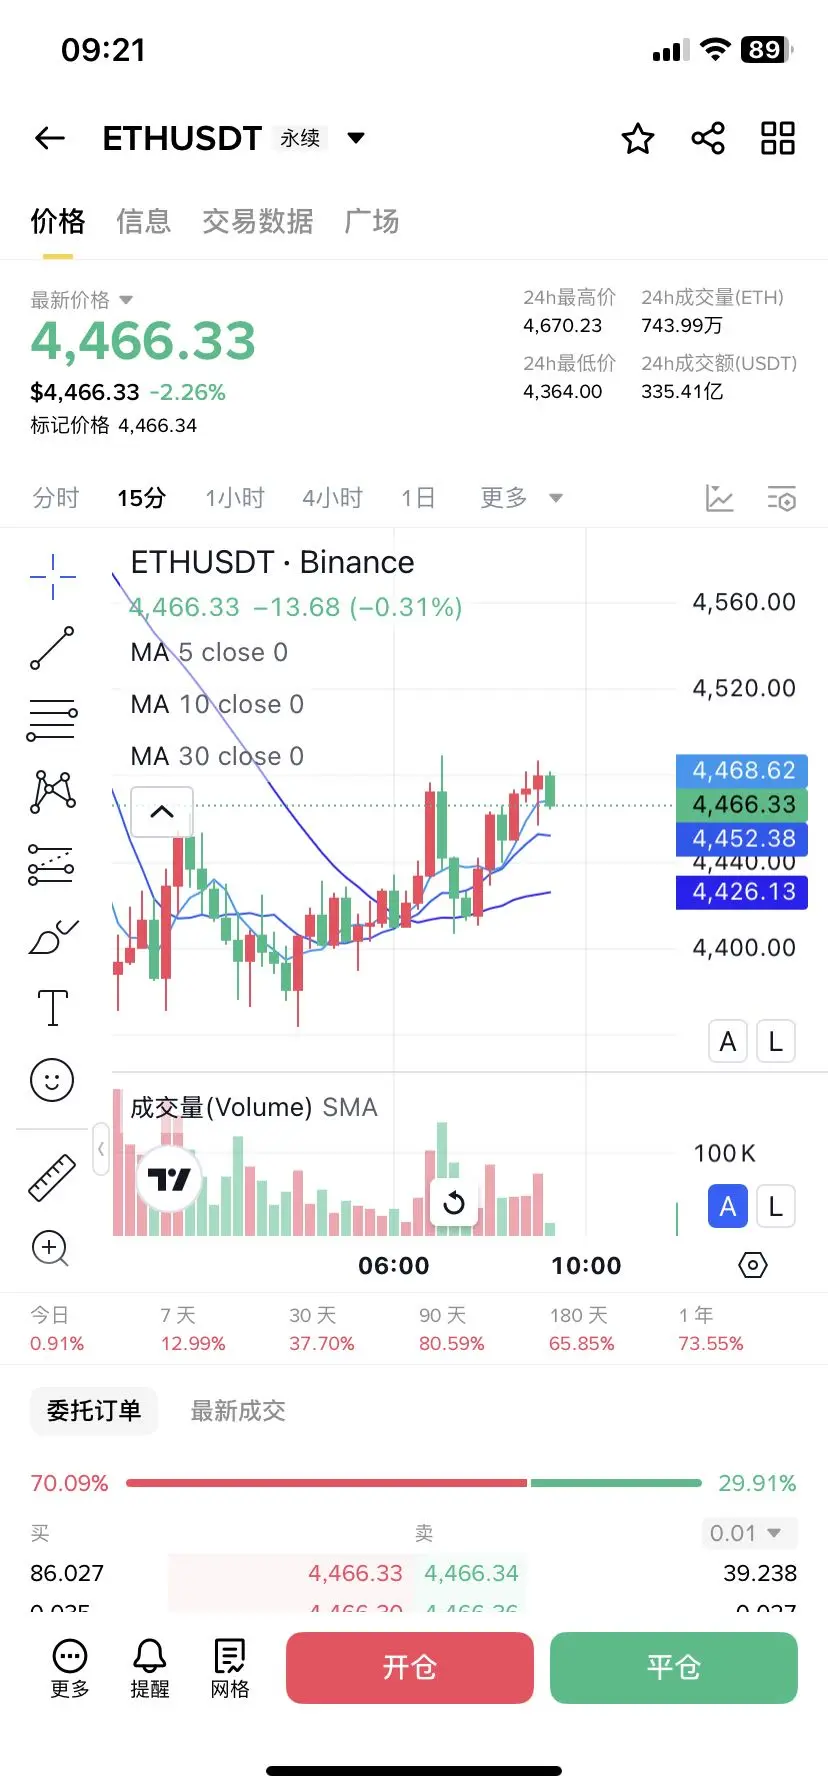
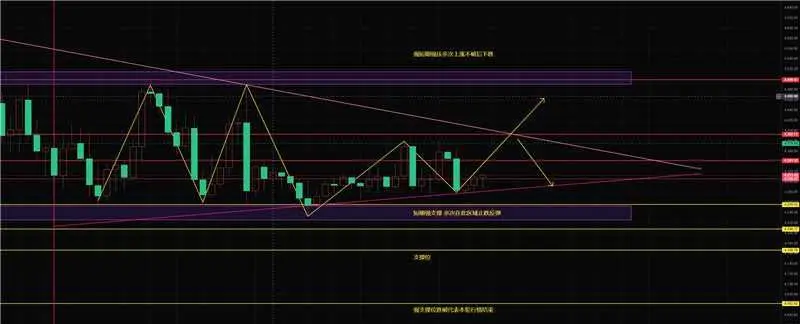
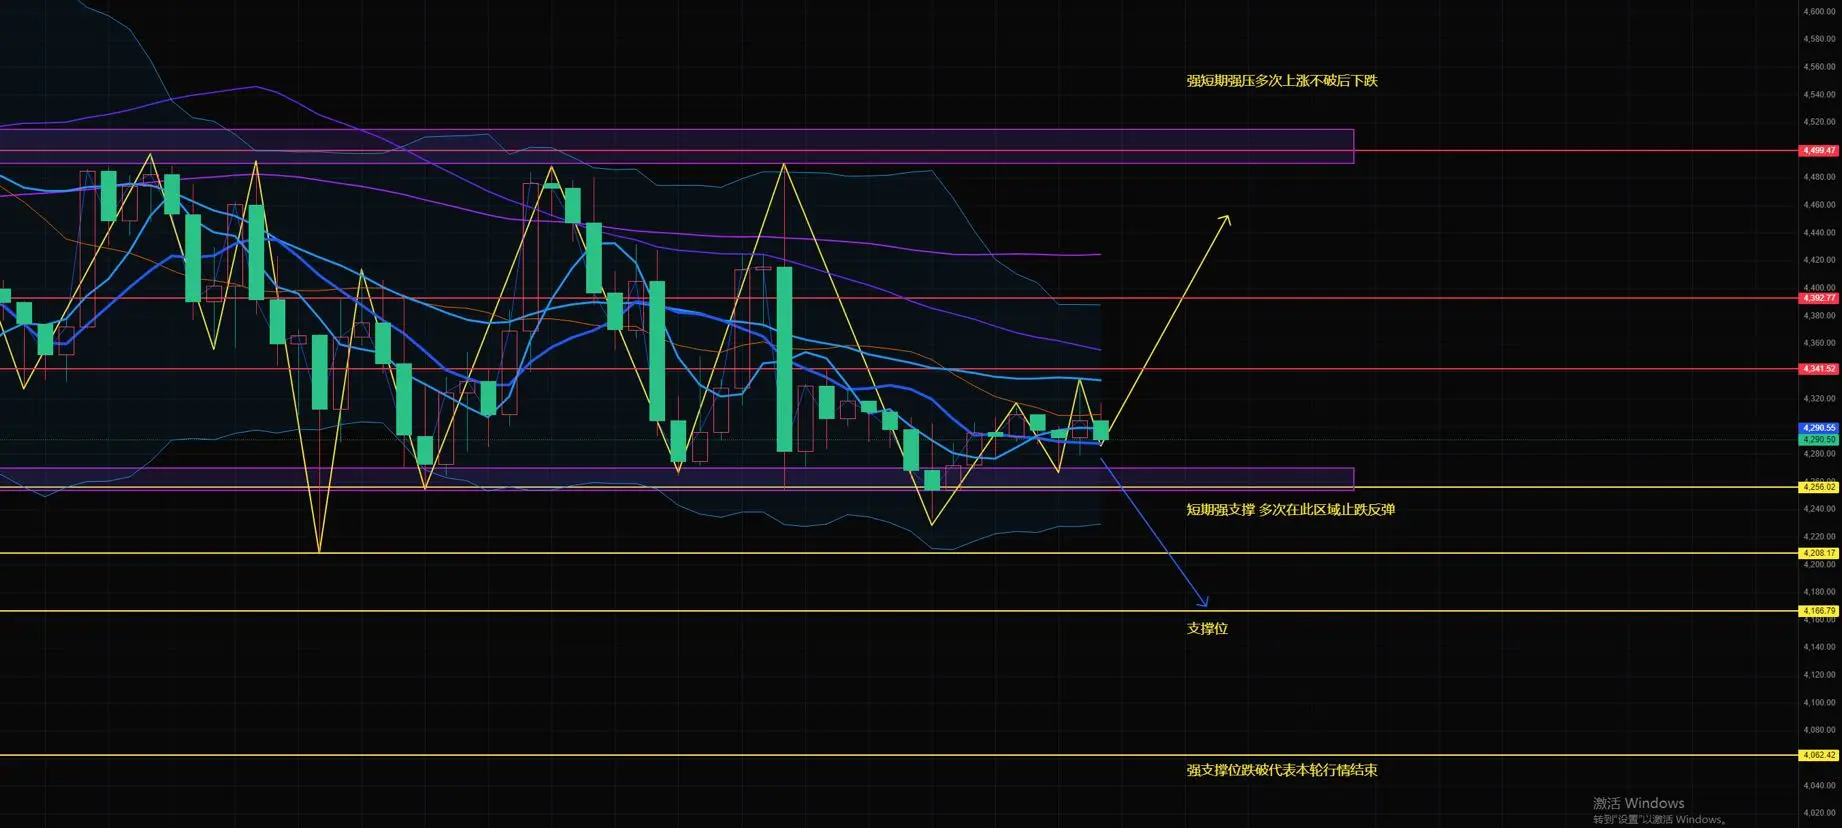
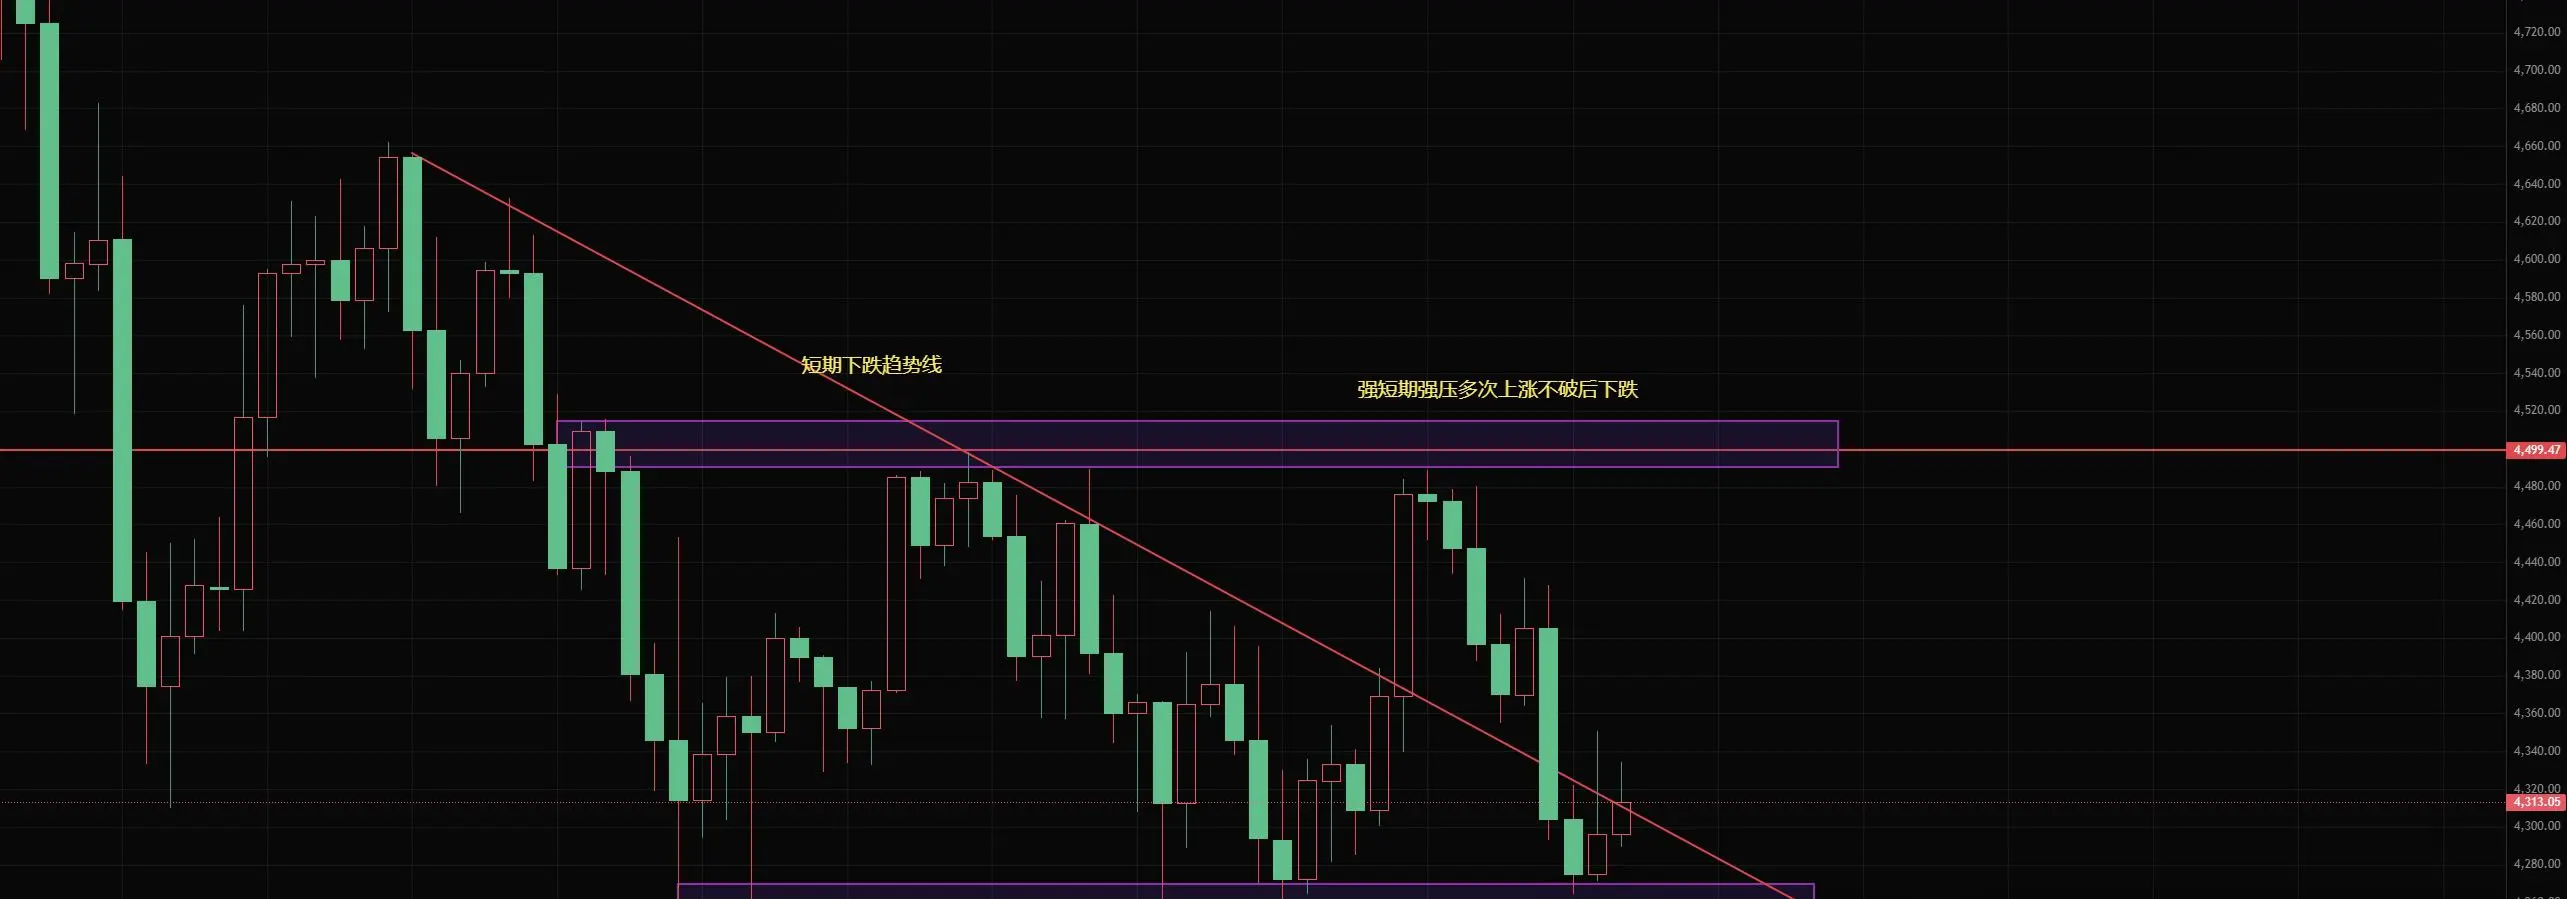
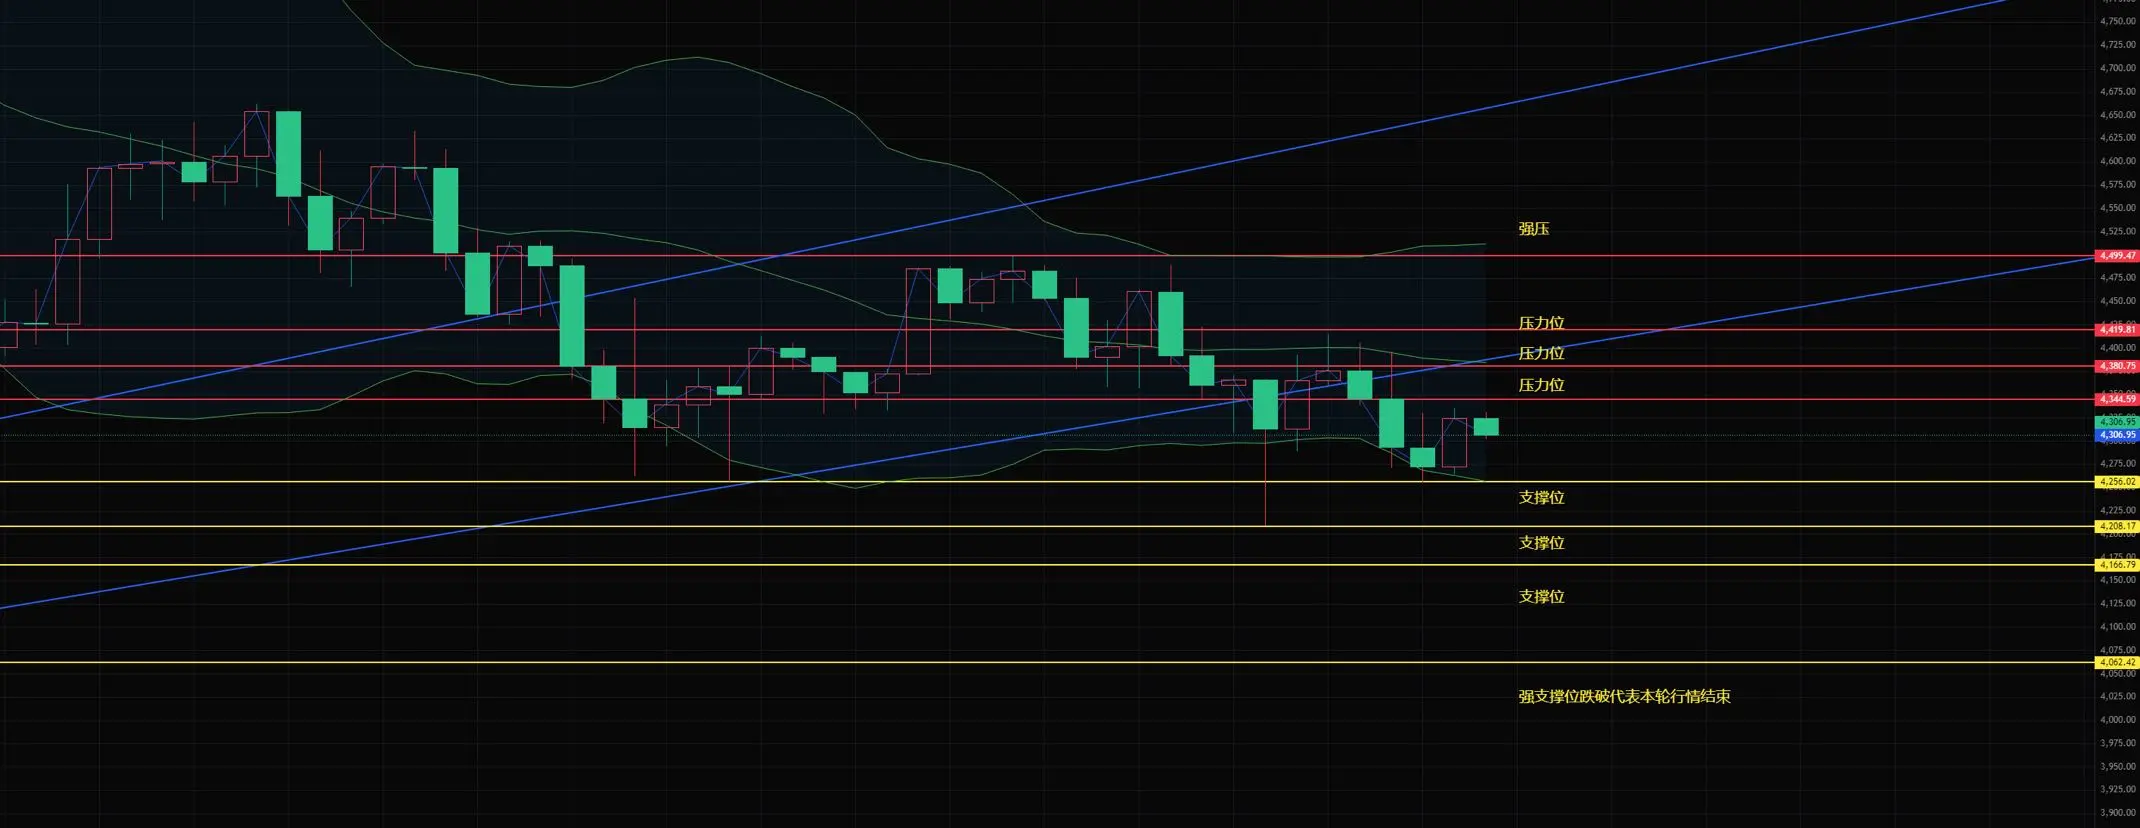
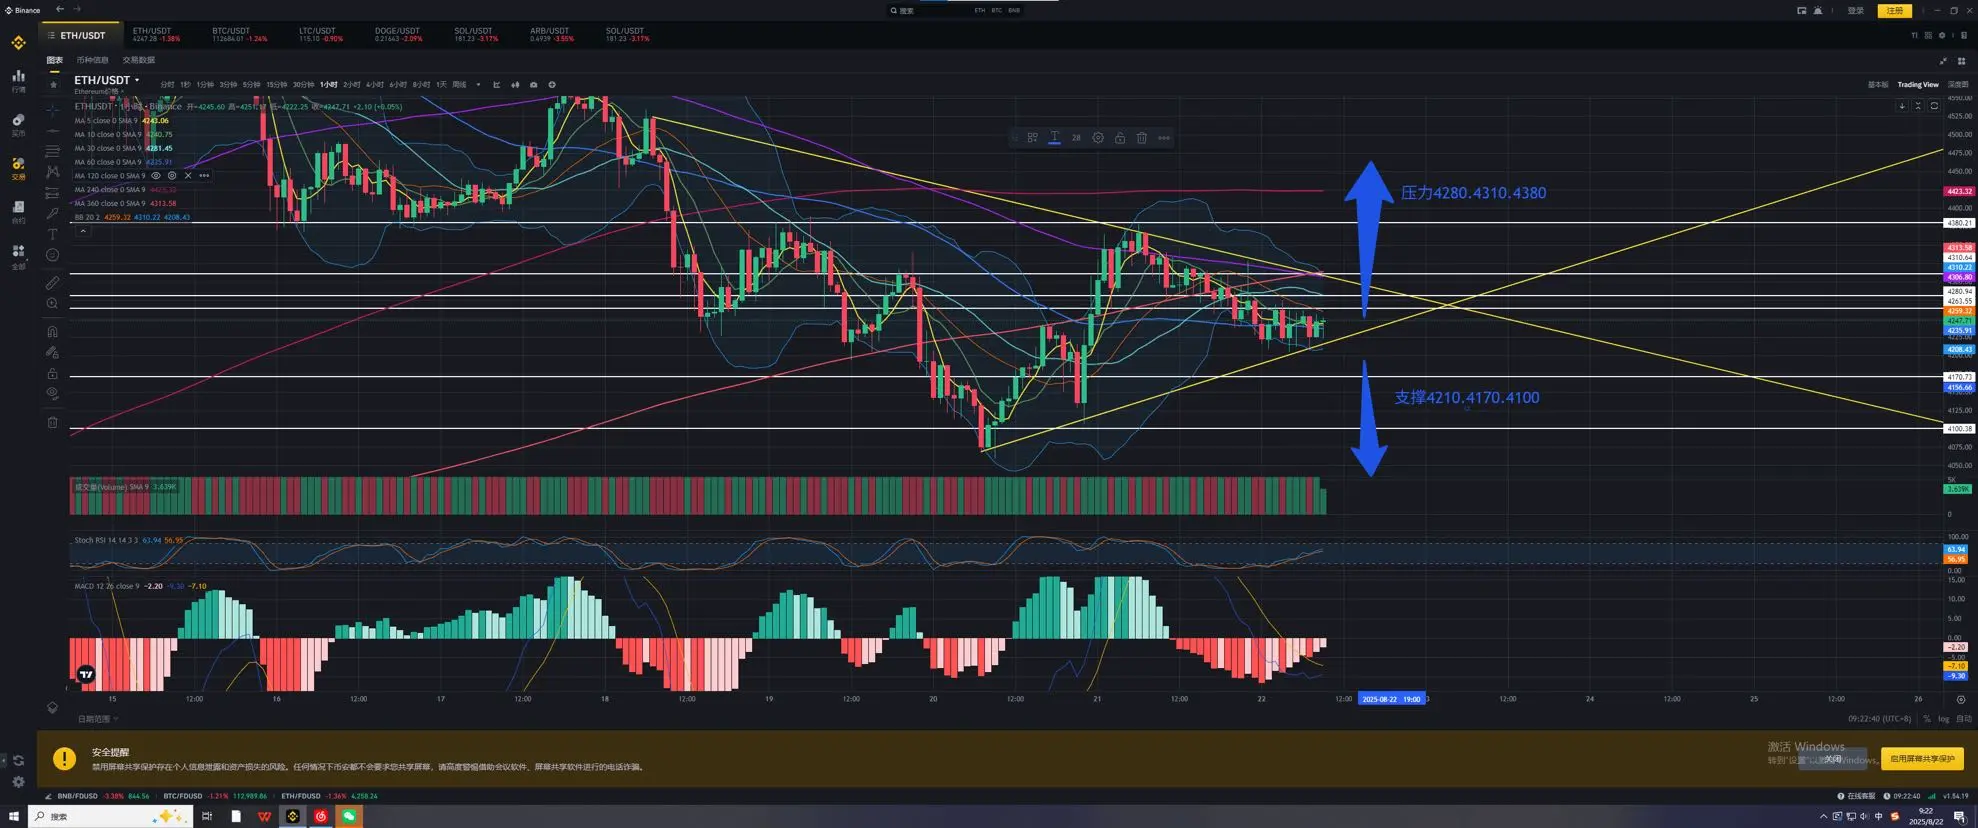
Yesterday, the Ethereum in Lingcheng quickly rebounded after touching the daily midline at 4060, skyrocketing to a maximum of 4300 by midnight. Following the previous day's cliff-like drop of 300 points, it surged again by 300 points yesterday, making it an incredibly thrilling high-altitude bungee jump. From yesterday's news perspective, there were no obvious positive or negative stimuli; it can be seen as a completion of a wave of alternation between old and new major capital. The Federal Reserve's meeting minutes released in the early morning regarding interest rat
View OriginalYesterday, the Ethereum in Lingcheng quickly rebounded after touching the daily midline at 4060, skyrocketing to a maximum of 4300 by midnight. Following the previous day's cliff-like drop of 300 points, it surged again by 300 points yesterday, making it an incredibly thrilling high-altitude bungee jump. From yesterday's news perspective, there were no obvious positive or negative stimuli; it can be seen as a completion of a wave of alternation between old and new major capital. The Federal Reserve's meeting minutes released in the early morning regarding interest rat