Trade
Trading Type
Spot
Trade crypto freely
Pre-Market
Trade new tokens before they are officially listed
Margin
Magnify your profit with leverage
Convert & Block Trading
0 Fees
Trade any size with no fees and no slippage
Alpha
Points
Get promising tokens in streamlined on-chain trading
Leveraged Tokens
Get exposure to leveraged positions simply
Futures
Futures
Hundreds of contracts settled in USDT or BTC
Options
HOT
Trade European-style vanilla options
Unified Account
Maximize your capital efficiency
Demo Trading
Futures Kickoff
Get prepared for your futures trading
Futures Events
Participate in events to win generous rewards
Demo Trading
Use virtual funds to experience risk-free trading
Earn
Launch
CandyDrop
Collect candies to earn airdrops
Launchpool
Quick staking, earn potential new tokens
HODLer Airdrop
Hold GT and get massive airdrops for free
Launchpad
Be early to the next big token project
Alpha Points
NEW
Trade on-chain assets and enjoy airdrop rewards!
Futures Points
NEW
Earn futures points and claim airdrop rewards
Investment
Simple Earn
Earn interests with idle tokens
Auto-Invest
Auto-invest on a regular basis
Dual Investment
Buy low and sell high to take profits from price fluctuations
Soft Staking
Earn rewards with flexible staking
Crypto Loan
0 Fees
Pledge one crypto to borrow another
Lending Center
One-stop lending hub
VIP Wealth Hub
Customized wealth management empowers your assets growth
Private Wealth Management
Customized asset management to grow your digital assets
Quant Fund
Top asset management team helps you profit without hassle
Staking
Stake cryptos to earn in PoS products
Smart Leverage
NEW
No forced liquidation before maturity, worry-free leveraged gains
GUSD Minting
Use USDT/USDC to mint GUSD for treasury-level yields
More
Promotions
Activity Center
Join activities and win big cash prizes and exclusive merch
Referral
20 USDT
Earn 40% commission or up to 500 USDT rewards
Announcements
Announcements of new listings, activities, upgrades, etc
Gate Blog
Crypto industry articles
VIP Services
Huge fee discounts
Proof of Reserves
Gate promises 100% proof of reserves
Affiliate
Enjoy exclusive commissions and earn high returns
# FHEUSDT
1.27K
MasterPi
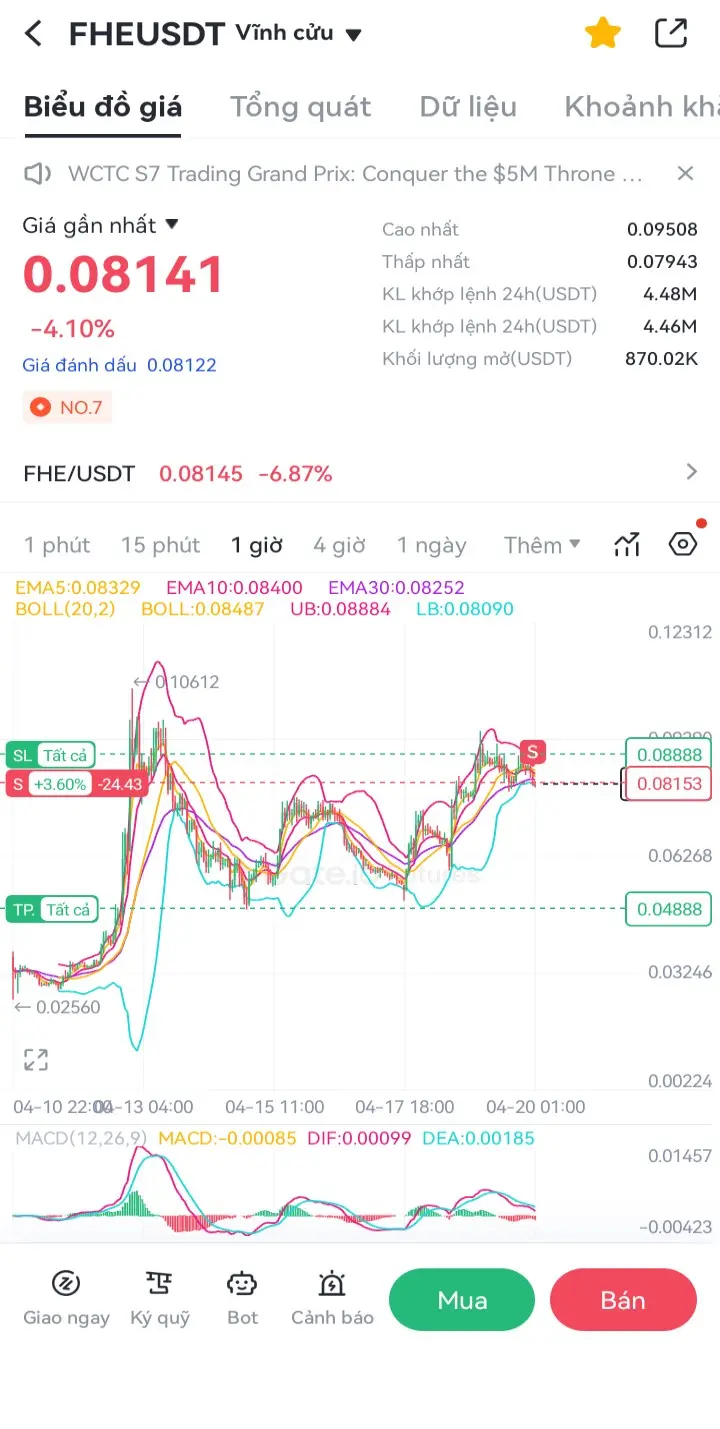
#FHEUSDT - #FHE the chart shows a lot of butterflies, mother butterfly - child butterfly - butterfly in butterfly. The day after the bullish move it will immediately be bearish. Brothers, quickly place a full SHORT order and no need to stop lost. Take profit can be set above 1000% and then turn off the computer, go to sleep and dream beautifully 🚀🚀🚀👍
FHE4,74%
- Reward
- 1
- 3
- Repost
- Share
abazi:
The butterfly flew away.View More

- Reward
- like
- Comment
- Repost
- Share
#FHEUSDT
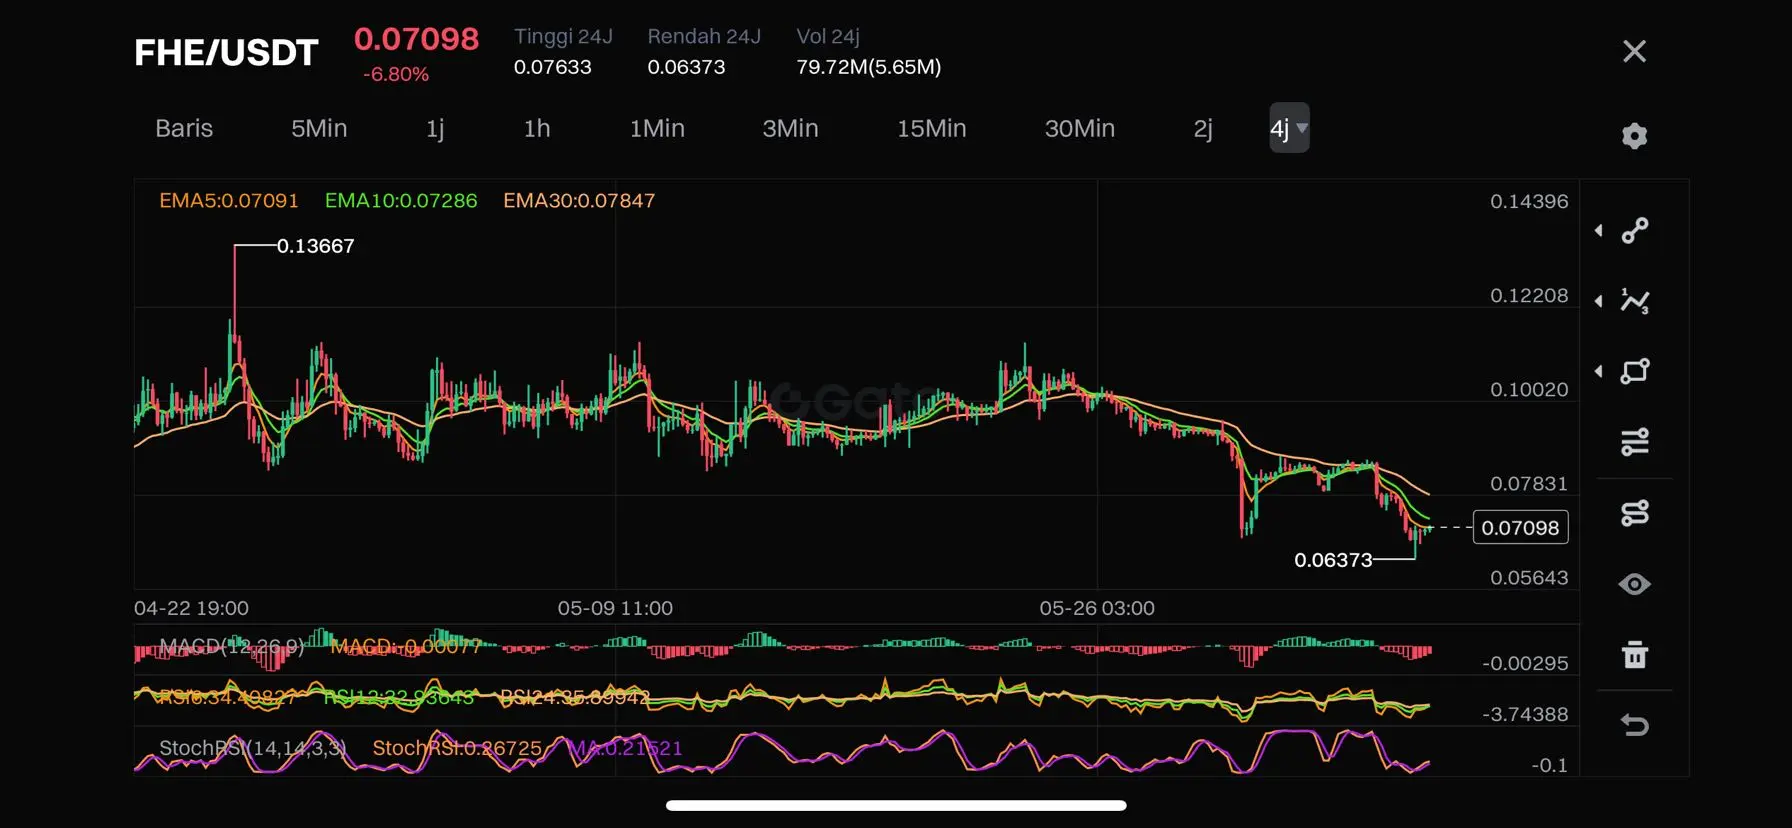
technical analysis FHE
timeframe 4 hours - June 06, 2025
Based on the technical analysis of the FHE/USDT chart, here are the recommended safe buy prices in the spot:
1. Support Levels :
- 24J Low: 0.06373 (level support terkuat)
- Fibonacci Level: 0.05643 (extreme level if a deeper correction occurs)
2. Moving Averages :
- EMA10 : 0.07286 ( is above the current price, indicating resistance)
- EMA50 : 0.07091 (potential level for rebound if the price approaches )
3. Current Price: 0.07098 (-6.80% from the 24H high ), currently in a downtrend.
Safe Buy Price Recommend
View Originaltechnical analysis FHE
timeframe 4 hours - June 06, 2025
Based on the technical analysis of the FHE/USDT chart, here are the recommended safe buy prices in the spot:
1. Support Levels :
- 24J Low: 0.06373 (level support terkuat)
- Fibonacci Level: 0.05643 (extreme level if a deeper correction occurs)
2. Moving Averages :
- EMA10 : 0.07286 ( is above the current price, indicating resistance)
- EMA50 : 0.07091 (potential level for rebound if the price approaches )
3. Current Price: 0.07098 (-6.80% from the 24H high ), currently in a downtrend.
Safe Buy Price Recommend
- Reward
- like
- Comment
- Repost
- Share
#FHEUSDT
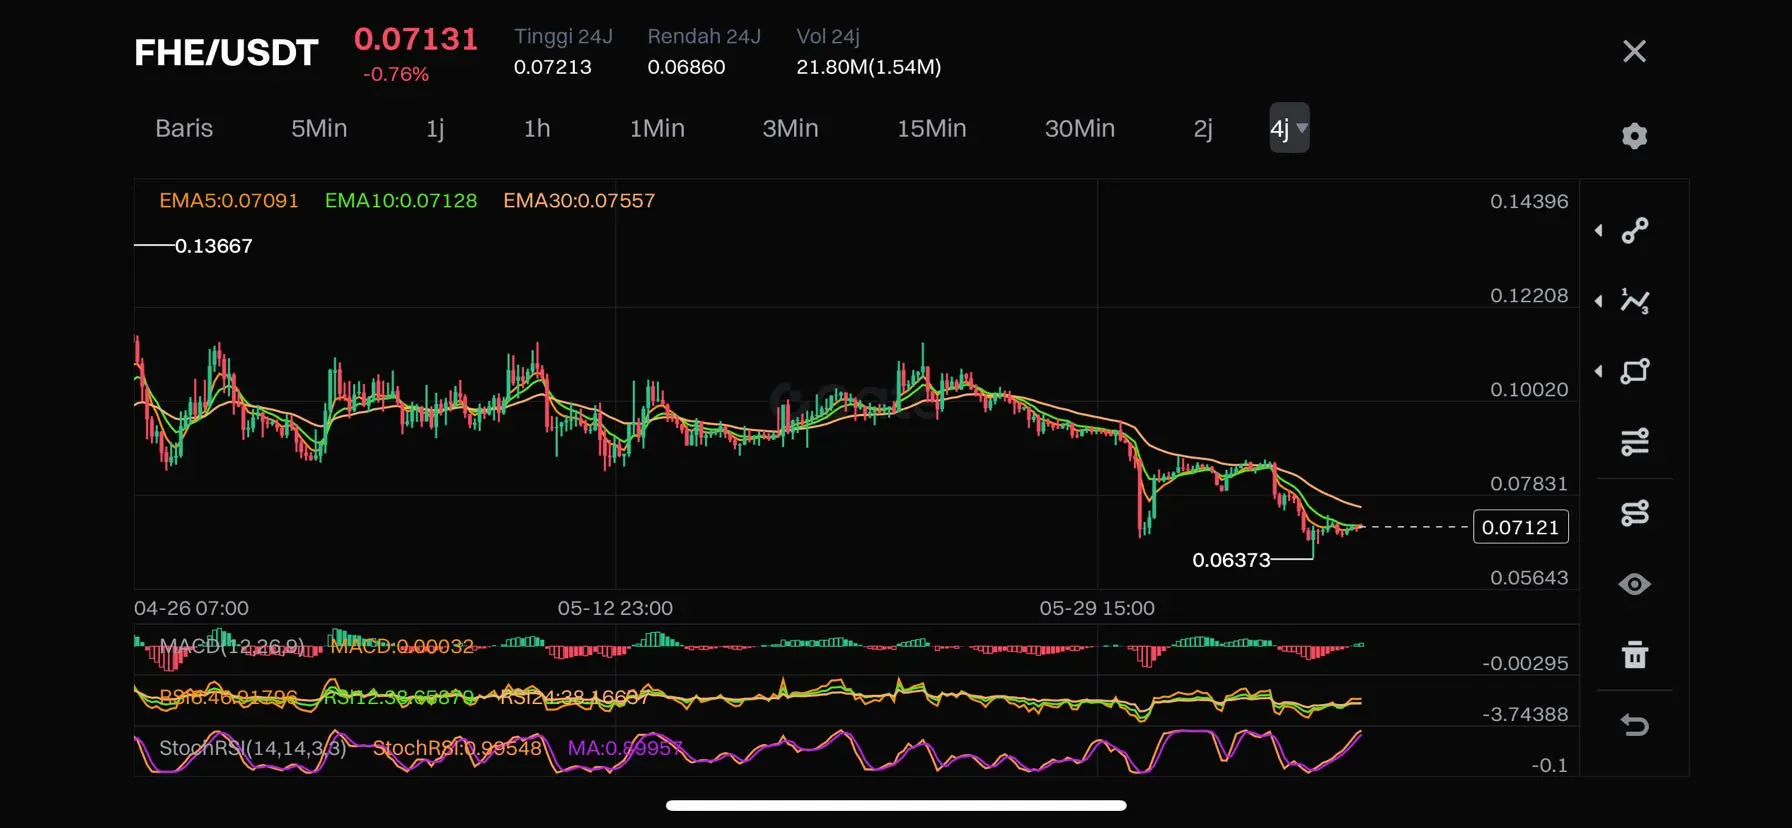
Technical Analysis FHE/USDT
(Timeframe 4H) - June 7, 2025
1. Main Trend: Weak Bearish Start Consolidation
• The price has experienced a prolonged downward trend since mid-May.
• The last lowest point in the area of 0.06373 USDT, then rebounded to the area of 0.07121 USDT.
• Currently, the price is just below the EMA30, EMA10, and EMA5, indicating that bearish pressure is still dominant but starting to weaken.
⸻
2. Moving Average Indicator (EMA)
• EMA5 (0.07091) < EMA10 (0.07128) < EMA30 (0.07557)
This indicates that the structure is still bearish, but there is beginning potential
FHE4,74%
- Reward
- 1
- 1
- Repost
- Share
BIRJA :
:
Thanks for the your sharing 💎Load More
Join 40M users in our growing community
⚡️ Join 40M users in the crypto craze discussion
💬 Engage with your favorite top creators
👍 See what interests you
Trending Topics
8.94K Popularity
160K Popularity
31.08K Popularity
85.88K Popularity
2.61K Popularity
3.51K Popularity
2.76K Popularity
19.91K Popularity
87.22K Popularity
22.25K Popularity
211.48K Popularity
9.81K Popularity
11K Popularity
2.12K Popularity
219.5K Popularity
News
View MoreXMR (Monero) increased by 2.09% in the last 24 hours
2 m
The U.S. Financial Accounting Standards Board plans to explore classifying some stablecoins as "cash equivalents" by 2026.
2 m
Shaw: The threat of quantum computing to Bitcoin is nonsense; speculators know nothing.
3 m
Analyst: BTC large fund turnover activity declines, with on-chain single transaction amounts dropping nearly 47% compared to mid-month
4 m
Investing 69.855 billion yen to increase BTC holdings, Metaplanet's holdings rise to 35,102 coins. Is the risk being transferred to shareholders?
5 m
Pin