Trade
Trading Type
Spot
Trade crypto freely
Pre-Market
Trade new tokens before they are officially listed
Margin
Magnify your profit with leverage
Convert & Block Trading
0 Fees
Trade any size with no fees and no slippage
Alpha
Points
Get promising tokens in streamlined on-chain trading
Leveraged Tokens
Get exposure to leveraged positions simply
Futures
Futures
Hundreds of contracts settled in USDT or BTC
Options
HOT
Trade European-style vanilla options
Unified Account
Maximize your capital efficiency
Demo Trading
Futures Kickoff
Get prepared for your futures trading
Futures Events
Participate in events to win generous rewards
Demo Trading
Use virtual funds to experience risk-free trading
Earn
Launch
CandyDrop
Collect candies to earn airdrops
Launchpool
Quick staking, earn potential new tokens
HODLer Airdrop
Hold GT and get massive airdrops for free
Launchpad
Be early to the next big token project
Alpha Points
NEW
Trade on-chain assets and enjoy airdrop rewards!
Futures Points
NEW
Earn futures points and claim airdrop rewards
Investment
Simple Earn
Earn interests with idle tokens
Auto-Invest
Auto-invest on a regular basis
Dual Investment
Buy low and sell high to take profits from price fluctuations
Soft Staking
Earn rewards with flexible staking
Crypto Loan
0 Fees
Pledge one crypto to borrow another
Lending Center
One-stop lending hub
VIP Wealth Hub
Customized wealth management empowers your assets growth
Private Wealth Management
Customized asset management to grow your digital assets
Quant Fund
Top asset management team helps you profit without hassle
Staking
Stake cryptos to earn in PoS products
Smart Leverage
NEW
No forced liquidation before maturity, worry-free leveraged gains
GUSD Minting
Use USDT/USDC to mint GUSD for treasury-level yields
More
Promotions
Activity Center
Join activities and win big cash prizes and exclusive merch
Referral
20 USDT
Earn 40% commission or up to 500 USDT rewards
Announcements
Announcements of new listings, activities, upgrades, etc
Gate Blog
Crypto industry articles
VIP Services
Huge fee discounts
Proof of Reserves
Gate promises 100% proof of reserves
# ChartAnalyser
632
NoyamaCrypto
#BTC
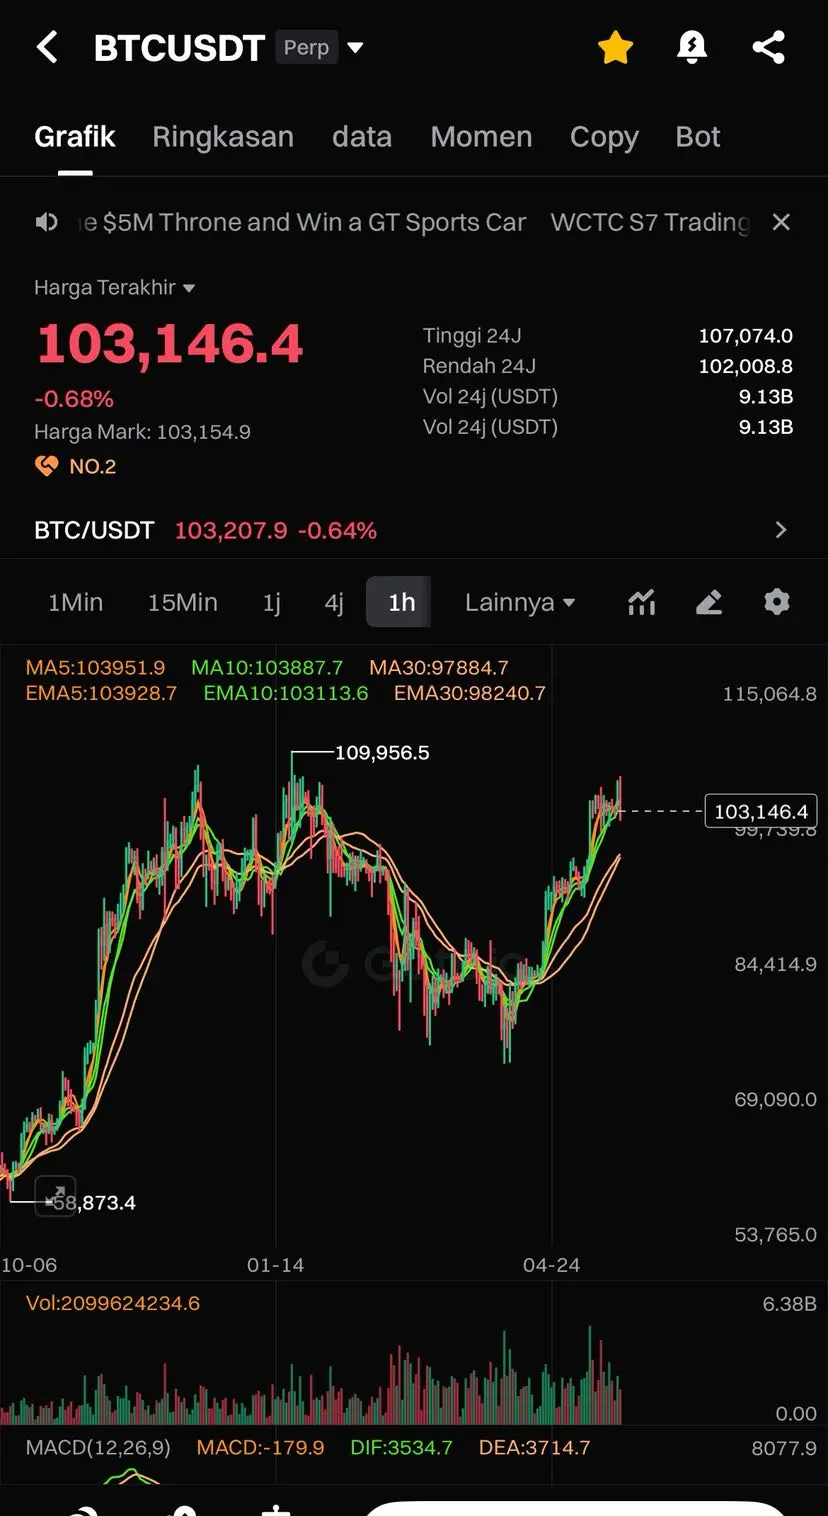
📊 BTC/USDT Analysis - May 19, 2025
⏰ Timeframe: 1 Hour
📍 Current price: $103.146
Technical Indicators:
• MA and short EMA (5 & 10) are still golden cross ➜ short-term trend remains positive
• MACD shows positive momentum even though the volume is starting to decrease
• Strong support: $102K
• Nearest resistance: $107K
Conclusion:
If BTC can stay above the EMA-10 and does not break down below $102K, the chance to retest $107K–$109K is still wide open. However, volume needs to increase to push for further gains.
🚨 Always be cautious of false breakouts, use disciplined risk managemen
View Original📊 BTC/USDT Analysis - May 19, 2025
⏰ Timeframe: 1 Hour
📍 Current price: $103.146
Technical Indicators:
• MA and short EMA (5 & 10) are still golden cross ➜ short-term trend remains positive
• MACD shows positive momentum even though the volume is starting to decrease
• Strong support: $102K
• Nearest resistance: $107K
Conclusion:
If BTC can stay above the EMA-10 and does not break down below $102K, the chance to retest $107K–$109K is still wide open. However, volume needs to increase to push for further gains.
🚨 Always be cautious of false breakouts, use disciplined risk managemen
- Reward
- 1
- Comment
- Repost
- Share
#FHEUSDT
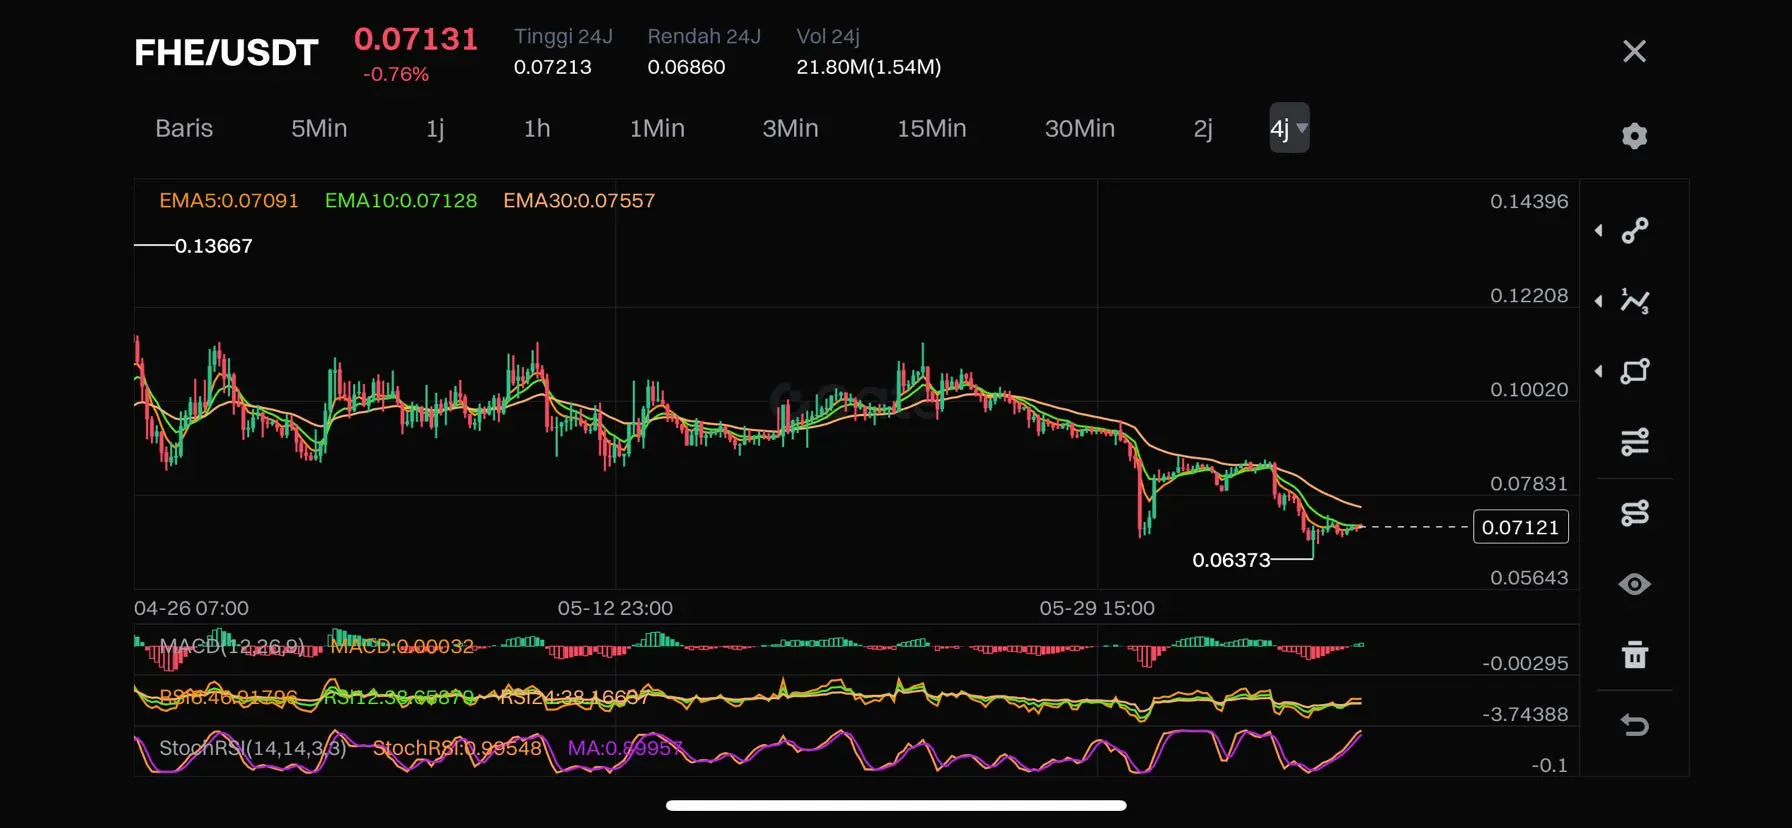
Technical Analysis FHE/USDT
(Timeframe 4H) - June 7, 2025
1. Main Trend: Weak Bearish Start Consolidation
• The price has experienced a prolonged downward trend since mid-May.
• The last lowest point in the area of 0.06373 USDT, then rebounded to the area of 0.07121 USDT.
• Currently, the price is just below the EMA30, EMA10, and EMA5, indicating that bearish pressure is still dominant but starting to weaken.
⸻
2. Moving Average Indicator (EMA)
• EMA5 (0.07091) < EMA10 (0.07128) < EMA30 (0.07557)
This indicates that the structure is still bearish, but there is beginning potential
FHE2,03%
- Reward
- 1
- 1
- Repost
- Share
BIRJA:
Thanks for the your sharing 💎Load More
Join 40M users in our growing community
⚡️ Join 40M users in the crypto craze discussion
💬 Engage with your favorite top creators
👍 See what interests you
Trending Topics
16.63K Popularity
32.02K Popularity
43.08K Popularity
93.58K Popularity
3.28K Popularity
5.03K Popularity
165.46K Popularity
20.44K Popularity
87.87K Popularity
24.71K Popularity
215.38K Popularity
11.03K Popularity
11.61K Popularity
2.71K Popularity
221.68K Popularity
News
View MoreTurkmenistan legalizes cryptocurrency mining and trading, but still bans its use as a means of payment
36 m
Analysis: The USDC/USDT premium index resonates with market liquidity indicators, and a rebound may occur in the short term.
1 h
Strategy stock closed the year at $151.95, marking the first six consecutive months of decline after adopting the BTC Treasury Strategy
2 h
Vitalik Buterin: The mission of Ethereum is to build the world computer and serve as the core infrastructure of the internet.
2 h
Bitcoin Breaks Decade-Long Four-Year Cycle Pattern in 2025
2 h
Pin