# $XLM

209
$XLM ‌USDT : The daily and 4h trends are firmly bearish, with price below key moving averages. However, the 1h chart shows a temporary bounce above its EMA50, offering a high-probability short entry. The catalyst is momentum fading: we wait for the 15-minute RSI to drop back below 50, signaling the bounce is over. This creates a precise trigger to enter the prevailing downtrend with a clear risk level, targeting the next support zones. The setup aligns the bigger picture with a tactical entry.
Actionable Setup Now (SHORT)
Entry: market at 0.221813 – 0.222751
TP1: 0.21947
TP2: 0.218532
TP3: 0.
XLM2,09%
post-image
post-image
[The user has shared his/her trading data. Go to the App to view more.]
  • Reward
  • Comment
  • Repost
  • Share
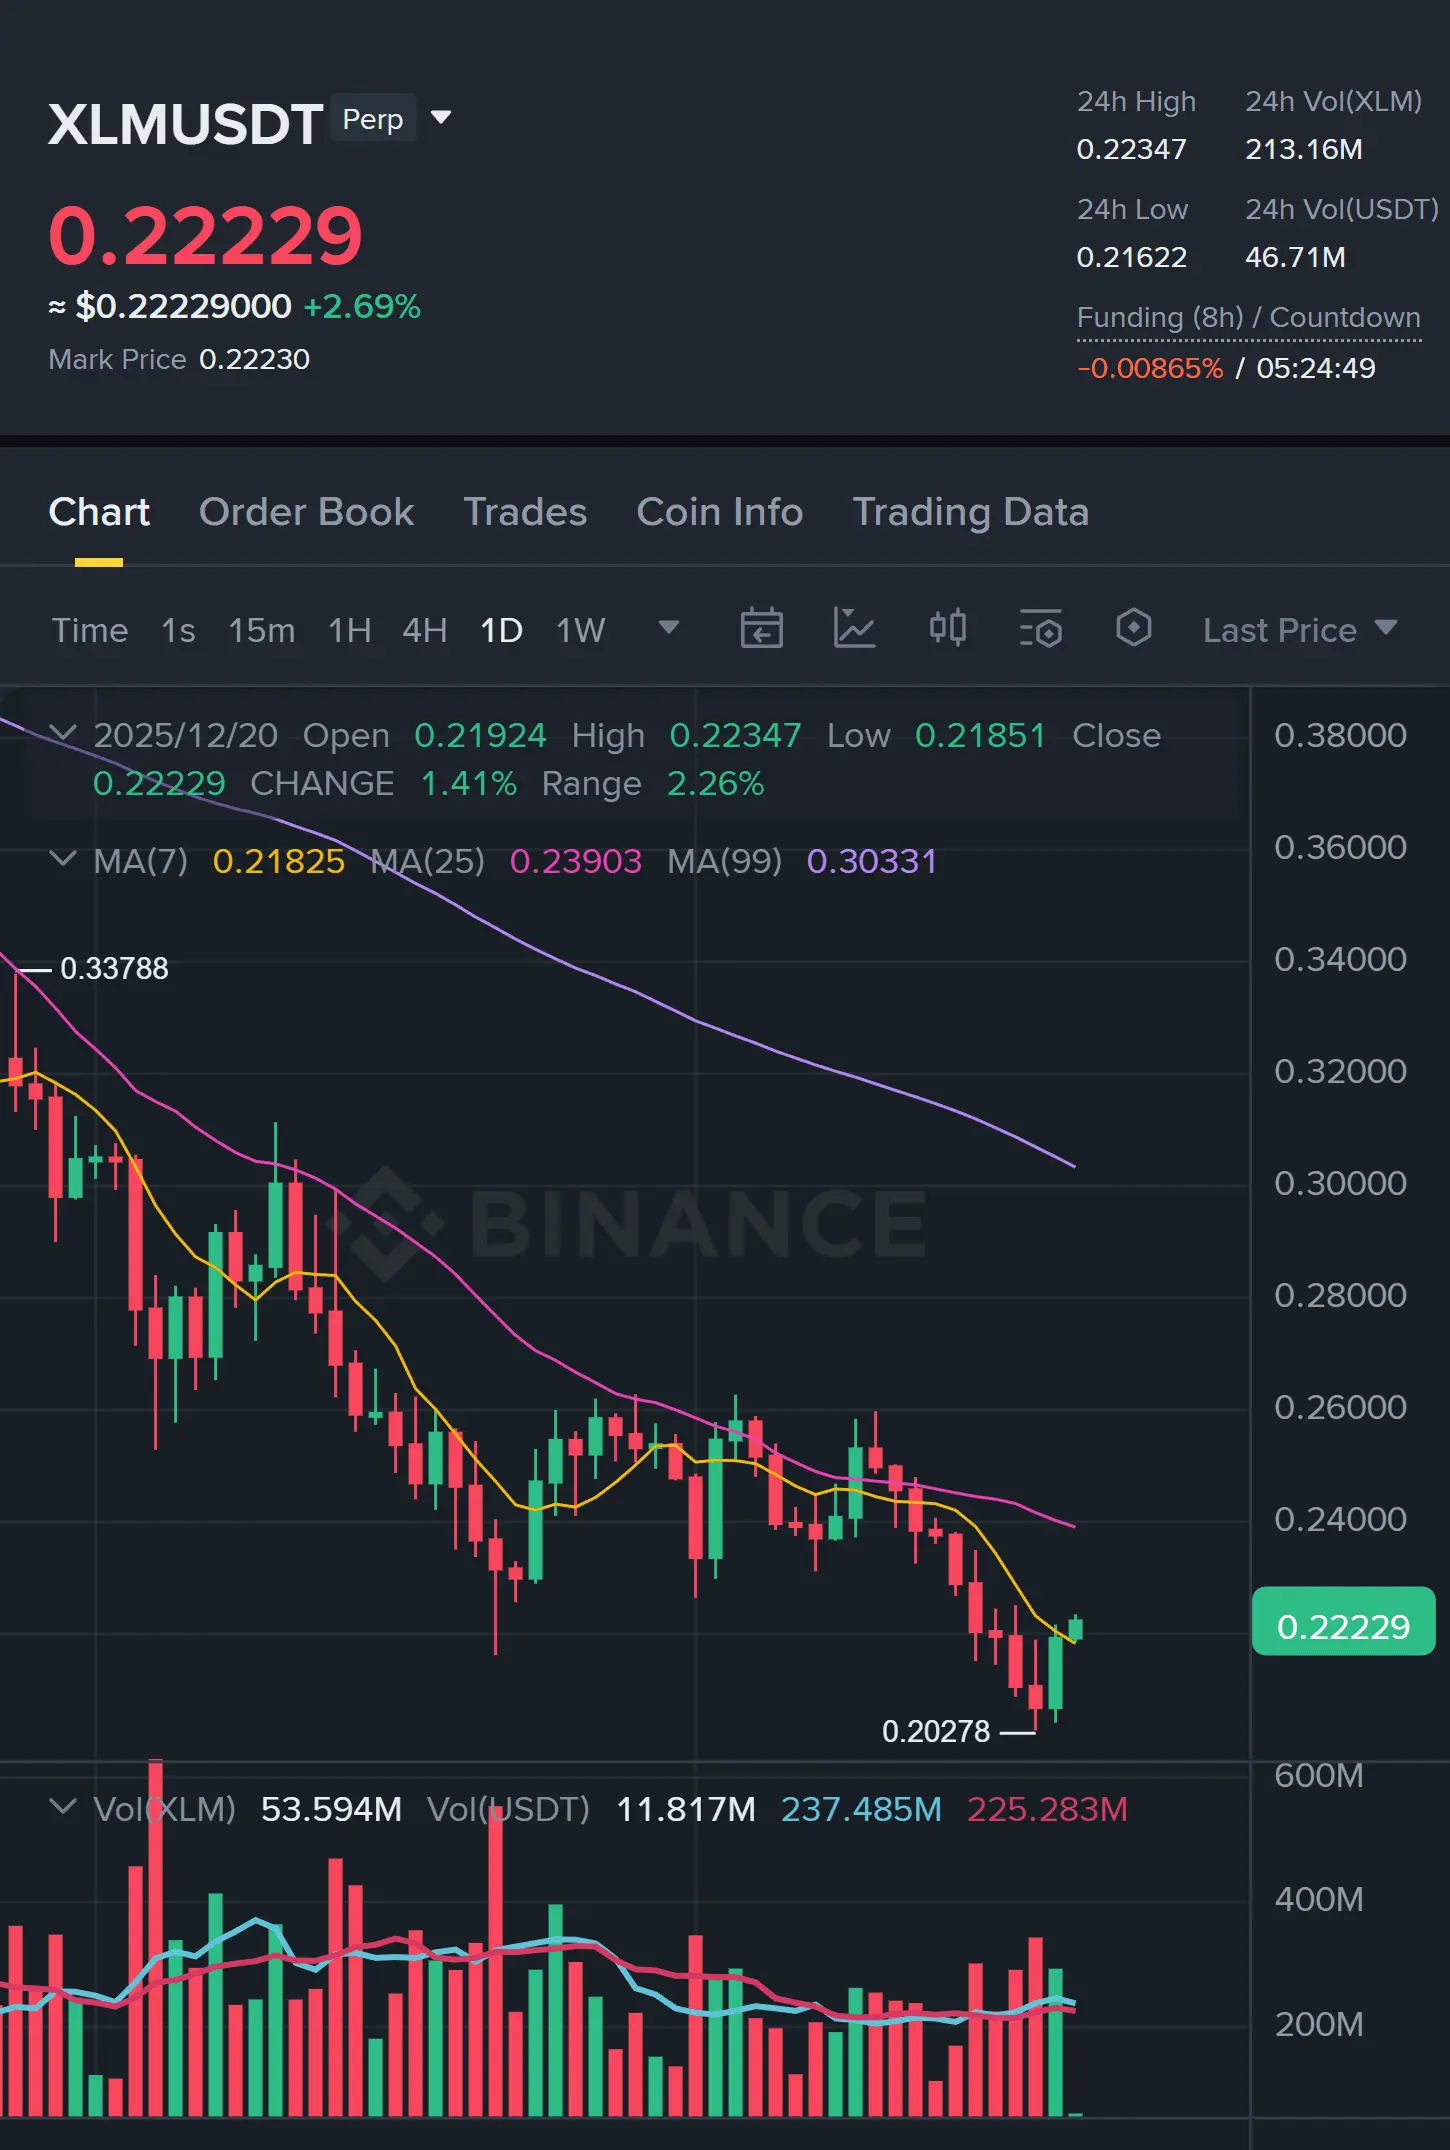
#$XLM After observing a bullish move of 12% from the XLM support zone, it is now forming a bullish pennant pattern. If this pattern breaks out to the upside, we can once again consider taking a long trade in it. This breakout can present a new trade opportunity for us, which can be beneficial to explore for long-term or short-term gains.
#Argentina #WestVirginia #Macro
#Smart Quests
XLM2,09%
MOVE2,87%
  • Reward
  • Comment
  • Repost
  • Share
Load More
Trade Crypto Anywhere Anytime
qrCode
Scan to download Gate App
Community
  • 简体中文
  • English
  • Tiếng Việt
  • 繁體中文
  • Español
  • Русский
  • Français (Afrique)
  • Português (Portugal)
  • Bahasa Indonesia
  • 日本語
  • بالعربية
  • Українська
  • Português (Brasil)