Indicators and Signals - Understanding Technical Analysis Indicators
This course systematically introduces you to the principles and applications of common technical indicators, including trend, momentum, and volatility indicators, helping you identify buy and sell signals in the market and improve the scientific nature of trading decisions.
Why Use Technical Indicators
Technical Indicators are mathematical tools derived from historical price and volume data, used to assist traders in determining trend direction, market strength, and potential buying and selling opportunities. In the volatile crypto market, relying solely on “feeling” or “intuition” often makes it difficult to maintain stability, while indicators can help us extract valuable information from chaotic price movements.
The greatest value of indicators lies in:
- Providing quantitative signals for more objective decision-making;
- Helping identify trends and reversals;
- Assisting in judging overbought and oversold market conditions;
- Confirming price trends or detecting divergence signals.
However, indicators are not “prediction tools” but “reaction tools”. They reflect historical market behavior and current strength, not definitive future trends. Understanding this is the first step in using indicators.
Classification of Indicators
Based on calculation logic and purpose, technical indicators can be broadly categorized into three types: trend, momentum, and volatility indicators. Each type has its core function and applicable scenarios.
1. Trend Indicators
These indicators are used to determine whether the market is in an upward, downward, or sideways trend. Representative indicators: Moving Average (MA), Exponential Moving Average (EMA), MACD (Moving Average Convergence Divergence).
Moving Average (MA): Smooths price fluctuations to identify trend direction.
- Price above MA → Bullish trend;
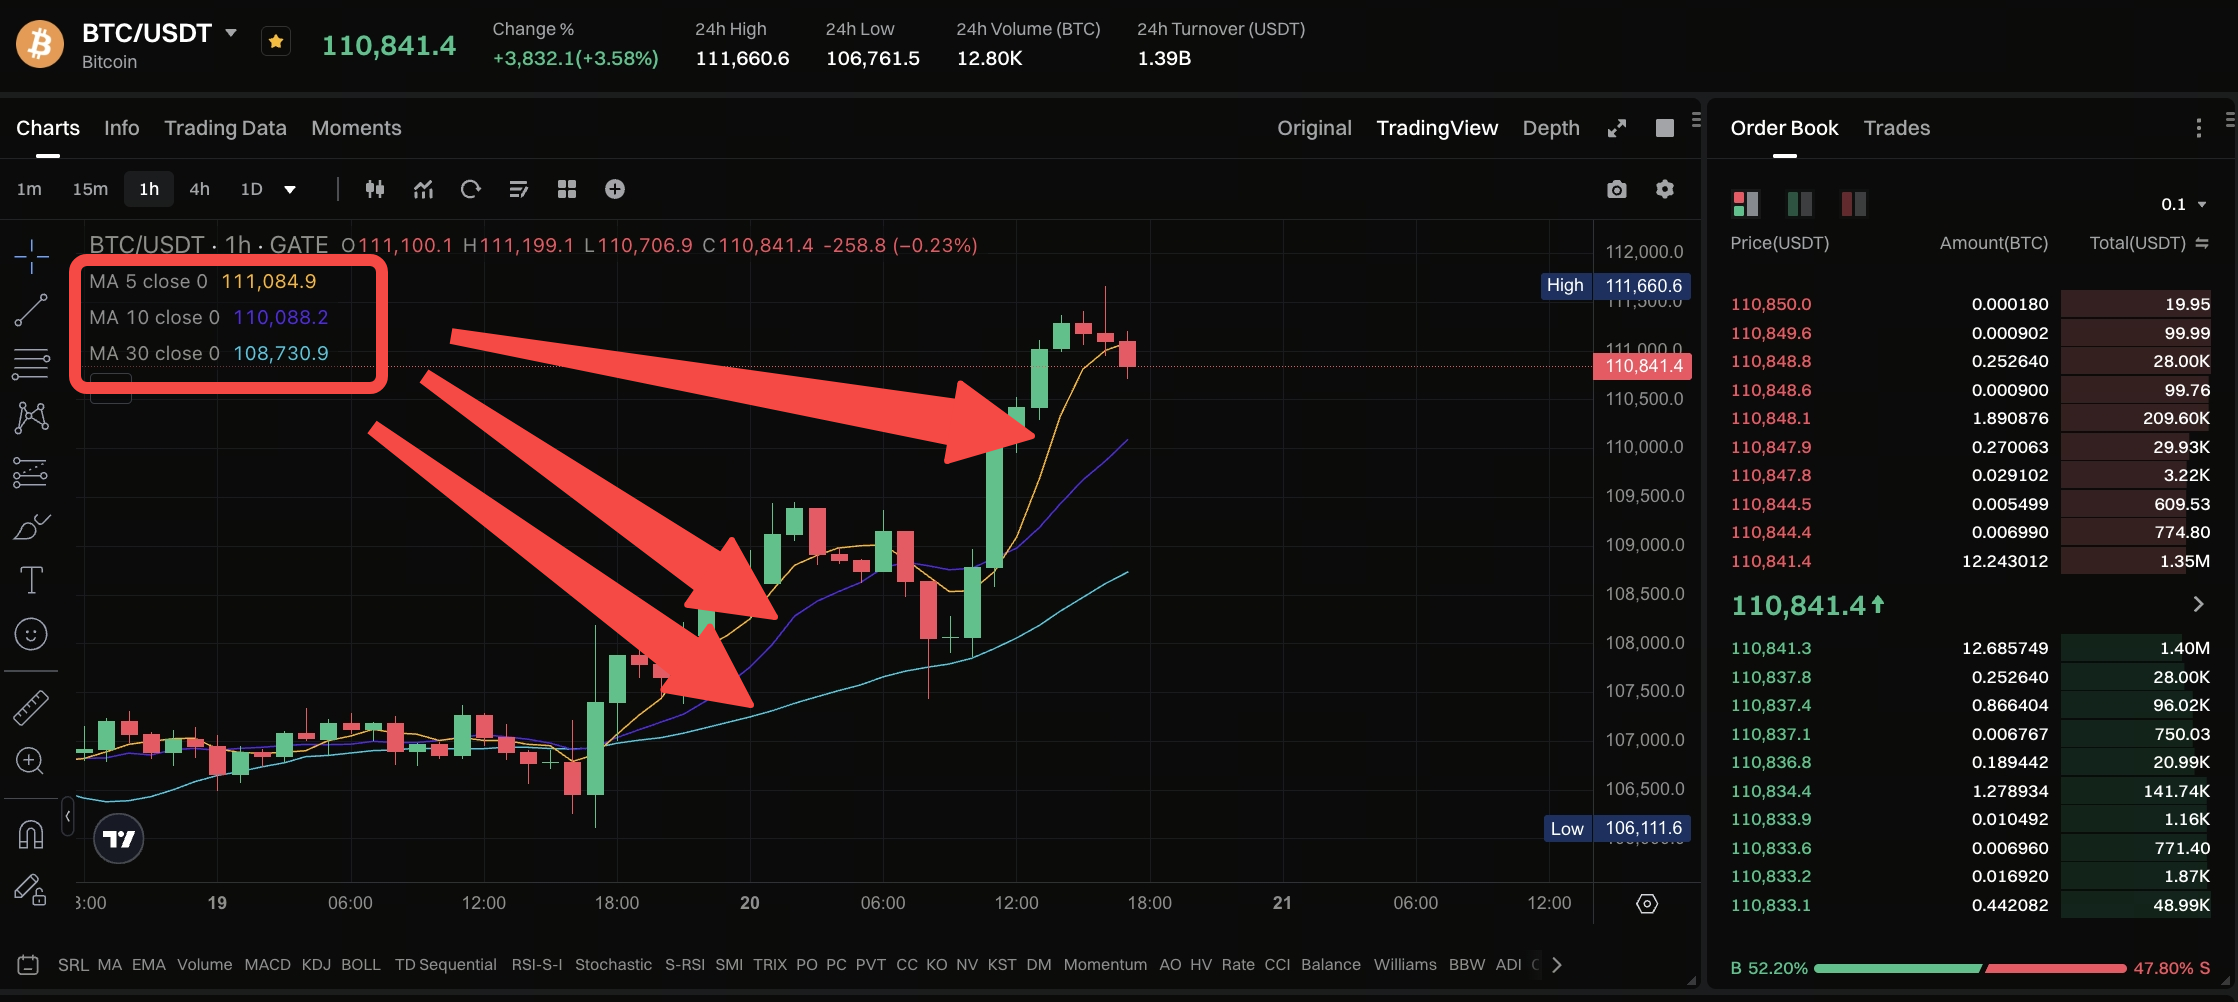
- Price below MA → Bearish trend.
- Common combinations: MA5, MA20, MA60.
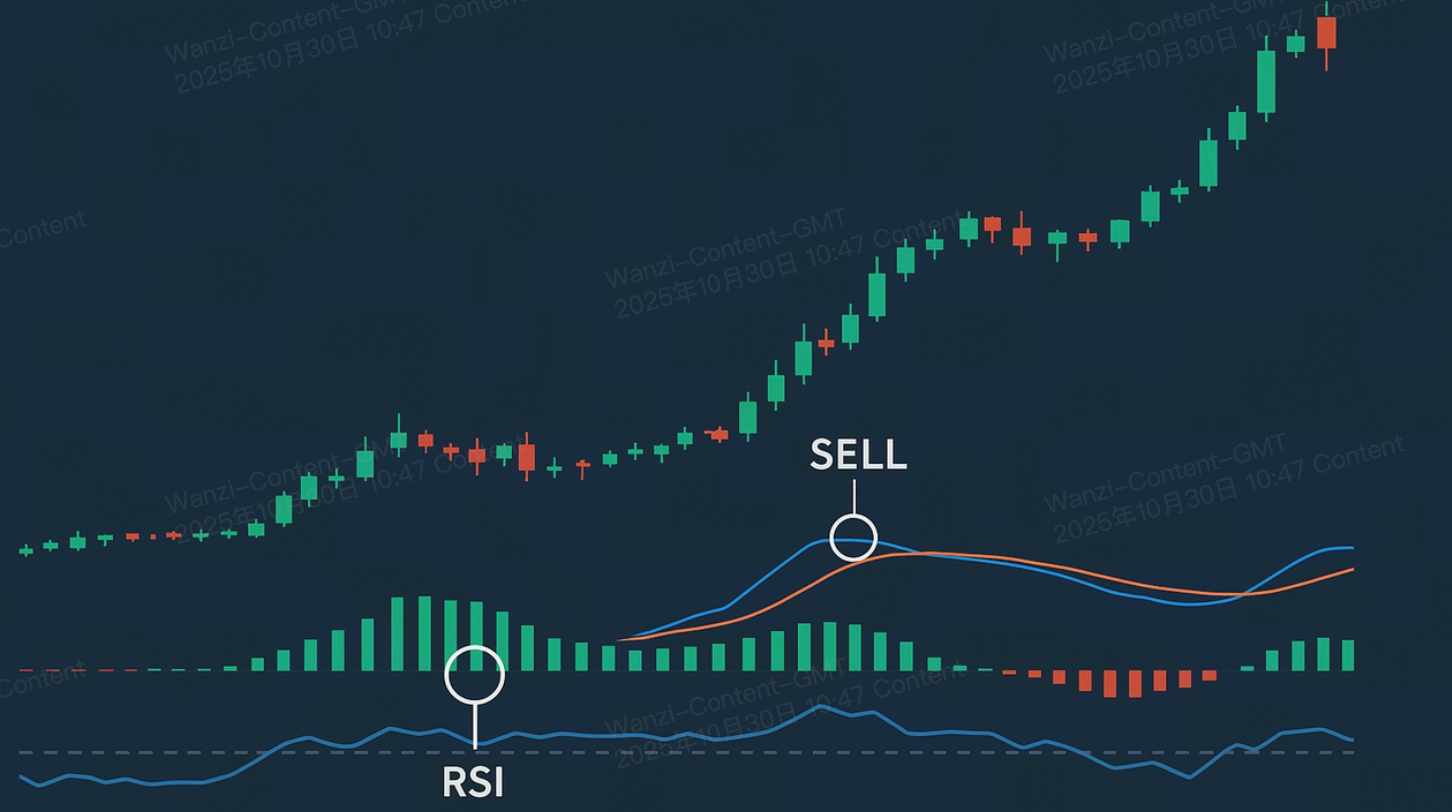
MACD: Calculated from two exponential moving averages, used to identify trend strength and reversal signals.
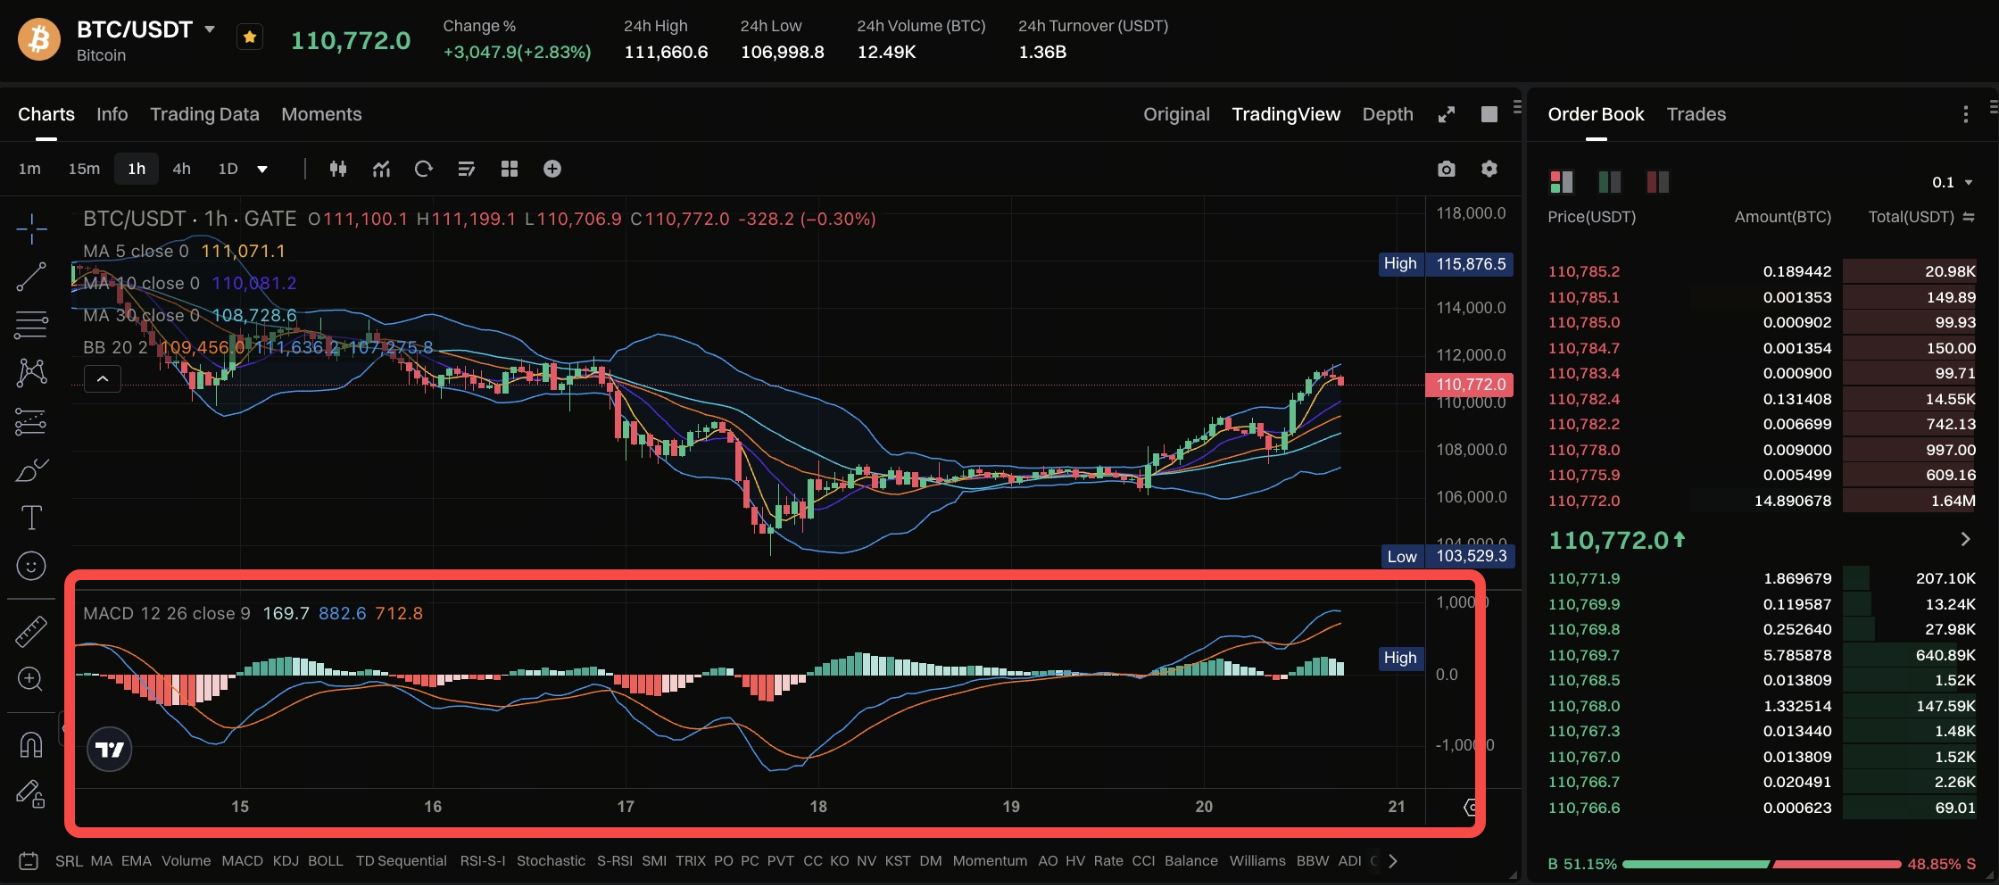
- DIF line crosses above DEA → Buy signal;
- DIF line crosses below DEA → Sell signal.
- The histogram (red and green bars) of MACD represents momentum strength, with expanding red bars indicating strengthening upward momentum.
2. Momentum Indicators
Used to measure the speed of price increases or decreases, judging whether the market is “overheated” or “overcooled”.
Representative indicators: RSI (Relative Strength Index), Stochastic Oscillator.
- RSI: Range from 0-100.
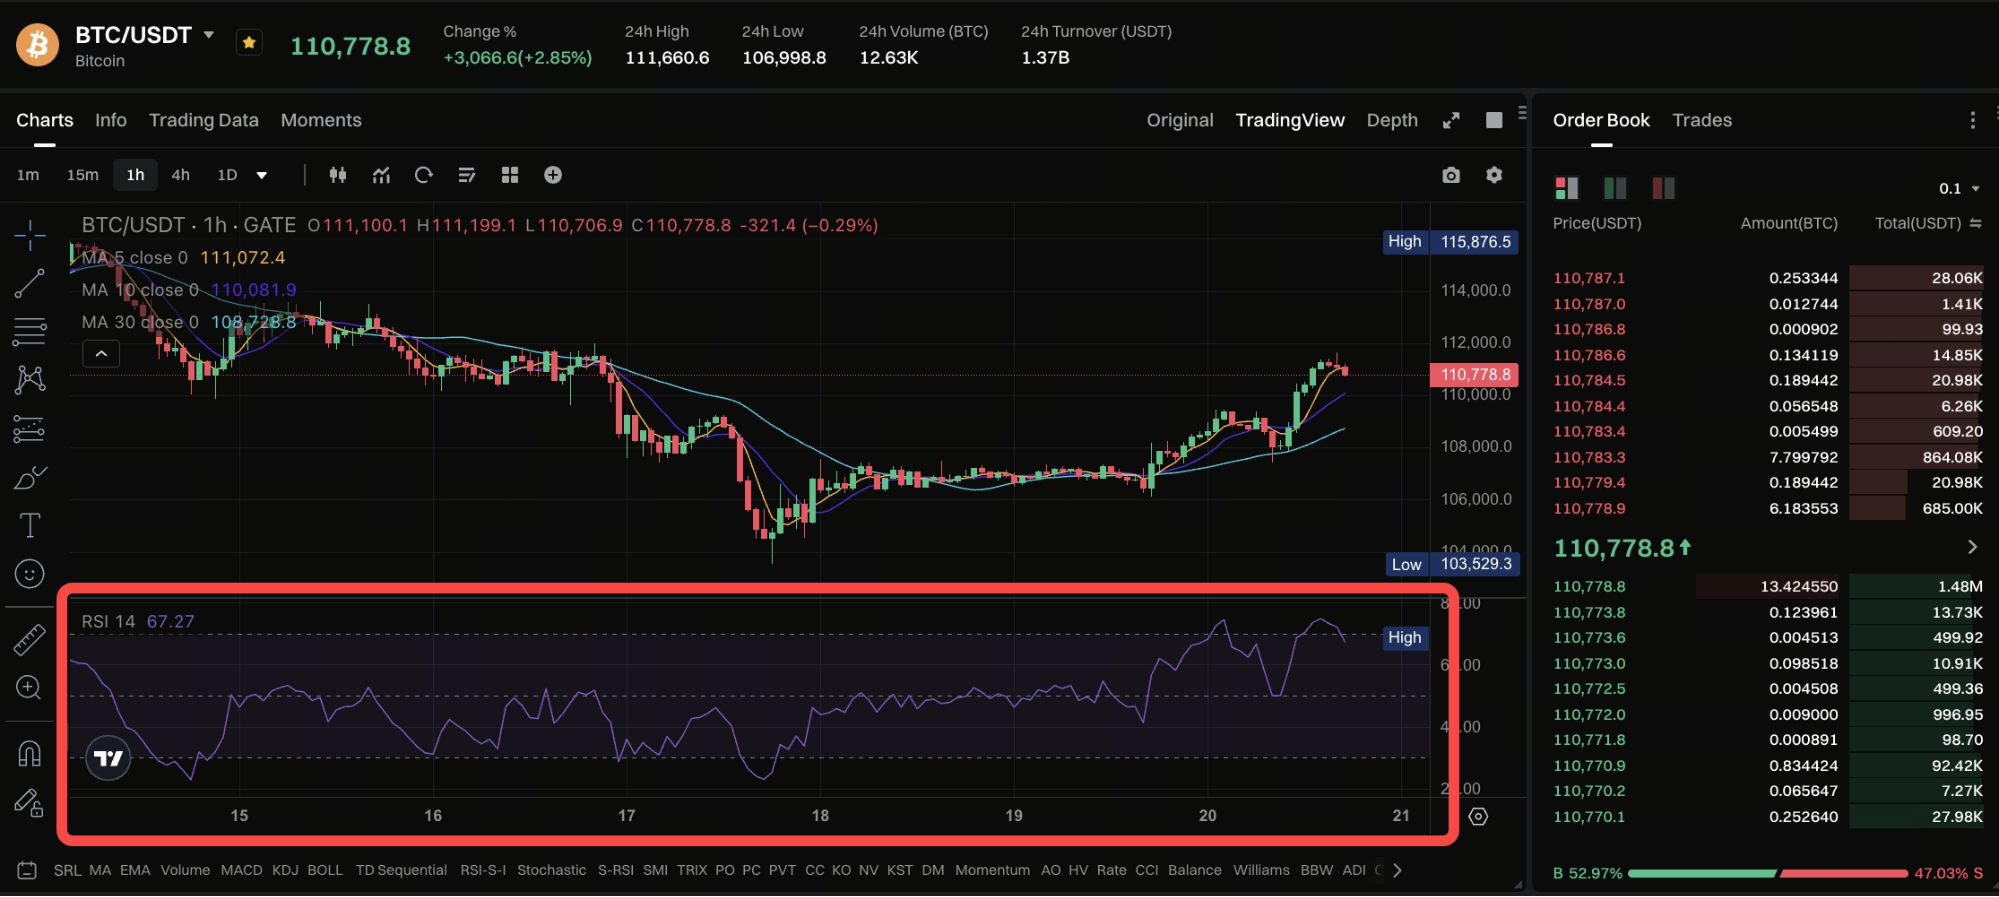
- RSI > 70 → Market overbought, potential correction;
- RSI < 30 → Market oversold, potential rebound.
- RSI is not a standalone decision signal but an auxiliary tool for judging sentiment and momentum.
Stochastic Oscillator: Measures market momentum by comparing the current closing price with the recent price range.
K line crosses above D line → Short-term buy signal;
- K line crosses below D line → Short-term sell signal.
3. Volatility Indicators
Used to measure the extent of market price fluctuations and uncertainty.
Representative indicators: Bollinger Bands, ATR (Average True Range).
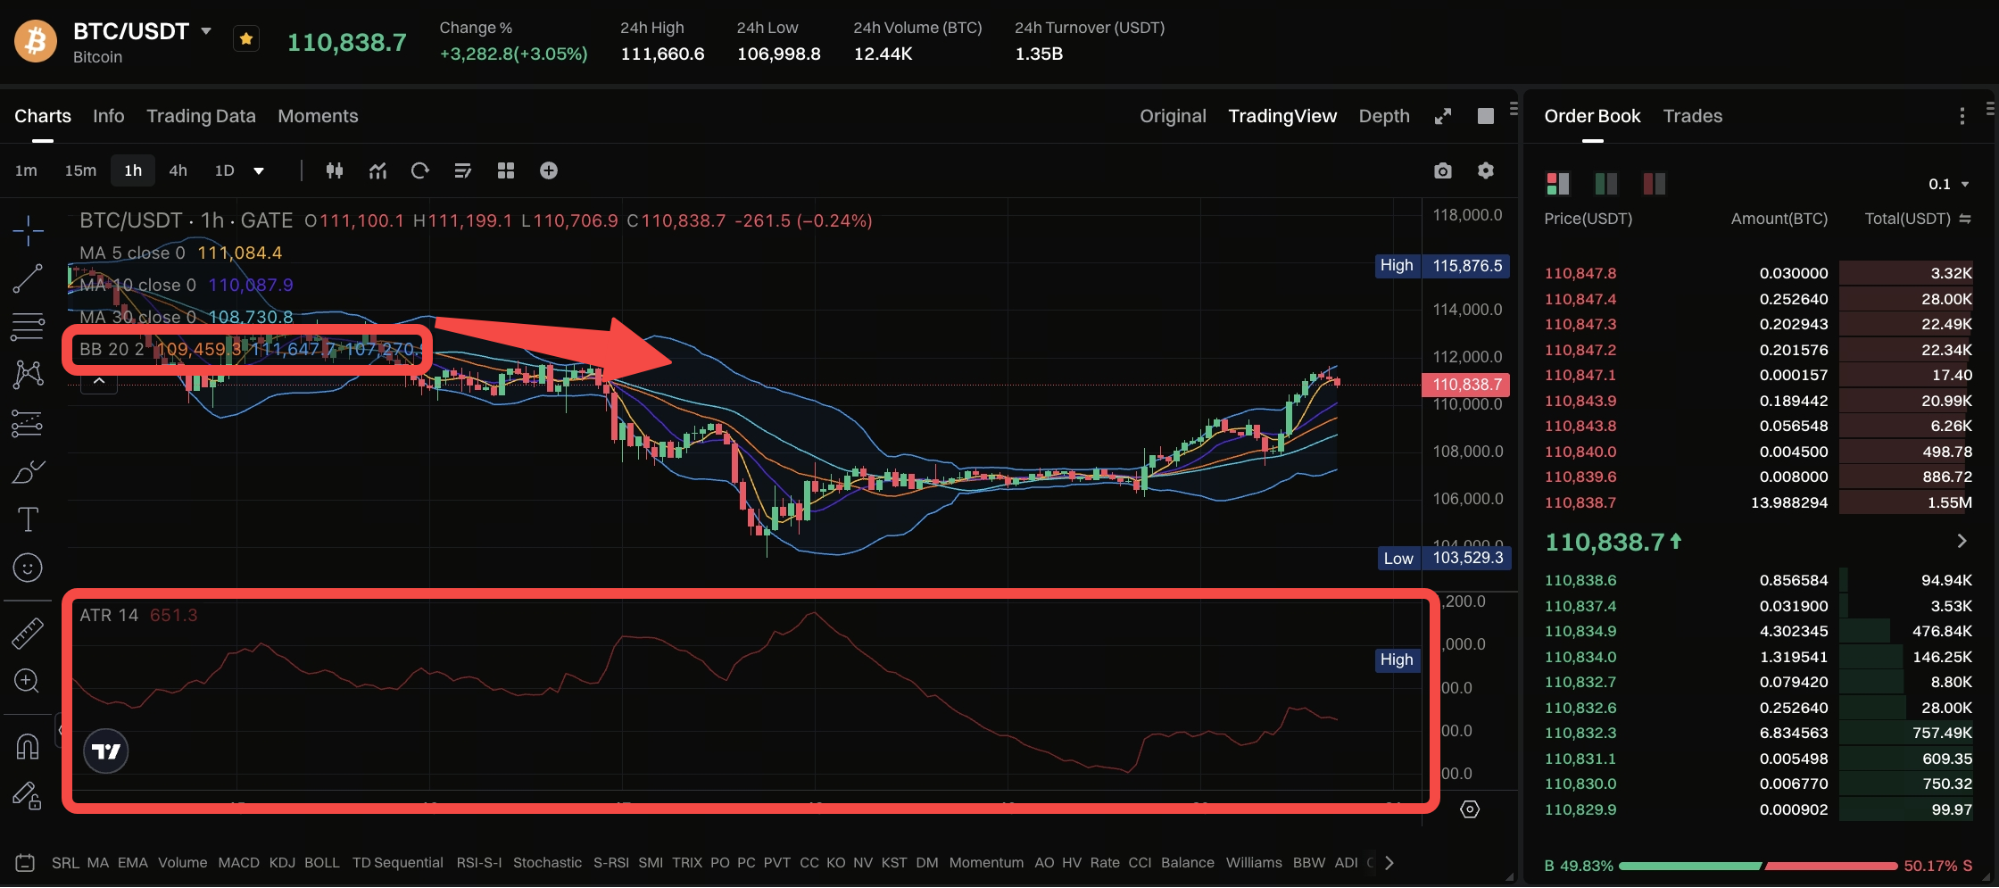
Bollinger Bands: Composed of a middle band (moving average) and upper and lower bands (standard deviation).
Price touches upper band → Market potentially overheated;
- Price touches lower band → Market potentially oversold;
- Bollinger Bands widen → Increased volatility;
- Bands narrow → Market enters consolidation.
- ATR: Measures the strength of market volatility, regardless of direction. A higher ATR value indicates greater volatility, suitable for setting stop-losses or managing positions.
How to Combine Indicators
In practice, a single indicator often cannot provide comprehensive signals. Excellent traders use multiple indicator combinations to enhance judgment accuracy. Common combination methods include:
1. Trend + Momentum Combination
- Trend indicators determine direction (e.g., MA, MACD).
- Momentum indicators confirm strength (e.g., RSI, Stochastic).
- Example: When price is running above MA60 (uptrend), and RSI rises from 40 to 60, indicating increasing upward momentum, consider going long.
2. Trend + Volatility Combination
- Trend indicators judge direction;
- Volatility indicators assess risk and entry points.
- Example: When price in an uptrend pulls back to touch the lower Bollinger Band while volume contracts, this is a relatively low-risk buying zone.
3. Multi-Timeframe Confirmation
Verify signals across different time periods:
- Daily trend up + 4-hour MACD golden cross → Medium-term confirmation;
- Hourly RSI oversold rebound → Short-term entry signal.
The core idea of combining indicators is complementarity, not redundancy. Don’t use two indicators with similar meanings (e.g., MACD and dual moving averages), as signals may be redundant.
Traps and Misconceptions in Indicator Signals
- Over-reliance on indicators: Indicators are “derivatives” of price, reflecting historical information. If you rely too heavily on indicators while ignoring market structure (support levels, trendlines), you’ll fall into the “lag trap”.
- Ignoring market context: RSI overbought doesn’t always mean a decline. In strong markets, RSI can remain high for extended periods. Therefore, any signal must be judged in conjunction with trend direction, not used in isolation.
- Using too many indicators simultaneously: Many beginners like to open a dozen indicators at once, resulting in confusion from “signal conflicts”. It’s recommended to use at most 2-3 indicator combinations: one trend indicator, one momentum indicator, and one volatility indicator.
- Not considering volume confirmation: Volume is key to verifying indicator signals. Any indicator signal without volume support will have reduced reliability.
Practical Case: BTC Indicator Signal Analysis
At a certain stage in 2025, BTC broke through from $60,000 to $70,000:
- MA20 crossed above MA60, forming a “golden cross”;
- RSI rose from 50 to 68, showing increased momentum;
- Bollinger Bands upper band widened, indicating increased volatility.
The combination of these three signals indicates: The market is in a strong uptrend, consider building positions in stages or following the trend. Conversely, when RSI is above 75 and MACD shows divergence (price makes new highs but the indicator doesn’t), it suggests momentum is weakening, and caution should be exercised for potential pullbacks.
How to Build a Personal Indicator System
Every trader should construct an independent indicator system based on their own time frame and risk preference.
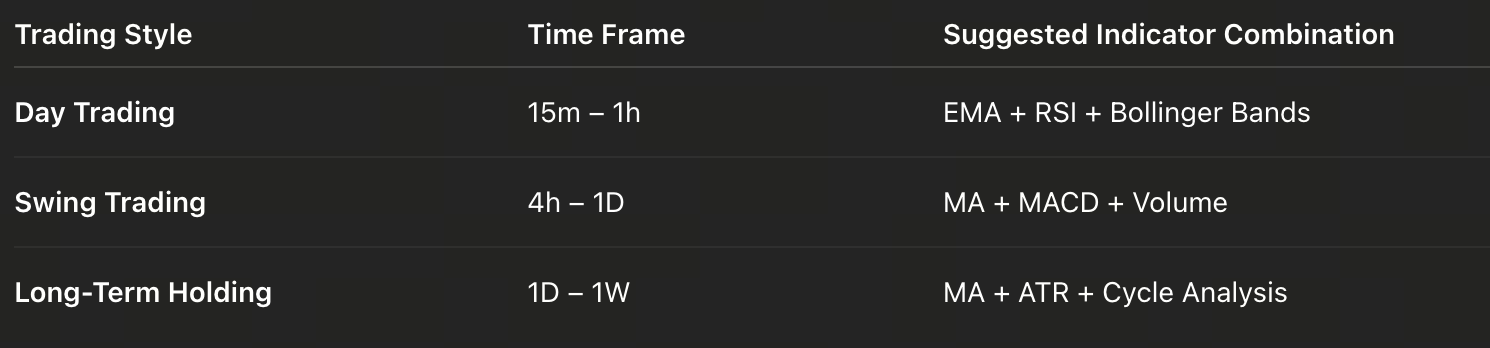
The key is not “having many indicators” but “having clear logic”. A good system allows you to know what to do, what to wait for, and what to avoid in any market condition.
Lesson 1:Portfolio and Risk Management
Lesson 2:Day Trading and Swing Trading
Lesson 3:Fundamentals of Technical Analysis
Lesson 4:Indicators and Signals - Understanding Technical Analysis Indicators
Lesson 5:Creating a Balanced Cryptocurrency Investment Portfolio
Related Courses

Guide to Gate Dual Currency Products

The Beginner's Guide to Blockchain-based Airdrops

Introduction to Meme Tokens

Learn about web3 data and analytics

Crypto Mining Equipment
