Pi Network Price Prediction: Weak Rebound as Price Hovers Around $0.36 Low
Current Price Overview and Trading Range
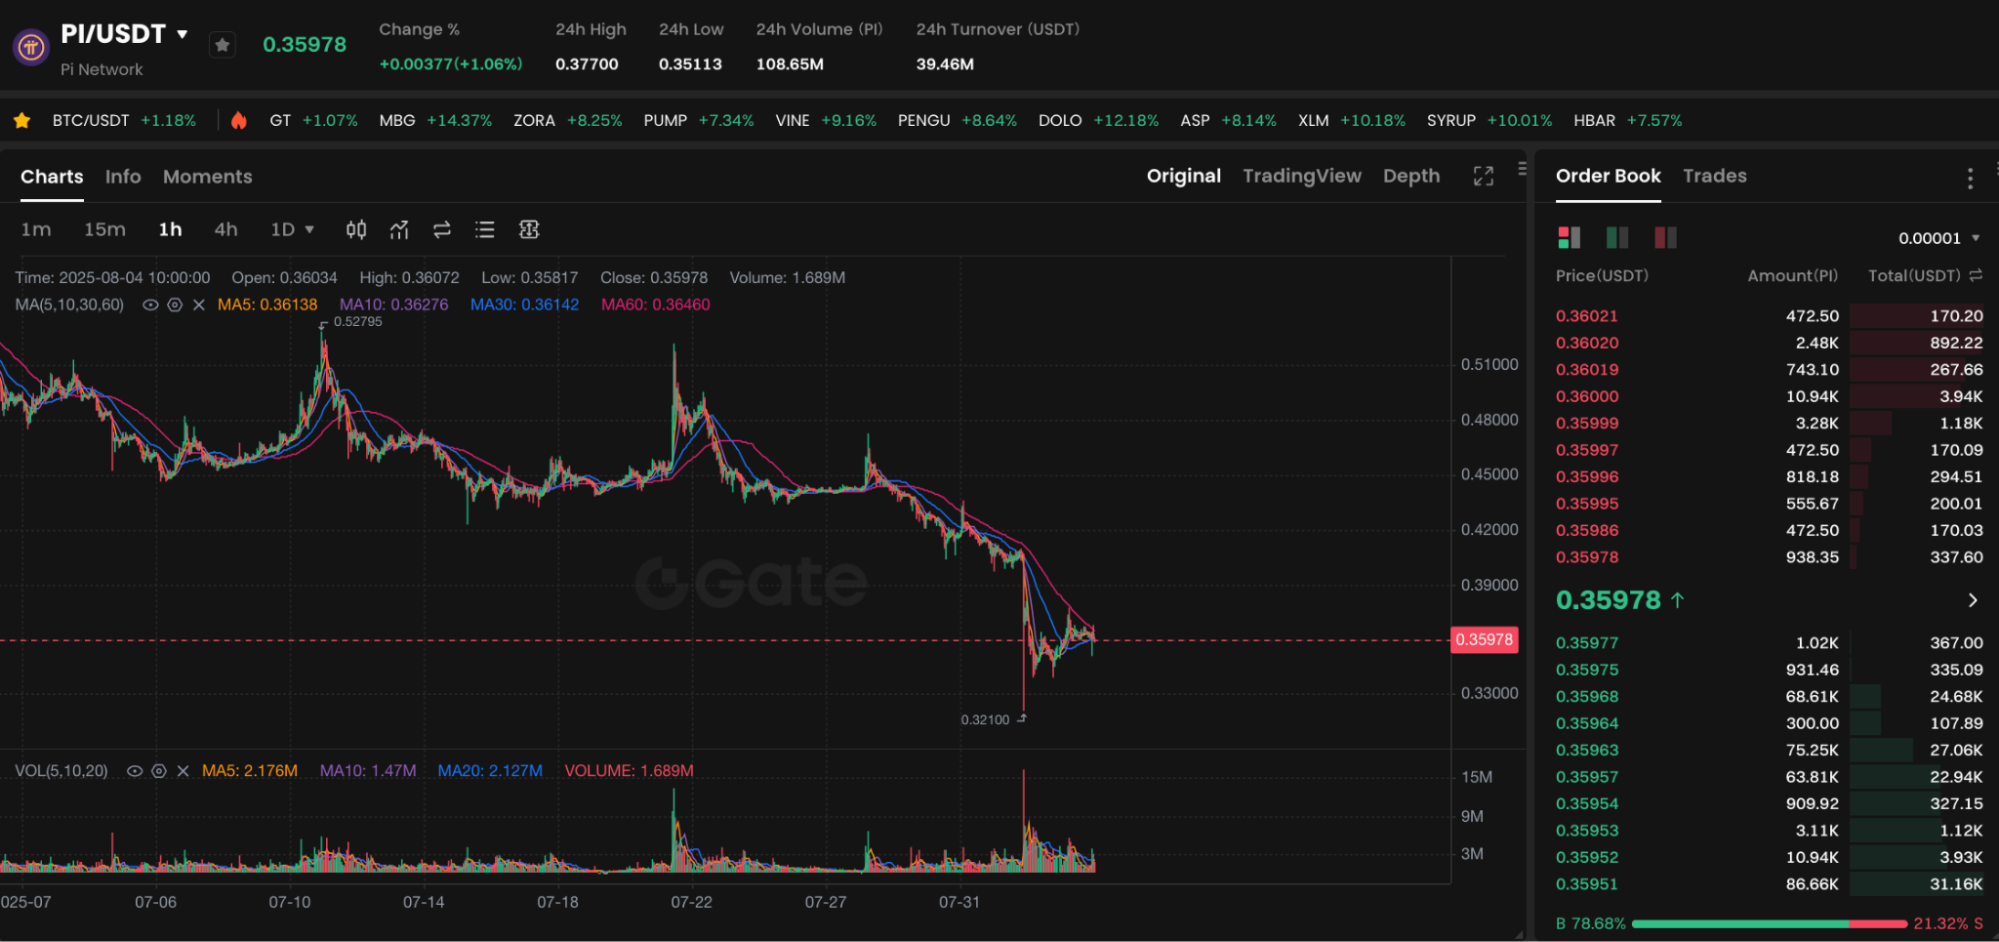
Chart: https://www.gate.com/trade/PI_USDT
As of August 4, 2025, the data shows Pi Network (PI) is currently trading at $0.35978. The recent low was $0.32100, with only a modest rebound afterward. In the short term, price fluctuations are holding within the $0.351–$0.377 range.
Pi has pulled back more than 30% from the July high of around $0.52, leading to continued weakness in market confidence. The current consolidation zone remains narrow, with a clear stalemate between buyers and sellers.
Technical Analysis: Noticeable Moving Average Resistance
The chart reveals the following:
- MA5, MA10, and MA30 moving averages are all sloping downward;
- The current price is trading below all moving averages, signaling a lack of bullish momentum;
- The Bollinger Bands are narrowing, which points to unclear short-term direction and the potential for a breakout as momentum builds.
There is significant trading volume concentrated at $0.36–$0.365. If PI’s price fails to break above this area, it may retest support at $0.34.
Market Volume and Sentiment
The chart displays increasing volume alongside declining prices, highlighting significant panic-driven selling pressure. Additionally:
- Buy orders make up 78.68% of the total order count, but most are small in size;
- Major sell orders are clustered at $0.360–$0.362, which creates short-term resistance above the current price;
- Most holders remain cautious and lack confidence.
Based on the Order Book data, the market is likely to continue consolidating in the near term. A decisive move is still awaited.
Potential Price Movements in the Coming Days
If PI holds above $0.36 and breaks out above $0.365–$0.370 with increased volume, it could quickly test $0.39 resistance. However, a drop below $0.351 could see prices retest the $0.32 level.
Key short-term support levels: $0.351 / $0.340 / $0.321
Short-term resistance levels: $0.370 / $0.388 / $0.405
Guidance for New Traders
- Avoid aggressive buying at the bottom; instead, consider a phased buying strategy at lower levels;
- Monitor whether $0.351 holds as support and use it as a stop-loss reference;
- Short-term traders may look to capitalize on volatility between $0.36 and $0.365 by buying low and selling high;
- If there are no clear bullish catalysts, wait on the sidelines until a definitive trend emerges.
Share
Content


Related Articles

2025 BTC Price Prediction: BTC Trend Forecast Based on Technical and Macroeconomic Data

Flare Crypto Explained: What Is Flare Network and Why It Matters in 2025

Pi Coin Transaction Guide: How to Transfer to Gate.com

How to Use a Crypto Whale Tracker: Top Tool Recommendation for 2025 to Follow Whale Moves

What is N2: An AI-Driven Layer 2 Solution