Bitcoin Surpasses $106,000: Is the Bull Market Truly Restarting?
Early November Pullback to $98,000
In early November 2025, Bitcoin briefly dropped to around $98,000, a drop of nearly $8,000, representing a fluctuation of more than 7%. This correction shows that even in strong market trends, prices can experience interim retracements.
Profit-taking, a surge in short positions, and macroeconomic news volatility were the primary factors driving the pullback. These dynamics allowed the price to stabilize and set the stage for the subsequent rebound.
Drivers Behind the $106,000 Breakout
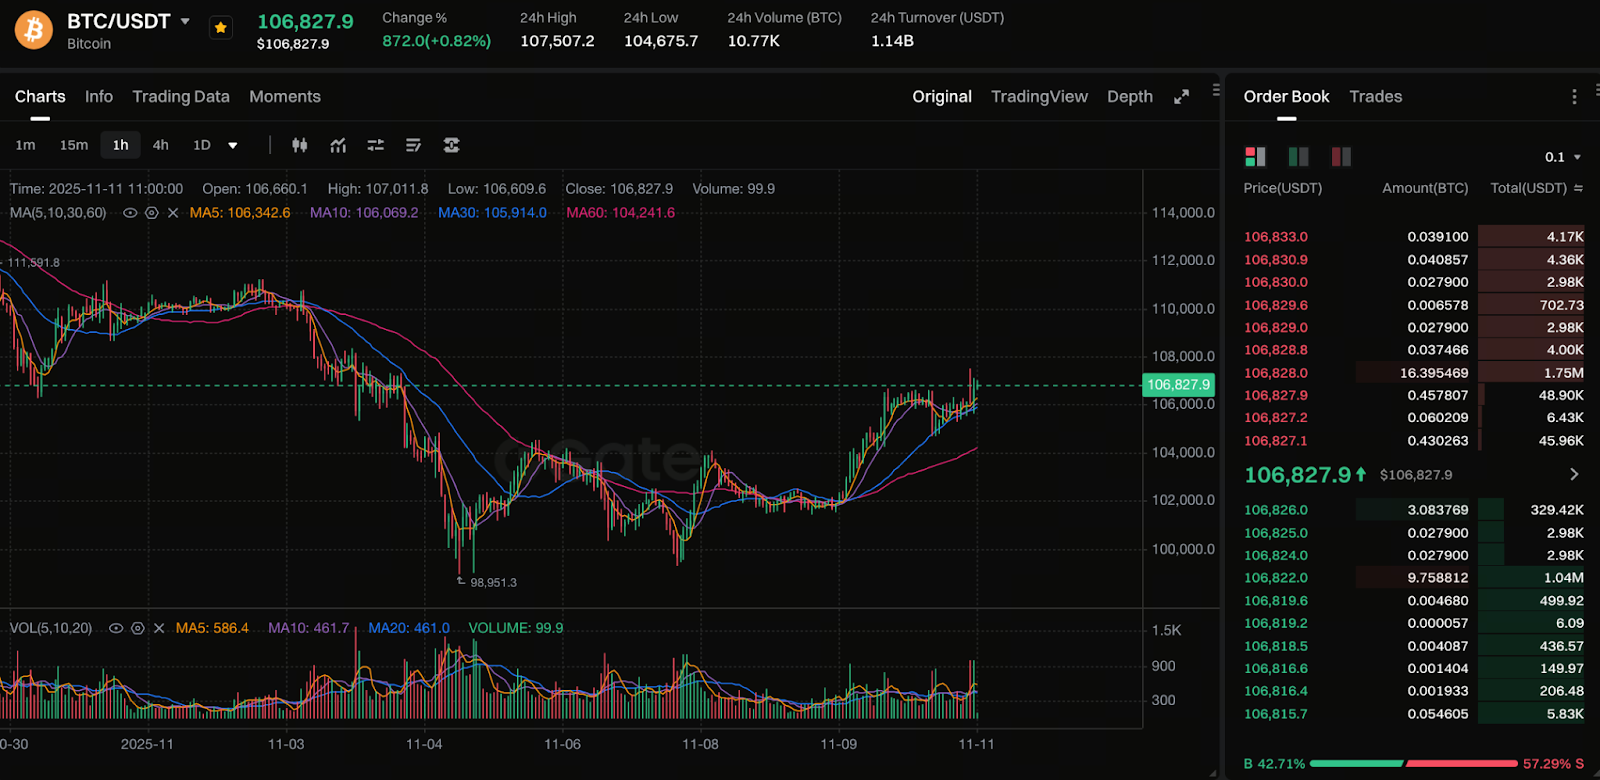
Chart: https://www.gate.com/trade/BTC_USDT
As of November 11, 02:00 UTC, Bitcoin was quoted at 106,706 USDT, up 0.88% for the day, with a 24-hour high of 107,507 USDT and a low of 104,675 USDT. Trading volume reached 10.63K BTC.
Following the sharp drop at the start of November (bottoming at 98,951 USDT), BTC rebounded for three straight days. It is currently trading between 106,000 and 107,000 USDT. The 5-day and 10-day moving averages have crossed above the 30-day moving average, forming a bullish pattern and signaling sustained momentum. However, the 60-day moving average, located near 104,100, serves as medium-term support; a break below this level could disrupt the rebound structure.
Technically, BTC has developed a small W-bottom pattern around 104,000, with the neckline at 106,200 already breached on strong volume. The short-term target now points to 107,500 – 108,000 USDT.
Why This Rally Deserves Attention
$106,000 marks a critical psychological and technical threshold. The price has previously struggled in this area, and a breakout sets a new short-term high. If Bitcoin holds above $106,000, targets above $111,000 may become relevant.
Key Metrics and Capital Flows
- Support/Resistance: Can the price maintain above $106,000?
- Volume and Capital Flow: Rising volume strengthens the credibility of the breakout.
- Macroeconomic Factors: Interest rates, geopolitical events, and regulatory changes can all impact price.
- Technical Indicators: RSI and MACD are useful tools but should not be relied on exclusively.
Risk Alert: Underlying Concerns in the Rally
- Pullback risk persists; historical data indicates resistance near $106,000.
- Macroeconomic risks can arise unexpectedly.
- A breakout does not signal a full-scale bull market; exercise caution due to ongoing volatility.
Summary: Trend Insights and Trading Guidance
Bitcoin’s move above $106,000 is an encouraging sign. Traders should watch for pullback risks and capital trends. Monitor whether the price holds key support levels. Use volume and capital flows to assess market direction. Analyze trading opportunities rationally.
Share
Content


Related Articles

Pi Coin Transaction Guide: How to Transfer to Gate.io

Flare Crypto Explained: What Is Flare Network and Why It Matters in 2025

How to Use a Crypto Whale Tracker: Top Tool Recommendation for 2025 to Follow Whale Moves

What is N2: An AI-Driven Layer 2 Solution

Understand Baby doge coin in one article
