XAN vs UNI: The Battle for Blockchain Supremacy in Cross-Chain Solutions
Introduction: XAN vs UNI Investment Comparison
In the cryptocurrency market, the comparison between Anoma (XAN) vs Uniswap (UNI) has been an unavoidable topic for investors. The two not only show significant differences in market cap ranking, application scenarios, and price performance, but also represent different positioning in the crypto asset space.
Anoma (XAN): Since its launch, it has gained market recognition for its role as a decentralized OS powering a unified app layer for Web3.
Uniswap (UNI): Since its inception in 2020, it has been hailed as the first automatic market making transaction protocol based on the Ethereum blockchain, becoming one of the cryptocurrencies with the highest global trading volume and market capitalization.
This article will comprehensively analyze the investment value comparison between XAN and UNI, focusing on historical price trends, supply mechanisms, institutional adoption, technological ecosystems, and future predictions, attempting to answer the question investors care about most:
"Which is the better buy right now?"
I. Price History Comparison and Current Market Status
XAN (Anoma) and UNI (Uniswap) Historical Price Trends
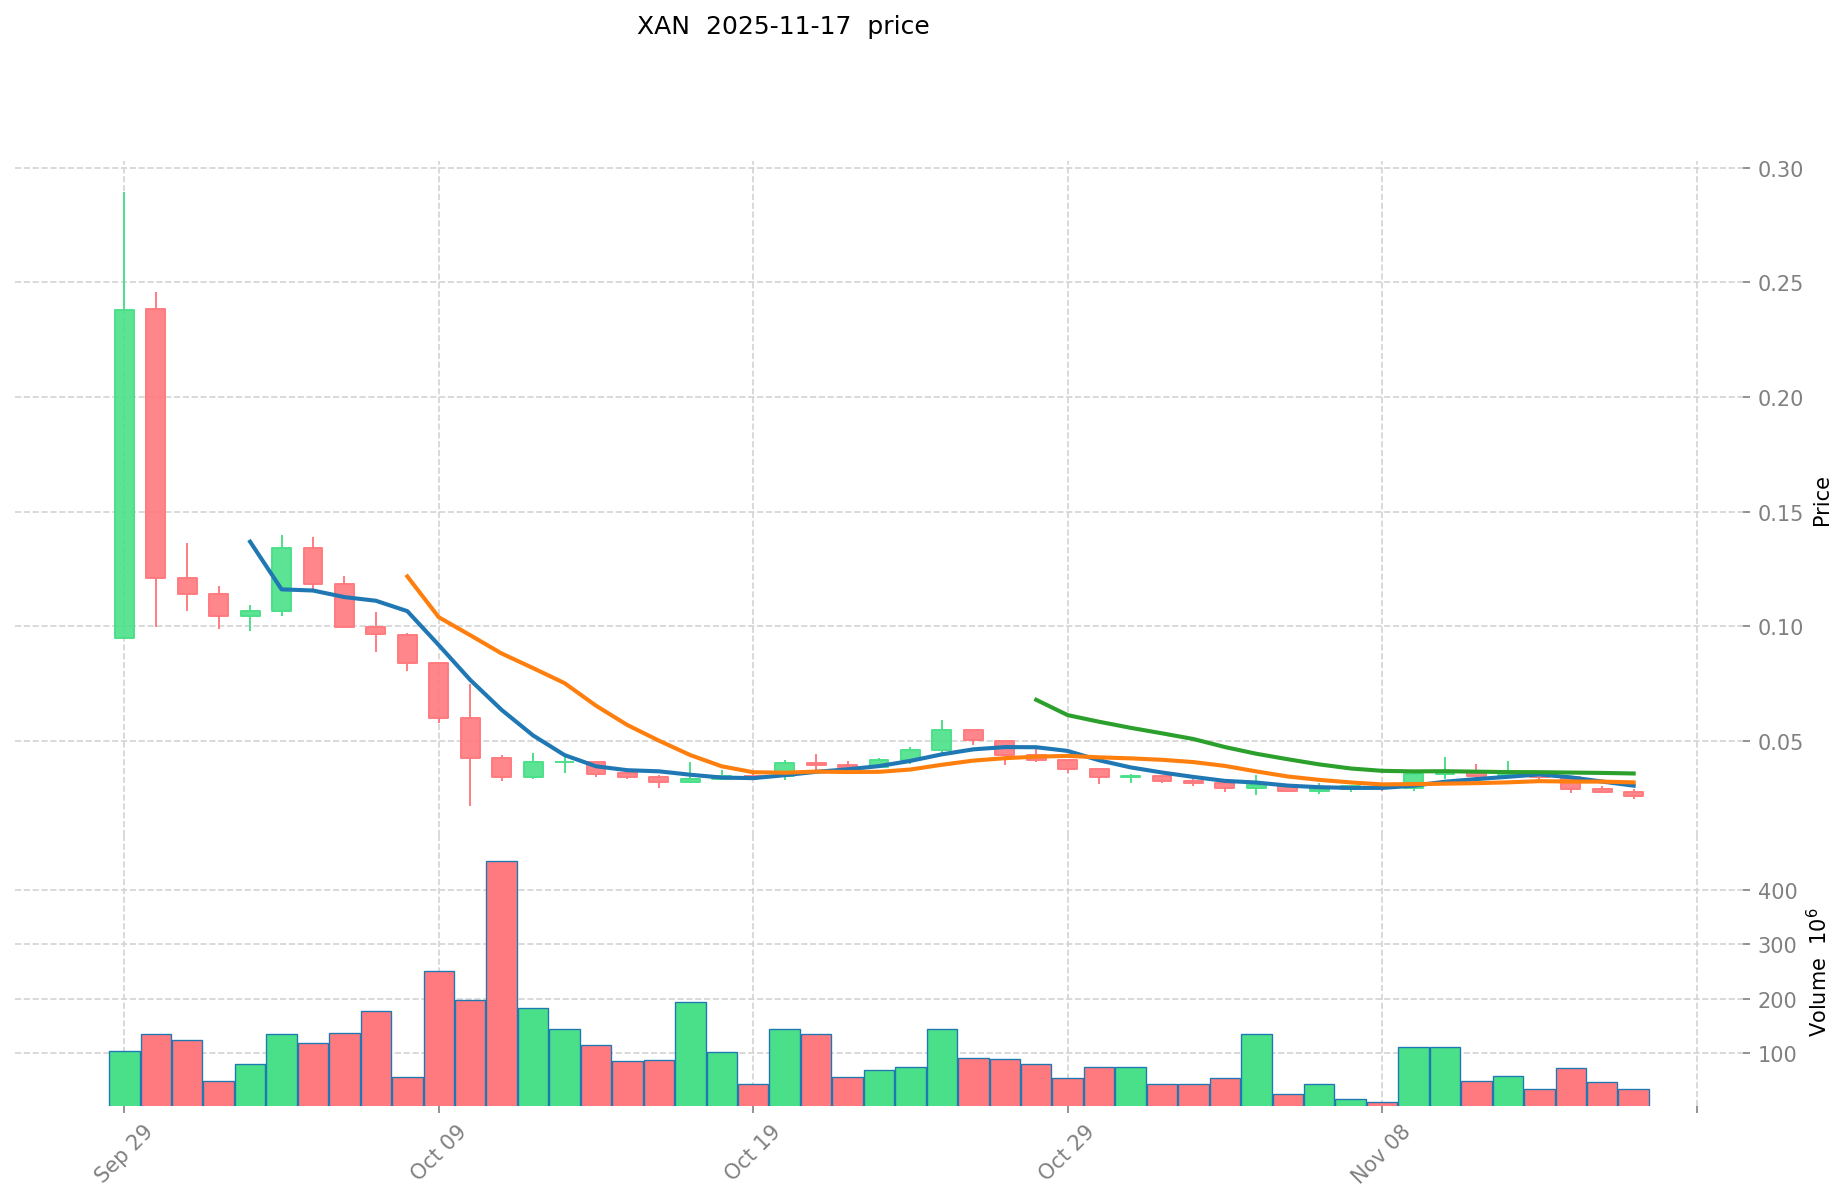
- 2025: XAN reached its all-time high of $0.28948 on September 29, followed by a significant drop to its all-time low of $0.02194 on October 10.
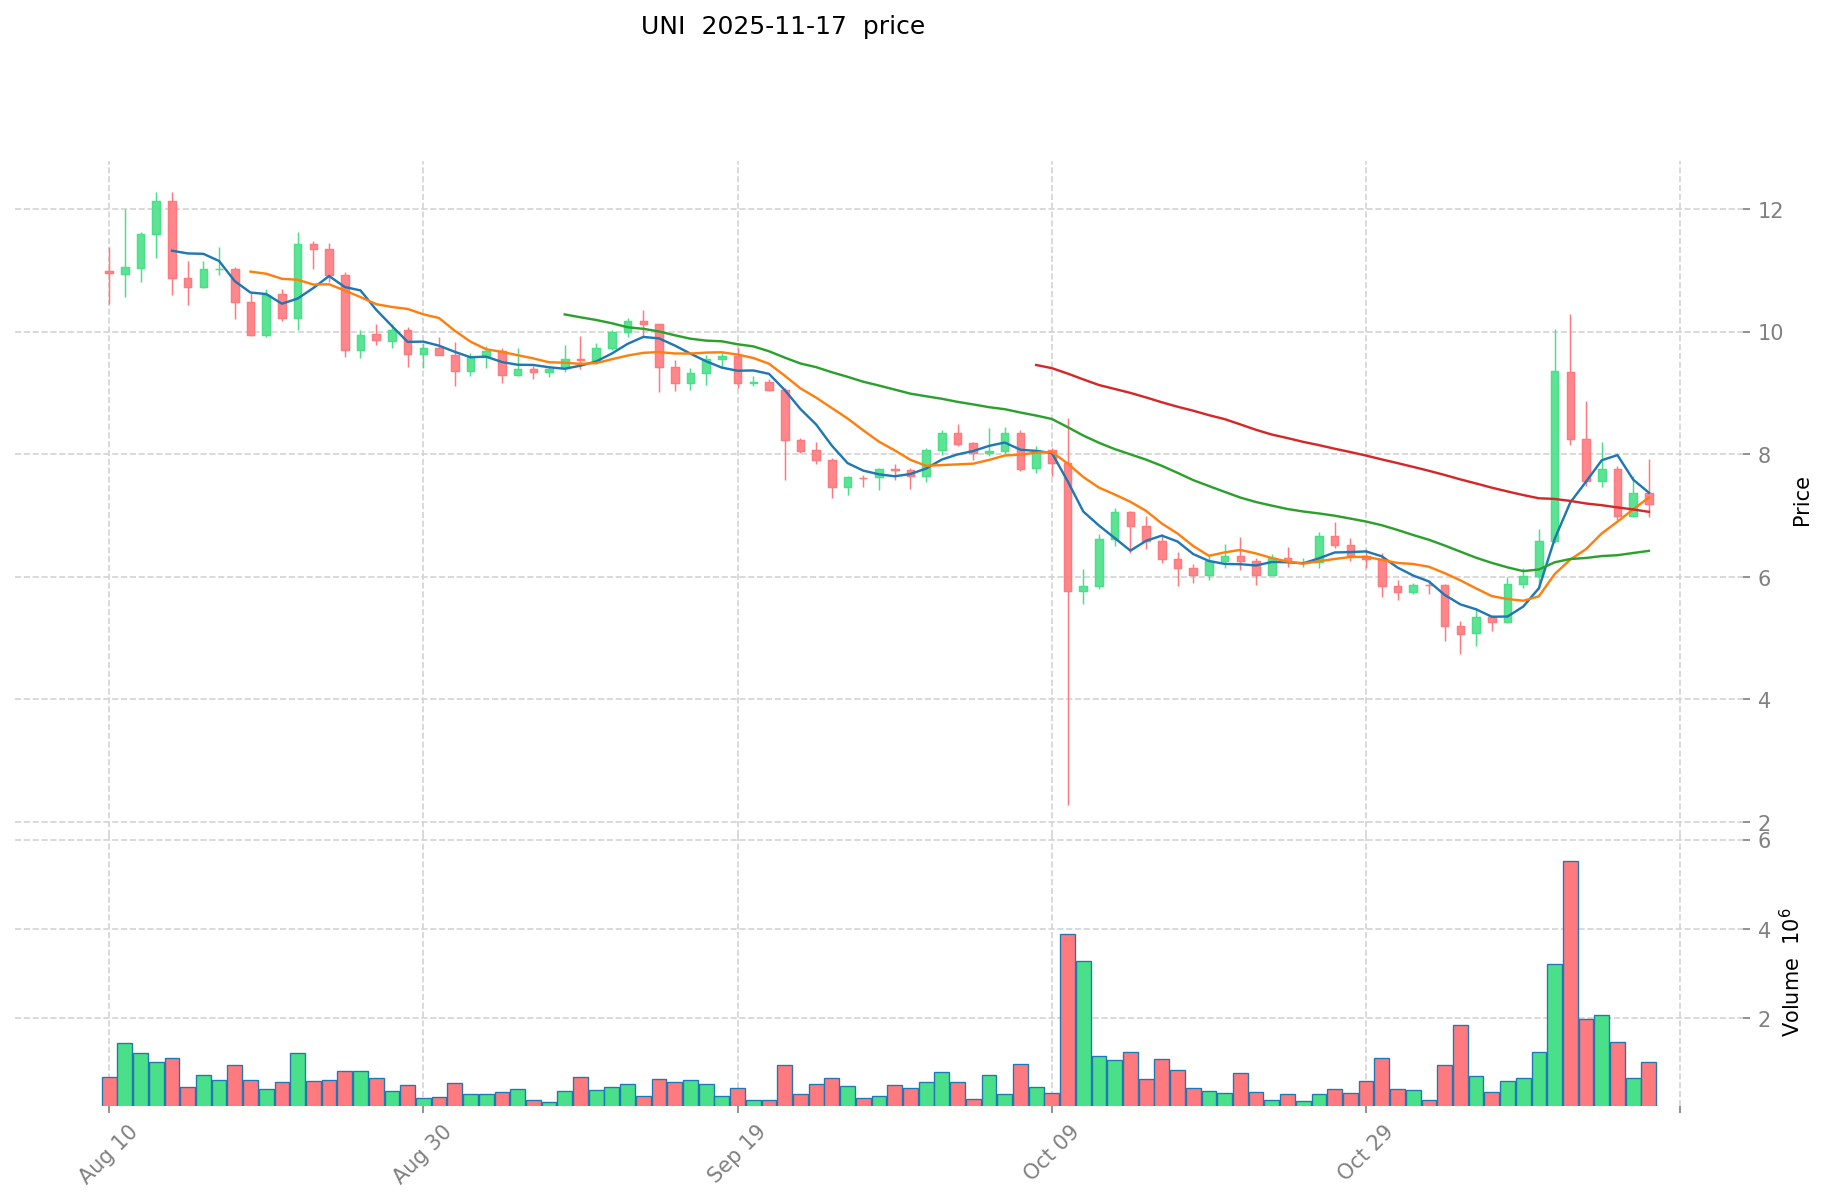
- 2021: UNI hit its all-time high of $44.92 on May 3, demonstrating strong market performance during the bull run.
- Comparative Analysis: In the recent market cycle, XAN experienced a sharp decline from its peak to its lowest point within a short period, while UNI has shown more stability, maintaining a price well above its all-time low of $1.03 set in 2020.
Current Market Situation (2025-11-17)
- XAN current price: $0.02611
- UNI current price: $7.187
- 24-hour trading volume: XAN $983,800.91977 vs UNI $8,192,620.10469
- Market Sentiment Index (Fear & Greed Index): 10 (Extreme Fear)
Click to view real-time prices:
- Check XAN current price Market Price
- Check UNI current price Market Price
II. Core Factors Affecting Investment Value of XAN vs UNI
Supply Mechanism Comparison (Tokenomics)
-
XAN: Fixed supply model with a maximum cap of 50 million tokens, creating scarcity over time
-
UNI: Governance token with an initial supply of 1 billion tokens, with gradual release through community treasury
-
📌 Historical Pattern: Fixed supply tokens like XAN tend to appreciate in value as demand increases against limited supply, while governance tokens like UNI are often influenced by protocol adoption and governance participation rates.
Institutional Adoption and Market Applications
- Institutional Holdings: UNI has gained more institutional traction as a blue-chip DeFi token with significant exchange listings and institutional trading volume
- Enterprise Adoption: UNI offers broader integration with DeFi applications across multiple chains, while XAN focuses on specific cross-chain use cases
- Regulatory Attitudes: Both tokens face varying regulatory scrutiny in different jurisdictions, with DeFi governance tokens generally experiencing more regulatory attention
Technical Development and Ecosystem Building
- XAN Technical Upgrades: Focus on cross-chain interoperability and expanded use cases across DeFi ecosystems
- UNI Technical Development: Continuous improvements to the Uniswap protocol, including V3 deployment across multiple chains and fee structure optimization
- Ecosystem Comparison: UNI has a more established ecosystem with extensive DEX presence, while XAN is building a specialized cross-chain DeFi presence with focused applications
Macroeconomic Factors and Market Cycles
- Performance During Inflation: Fixed-supply tokens like XAN potentially offer better inflation resistance due to supply constraints
- Macroeconomic Monetary Policy: Both tokens show correlation to broader crypto market reactions to interest rate changes
- Geopolitical Factors: Cross-chain capabilities of both tokens provide resilience during regional regulatory changes or restrictions
III. 2025-2030 Price Prediction: XAN vs UNI
Short-term Prediction (2025)
- XAN: Conservative $0.0233 - $0.0262 | Optimistic $0.0262 - $0.0374
- UNI: Conservative $5.061 - $7.23 | Optimistic $7.23 - $9.399
Mid-term Prediction (2027)
- XAN may enter a growth phase, with estimated prices ranging from $0.0220 to $0.0349
- UNI may enter a growth phase, with estimated prices ranging from $6.67 to $9.12
- Key drivers: Institutional capital inflow, ETF, ecosystem development
Long-term Prediction (2030)
- XAN: Base scenario $0.0235 - $0.0428 | Optimistic scenario $0.0428 - $0.0624
- UNI: Base scenario $11.02 - $12.67 | Optimistic scenario $12.67 - $16.72
Disclaimer: The above predictions are based on historical data and market analysis. Cryptocurrency markets are highly volatile and subject to rapid changes. These forecasts should not be considered as financial advice or guarantees of future performance.
XAN:
| 年份 | 预测最高价 | 预测平均价格 | 预测最低价 | 涨跌幅 |
|---|---|---|---|---|
| 2025 | 0.0373945 | 0.02615 | 0.0232735 | 0 |
| 2026 | 0.0359026425 | 0.03177225 | 0.019698795 | 21 |
| 2027 | 0.0348525696375 | 0.03383744625 | 0.0219943400625 | 29 |
| 2028 | 0.049113361359562 | 0.03434500794375 | 0.02335460540175 | 31 |
| 2029 | 0.043815643884239 | 0.041729184651656 | 0.032131472181775 | 59 |
| 2030 | 0.062447724831203 | 0.042772414267947 | 0.023524827847371 | 63 |
UNI:
| 年份 | 预测最高价 | 预测平均价格 | 预测最低价 | 涨跌幅 |
|---|---|---|---|---|
| 2025 | 9.399 | 7.23 | 5.061 | 0 |
| 2026 | 9.229095 | 8.3145 | 6.98418 | 15 |
| 2027 | 9.1226694 | 8.7717975 | 6.6665661 | 22 |
| 2028 | 12.4366544955 | 8.94723345 | 7.15778676 | 24 |
| 2029 | 14.6479632426675 | 10.69194397275 | 8.4466357384725 | 48 |
| 2030 | 16.72433876217555 | 12.66995360770875 | 11.022859638706612 | 76 |
IV. Investment Strategy Comparison: XAN vs UNI
Long-term vs Short-term Investment Strategy
- XAN: Suitable for investors focused on cross-chain interoperability and ecosystem potential
- UNI: Suitable for investors seeking established DeFi exposure and governance participation
Risk Management and Asset Allocation
- Conservative investors: XAN: 20% vs UNI: 80%
- Aggressive investors: XAN: 40% vs UNI: 60%
- Hedging tools: Stablecoin allocation, options, cross-token portfolios
V. Potential Risk Comparison
Market Risk
- XAN: Higher volatility due to lower market cap and trading volume
- UNI: Susceptible to broader DeFi market trends and competitive pressures
Technical Risk
- XAN: Scalability, network stability in cross-chain operations
- UNI: Smart contract vulnerabilities, liquidity pool imbalances
Regulatory Risk
- Global regulatory policies may impact both tokens differently, with UNI potentially facing more scrutiny due to its prominent role in DeFi
VI. Conclusion: Which Is the Better Buy?
📌 Investment Value Summary:
- XAN advantages: Fixed supply, cross-chain focus, potential for growth in emerging interoperability markets
- UNI advantages: Established ecosystem, higher liquidity, broader DeFi integration
✅ Investment Advice:
- New investors: Consider a smaller allocation to XAN for potential growth, larger allocation to UNI for stability
- Experienced investors: Balanced approach with both tokens, adjusting based on risk tolerance and market trends
- Institutional investors: UNI for established DeFi exposure, XAN for diversification into cross-chain technologies
⚠️ Risk Warning: Cryptocurrency markets are highly volatile. This article does not constitute investment advice. None
VII. FAQ
Q1: What are the main differences between XAN and UNI tokens? A: XAN is a fixed supply token focused on cross-chain interoperability, while UNI is a governance token for the Uniswap protocol with broader DeFi integration. XAN has a maximum cap of 50 million tokens, whereas UNI has an initial supply of 1 billion tokens with gradual release.
Q2: Which token has shown better price stability? A: UNI has demonstrated more price stability, maintaining a price well above its all-time low set in 2020. XAN, on the other hand, experienced a sharp decline from its peak to its lowest point within a short period in 2025.
Q3: How do institutional adoption rates compare between XAN and UNI? A: UNI has gained more institutional traction as a blue-chip DeFi token with significant exchange listings and institutional trading volume. XAN, being newer and more specialized, has less institutional adoption at present.
Q4: What are the key technical developments for each token? A: XAN is focusing on cross-chain interoperability and expanded use cases across DeFi ecosystems. UNI is continuously improving the Uniswap protocol, including V3 deployment across multiple chains and fee structure optimization.
Q5: How do the long-term price predictions for XAN and UNI compare? A: For 2030, XAN's base scenario predicts a range of $0.0235 - $0.0428, with an optimistic scenario of $0.0428 - $0.0624. UNI's base scenario for 2030 is $11.02 - $12.67, with an optimistic scenario of $12.67 - $16.72.
Q6: What are the recommended investment strategies for XAN and UNI? A: Conservative investors might consider allocating 20% to XAN and 80% to UNI, while aggressive investors might opt for 40% XAN and 60% UNI. New investors are advised to have a smaller allocation to XAN for potential growth and a larger allocation to UNI for stability.
Q7: What are the main risks associated with investing in XAN and UNI? A: XAN faces higher volatility due to lower market cap and trading volume, as well as technical risks related to scalability and network stability in cross-chain operations. UNI is susceptible to broader DeFi market trends, competitive pressures, and potential smart contract vulnerabilities. Both tokens may face regulatory risks, with UNI potentially experiencing more scrutiny due to its prominent role in DeFi.
Share
Content
Introduction: XAN vs UNI Investment Comparison
I. Price History Comparison and Current Market Status
II. Core Factors Affecting Investment Value of XAN vs UNI
III. 2025-2030 Price Prediction: XAN vs UNI
IV. Investment Strategy Comparison: XAN vs UNI
V. Potential Risk Comparison
VI. Conclusion: Which Is the Better Buy?
VII. FAQ

