SYND ve TRX: İki Gelişmekte Olan Kripto Paranın Performansı ve Potansiyelinin Karşılaştırılması

Giriş: SYND ile TRX Yatırımı Karşılaştırması
Kripto para piyasasında SYND ile TRX’in karşılaştırılması, yatırımcıların kaçınamayacağı bir konudur. Bu iki varlık, piyasa değeri sıralaması, uygulama alanları ve fiyat performansı açısından belirgin farklılıklar gösterirken, kripto varlıklar arasında farklı konumlandırmaları da temsil etmektedir.
Syndicate (SYND): Lansmanından bu yana akıllı rollup ve sequencer teknolojilerindeki yenilikçi yaklaşımıyla piyasa tarafından tanınmıştır.
TRON (TRX): 2017’de piyasaya sürülmüş olup, içerik eğlence sektöründe merkeziyetsiz platform olarak öne çıkmış ve küresel işlem hacmi ile piyasa değeri bakımından önde gelen kripto paralardan biri olmuştur.
Bu yazıda SYND ile TRX’in yatırım değerleri; geçmiş fiyat eğilimleri, arz mekanizmaları, kurumsal benimseme, teknolojik ekosistemler ve geleceğe dair öngörüler kapsamında kapsamlı şekilde analiz edilerek yatırımcıların en çok merak ettiği şu soruya yanıt aranacaktır:
"Şu anda hangisi daha avantajlı bir alım fırsatı sunuyor?"
I. Fiyat Geçmişi Karşılaştırması ve Mevcut Piyasa Durumu
SYND (Coin A) ve TRX (Coin B) Tarihsel Fiyat Eğilimleri
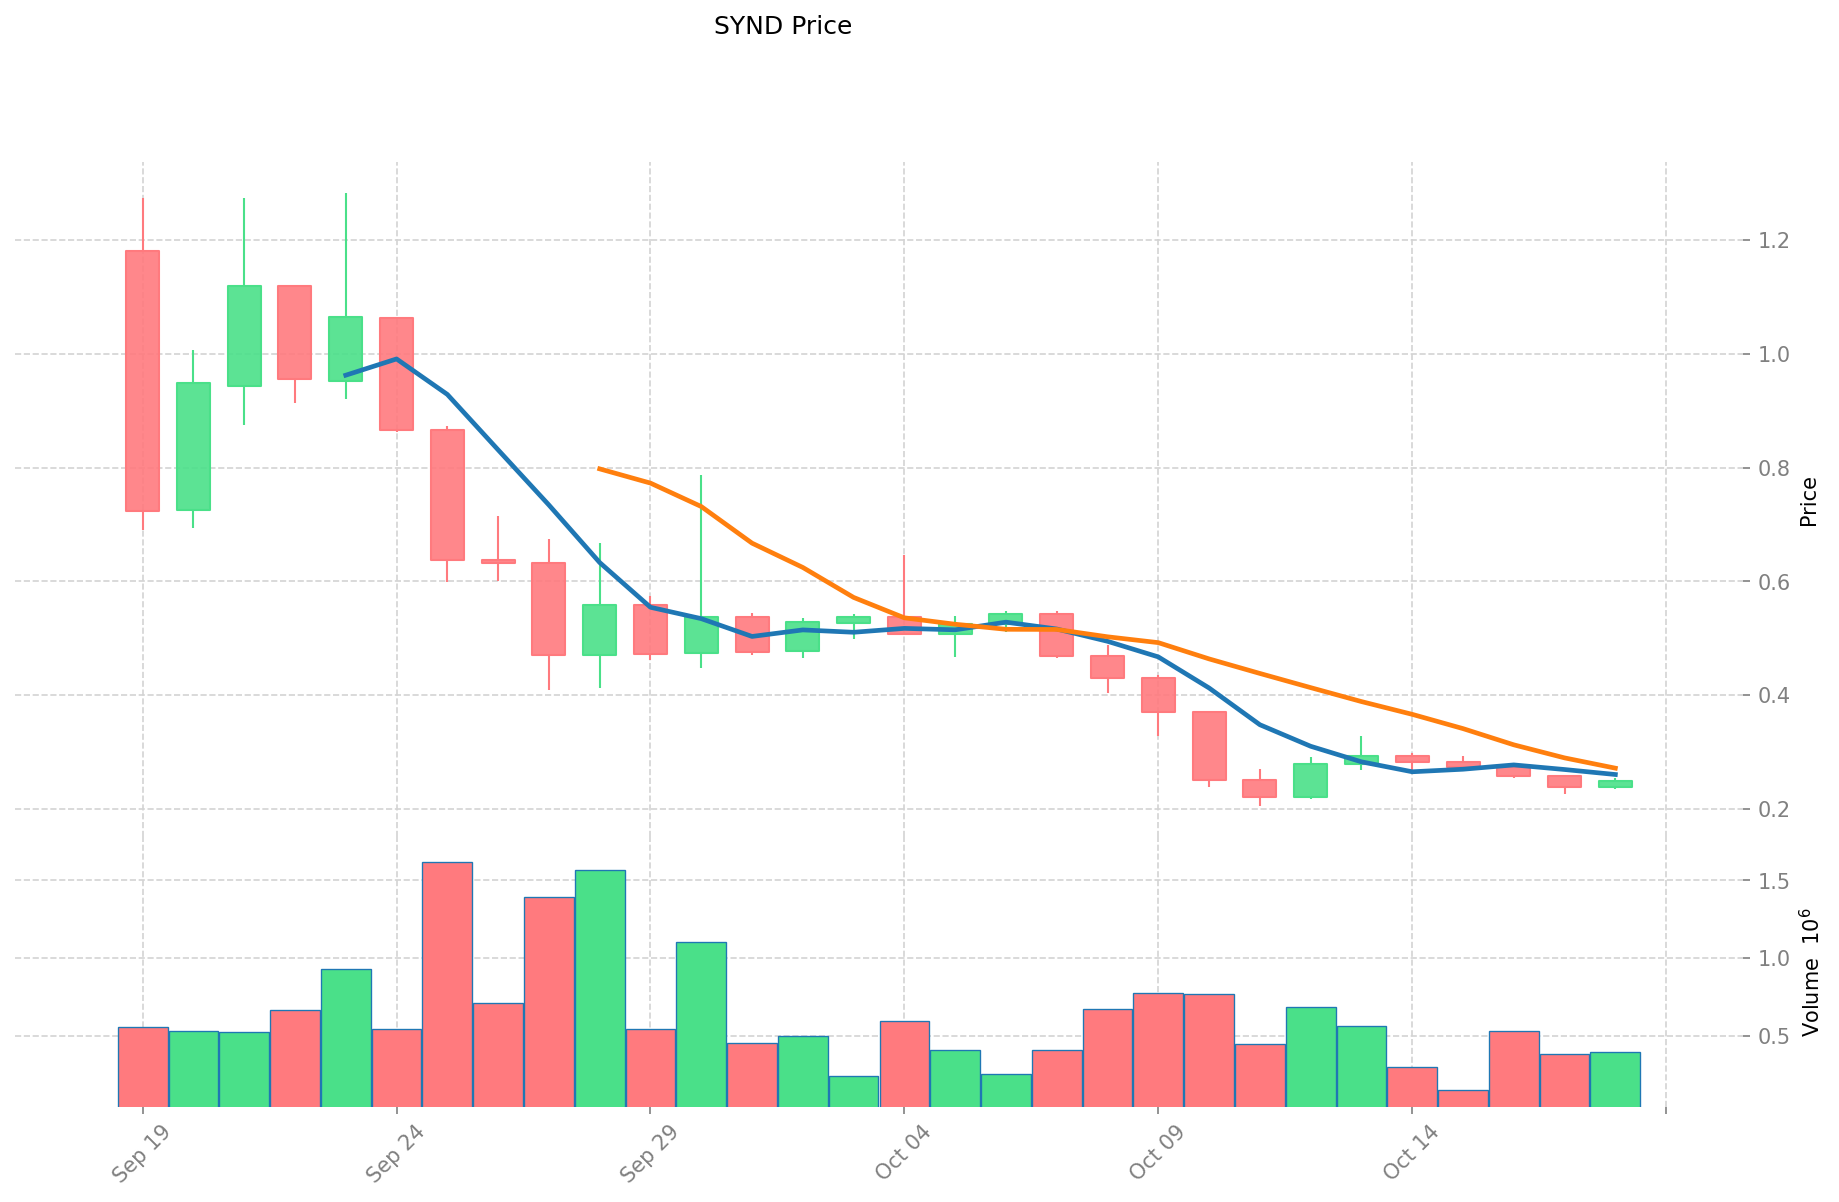
- 2025: SYND, 23 Eylül’de 1,2835 dolar ile tüm zamanların en yüksek seviyesine ulaştı; sonrasında ciddi bir düşüş yaşandı.
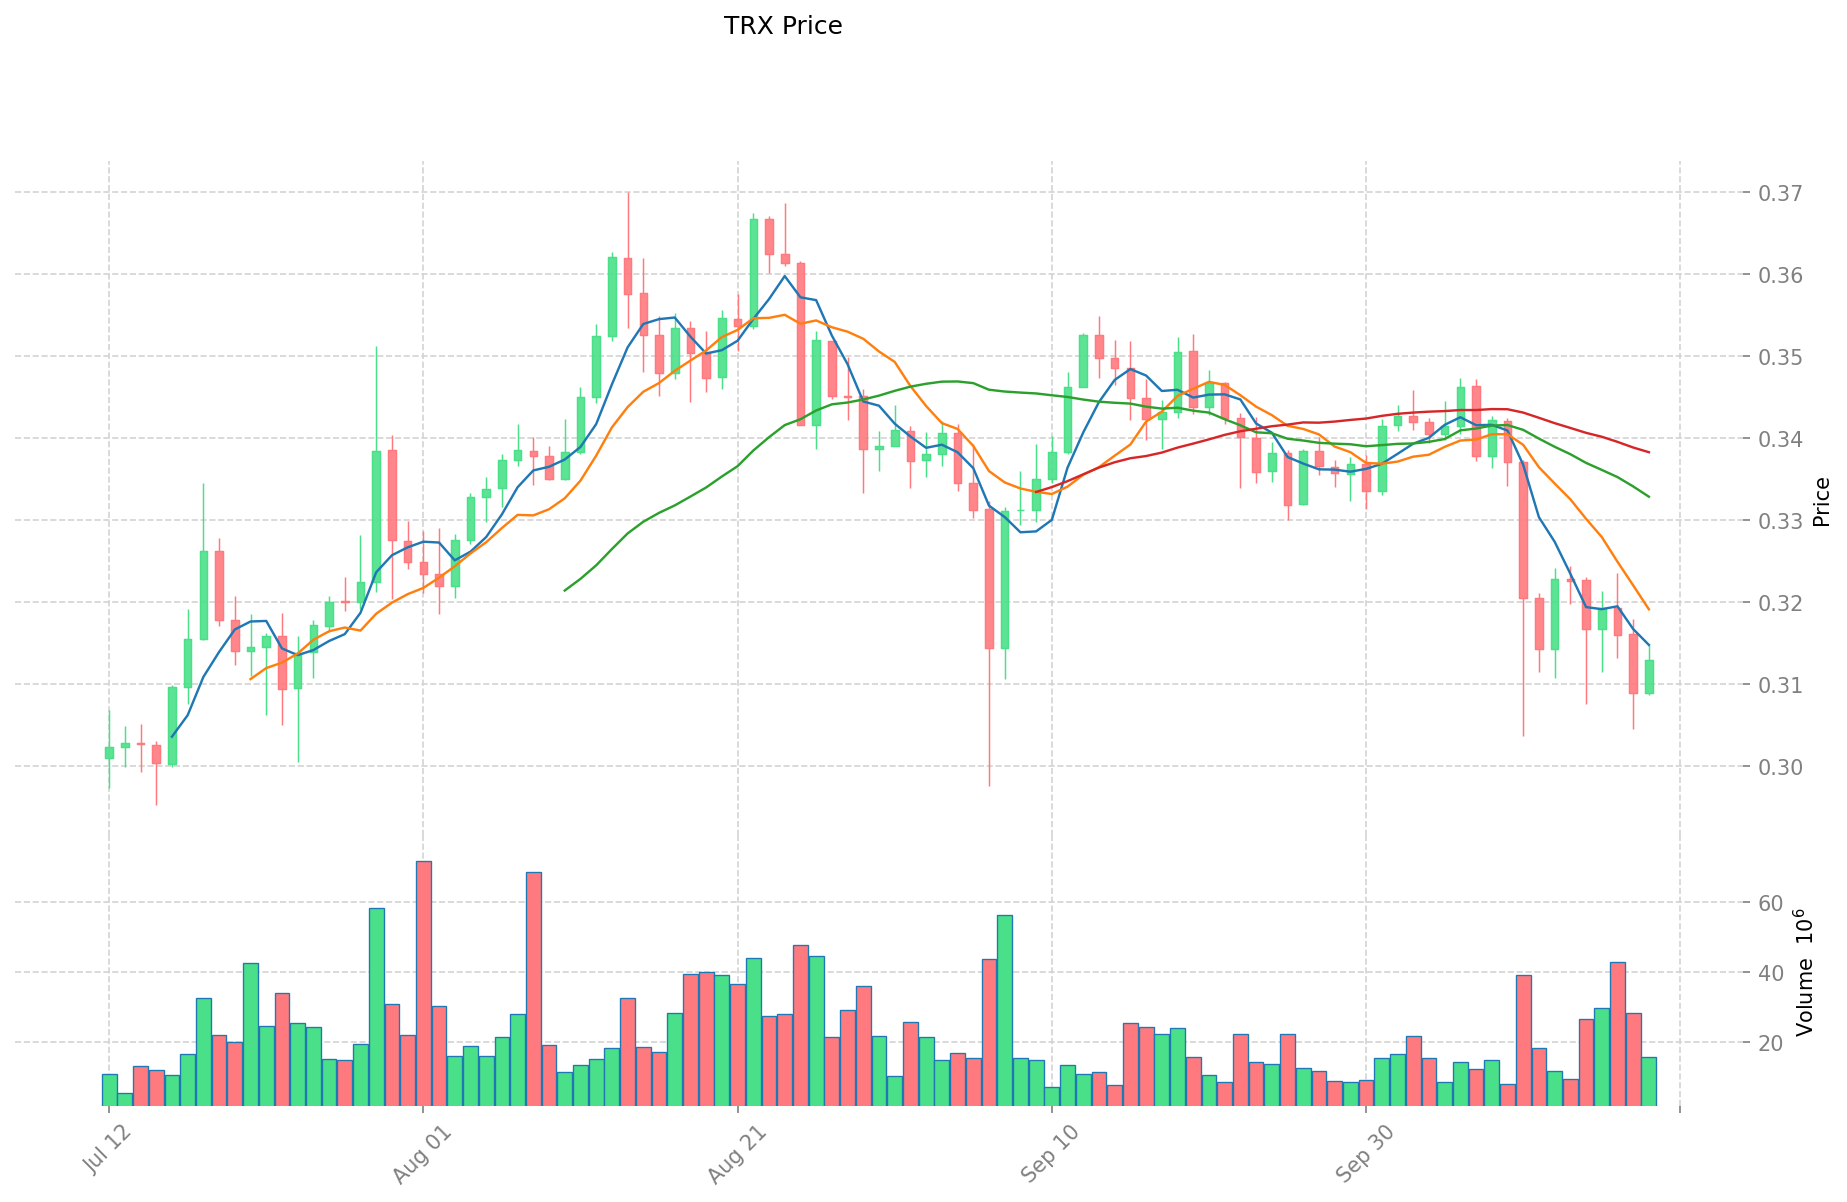
- 2024: TRX, 4 Aralık’ta 0,431288 dolar ile rekor seviyeye ulaşarak güçlü bir performans sergiledi.
- Karşılaştırmalı analiz: Son piyasa evrelerinde SYND, zirveden 0,205 dolara kadar gerilerken TRX daha dengeli ve istikrarlı bir fiyat aralığında seyretti.
Mevcut Piyasa Durumu (19 Ekim 2025)
- SYND güncel fiyatı: 0,2492 dolar
- TRX güncel fiyatı: 0,31311 dolar
- 24 saatlik işlem hacmi: SYND 95.150,90 dolar | TRX 4.886.894,12 dolar
- Piyasa Duyarlılık Endeksi (Korku & Açgözlülük): 29 (Korku)
Gerçek zamanlı fiyatları görmek için tıklayın:
- SYND güncel fiyatı Piyasa Fiyatı
- TRX güncel fiyatı Piyasa Fiyatı
II. SYND ile TRX’in Yatırım Değerini Belirleyen Temel Faktörler
Arz Mekanizması Karşılaştırması (Tokenomik)
- SYND: 888.000.000 adet sabit arz
- TRX: Token yakma mekanizmalı deflasyonist model
- 📌 Tarihsel Örüntü: Sabit arz modelleri genellikle fiyat istikrarı sağlarken, deflasyonist yaklaşımlar dolaşımdaki arzı azalttıkça fiyat üzerinde yukarı yönlü baskı oluşturur.
Kurumsal Benimseme ve Piyasa Kullanımları
- Kurumsal Portföyler: TRX, uzun piyasa geçmişi ve TRON ekosisteminin olgunluğu sayesinde kurumsal tarafta daha geniş kabul görmektedir
- Kurumsal Kullanım: TRX, oyun, eğlence ve uluslararası ödemelerde yaygın kullanıma sahipken; SYND henüz erken benimseme aşamasındadır
- Regülasyon: TRX, farklı ülkelerde çeşitli düzenleyici incelemelere tabi olurken, SYND’nin regülasyon çerçevesi gelişme aşamasındadır
Teknolojik Gelişim ve Ekosistem Oluşumu
- SYND Teknolojik Yükseltmeler: Blockchainler arasında birlikte çalışabilirlikte ilerleme ve daha enerji verimli konsensüs mekanizması
- TRX Teknik Gelişim: TRON ekosisteminde ölçeklenebilirlik ve akıllı kontrat çözümüne güçlü odaklanma
- Ekosistem Karşılaştırması: TRX, DeFi, NFT ve dApp alanlarında olgun bir ekosistem ve yüksek işlem hacmine sahipken; SYND ekosistemi hâlen erken dönemde ve daha az uygulama örneği sunmaktadır
Makroekonomik Etkenler ve Piyasa Döngüleri
- Enflasyon Performansı: TRX, deflasyonist mekanizması sayesinde enflasyon dönemlerinde görece dirençlidir
- Para Politikası Etkisi: Her iki token, ABD Merkez Bankası kararlarının ardından kripto piyasasındaki genel dalgalanmalara hassastır
- Jeopolitik Etkenler: TRX, Asya pazarlarında daha güçlü bir varlığa sahipken SYND’nin kullanıcı dağılımı henüz gelişmektedir
III. 2025-2030 Fiyat Tahmini: SYND ile TRX
Kısa Vadeli Tahmin (2025)
- SYND: Muhafazakâr 0,226772 - 0,2492 dolar | İyimser 0,2492 - 0,333928 dolar
- TRX: Muhafazakâr 0,169074 - 0,3131 dolar | İyimser 0,3131 - 0,341279 dolar
Orta Vadeli Tahmin (2027)
- SYND’in büyüme aşamasına girmesi bekleniyor; tahmini fiyat aralığı 0,315180684 - 0,37684647 dolar
- TRX’in büyüme aşamasına girmesi bekleniyor; tahmini fiyat aralığı 0,23024325115 - 0,52733131715 dolar
- Ana itici güçler: Kurumsal sermaye girişi, ETF’ler, ekosistem gelişimi
Uzun Vadeli Tahmin (2030)
- SYND: Temel senaryo 0,46678687535025 - 0,588151462941315 dolar | İyimser senaryo 0,588151462941315+ dolar
- TRX: Temel senaryo 0,564939881104981 - 0,757019440680674 dolar | İyimser senaryo 0,757019440680674+ dolar
Feragatname: Bu analiz, tarihsel verilere ve projeksiyonlara dayanmaktadır. Kripto piyasaları son derece dalgalı ve öngörülemezdir. Bu bilgiler yatırım tavsiyesi değildir. Yatırım kararı öncesi mutlaka kendi araştırmanızı yapınız.
SYND:
| Yıl | Tahmini En Yüksek Fiyat | Tahmini Ortalama Fiyat | Tahmini En Düşük Fiyat | Fiyat Değişimi (%) |
|---|---|---|---|---|
| 2025 | 0,333928 | 0,2492 | 0,226772 | 0 |
| 2026 | 0,3936114 | 0,291564 | 0,16619148 | 17 |
| 2027 | 0,37684647 | 0,3425877 | 0,315180684 | 37 |
| 2028 | 0,39928596435 | 0,359717085 | 0,3093566931 | 44 |
| 2029 | 0,5540722260255 | 0,379501524675 | 0,26944608251925 | 52 |
| 2030 | 0,588151462941315 | 0,46678687535025 | 0,438779662829235 | 87 |
TRX:
| Yıl | Tahmini En Yüksek Fiyat | Tahmini Ortalama Fiyat | Tahmini En Düşük Fiyat | Fiyat Değişimi (%) |
|---|---|---|---|---|
| 2025 | 0,341279 | 0,3131 | 0,169074 | 0 |
| 2026 | 0,415530665 | 0,3271895 | 0,31410192 | 4 |
| 2027 | 0,52733131715 | 0,3713600825 | 0,23024325115 | 18 |
| 2028 | 0,5122540978005 | 0,449345699825 | 0,28308779088975 | 43 |
| 2029 | 0,649079863397212 | 0,48079989881275 | 0,25001594738263 | 53 |
| 2030 | 0,757019440680674 | 0,564939881104981 | 0,542342285860782 | 80 |
IV. Yatırım Stratejisi Karşılaştırması: SYND ile TRX
Uzun Vadeli ve Kısa Vadeli Yatırım Stratejileri
- SYND: Blockchainler arası birlikte çalışabilirlik ve ekosistem potansiyelini hedefleyen yatırımcılar için ideal
- TRX: Yerleşik ekosistem ve potansiyel istikrar arayanlar için uygun
Risk Yönetimi ve Varlık Dağılımı
- Temkinli yatırımcılar: SYND %20 | TRX %80
- Agresif yatırımcılar: SYND %60 | TRX %40
- Koruma araçları: Stablecoin tahsisi, opsiyonlar, çapraz para portföyleri
V. Potansiyel Risk Karşılaştırması
Piyasa Riskleri
- SYND: Daha küçük piyasa değeri ve yeni proje statüsü nedeniyle yüksek volatilite
- TRX: Daha geniş kripto piyasası trendlerine ve duyarlılık değişimlerine maruz kalma
Teknik Riskler
- SYND: Ölçeklenebilirlik, ağ istikrarı
- TRX: Madencilik gücü yoğunlaşması, güvenlik açıkları
Regülasyon Riskleri
- Küresel regülasyon politikaları her iki token üzerinde farklı etkiler yaratabilir
VI. Sonuç: Hangisi Daha İyi Bir Tercih?
📌 Yatırım Değeri Özeti:
- SYND avantajları: Akıllı rolluplarda yenilikçi yaklaşım, gelişen ekosistemde büyüme potansiyeli
- TRX avantajları: Oturmuş ekosistem, yaygın kurumsal tanınırlık, deflasyonist model
✅ Yatırım Tavsiyesi:
- Yeni başlayan yatırımcılar: TRX’in oturmuş varlığı nedeniyle daha yüksek oranla değerlendirebilir
- Deneyimli yatırımcılar: Risk toleransına göre SYND ve TRX’i dengeli portföyde tutmalı
- Kurumsal yatırımcılar: SYND’nin büyüme potansiyelini inceleyip TRX pozisyonunu ekosistem avantajı için korumalı
⚠️ Risk Uyarısı: Kripto para piyasaları yüksek volatiliteye sahiptir. Bu makale yatırım tavsiyesi değildir. None
VII. Sıkça Sorulan Sorular
S1: SYND ile TRX’in temel farkları nelerdir? C: SYND, akıllı rollup ve sequencer odaklı, 888.000.000 sabit arzlı yeni bir projedir. TRX ise 2017’de piyasaya çıkan, içerik eğlence platformu olarak konumlanan ve deflasyonist model ile token yakma mekanizmasına sahip oturmuş bir platformdur.
S2: Fiyat geçmişine göre hangi kripto para daha iyi performans gösterdi? C: TRX, 2024 Aralık’ta 0,431288 dolara ulaşarak daha istikrarlı bir performans sergiledi. SYND ise 2025 Eylül’de 1,2835 dolarla zirveye ulaştıysa da sonrasında ciddi bir düşüş yaşadı.
S3: SYND ile TRX’in mevcut piyasa durumları nasıl karşılaştırılır? C: 19 Ekim 2025 itibarıyla SYND fiyatı 0,2492 dolar ve 24 saatlik işlem hacmi 95.150,90 dolar; TRX fiyatı 0,31311 dolar ve 24 saatlik işlem hacmi 4.886.894,12 dolar.
S4: SYND ile TRX’in yatırım değerini belirleyen ana faktörler nelerdir? C: Arz mekanizmaları, kurumsal benimseme, teknik gelişim, ekosistem oluşumu ve enflasyon ile para politikası gibi makroekonomik faktörler öne çıkar.
S5: SYND ile TRX’in uzun vadeli fiyat tahminleri nasıl karşılaştırılır? C: 2030 için SYND’nin temel senaryosu 0,46678687535025 - 0,588151462941315 dolar; TRX’in temel senaryosu ise 0,564939881104981 - 0,757019440680674 dolar aralığıdır.
S6: SYND ile TRX yatırımlarında karşılaşılan başlıca riskler nelerdir? C: Her iki token kripto volatilitesine bağlı piyasa riskleriyle karşılaşır. SYND, düşük piyasa değeri ve yeni olmasından ötürü daha yüksek volatilite taşır. TRX ise madencilik gücü yoğunlaşması ve genel piyasa trendlerine karşı risk taşır. Her iki varlık için de regülasyon riskleri devam etmektedir.
S7: Farklı yatırımcı tipleri için hangi kripto para daha iyi bir seçenek olarak görülür? C: Yeni yatırımcılar TRX’i tercih edebilir. Deneyimli yatırımcılar dengeli portföyler oluşturabilir. Kurumsal yatırımcılar ise SYND’de büyüme potansiyelini değerlendirirken TRX’i ekosistem avantajı için portföylerinde tutabilir.
Share
Content
Giriş: SYND ile TRX Yatırımı Karşılaştırması
I. Fiyat Geçmişi Karşılaştırması ve Mevcut Piyasa Durumu
II. SYND ile TRX’in Yatırım Değerini Belirleyen Temel Faktörler
III. 2025-2030 Fiyat Tahmini: SYND ile TRX
IV. Yatırım Stratejisi Karşılaştırması: SYND ile TRX
V. Potansiyel Risk Karşılaştırması
VI. Sonuç: Hangisi Daha İyi Bir Tercih?
VII. Sıkça Sorulan Sorular
How to Buy Cryptocurrency


Trending Cryptocurrencies


LTO ve TRX: Hangi Blockchain Platformu Daha Yüksek Ölçeklenebilirlik ve İşlem Hızı Sağlıyor?

SLIM vs TRX: Fitness Hedefleriniz İçin Hangi Suspension Training Sistemi Daha Uygun?
OL ve TRX: Hangi Suspension Training Sistemi Fitness Hedeflerinize Daha Uygun?

MBG vs TRX: Evde egzersiz yapmak isteyenler için iki popüler fitness ekipmanının karşılaştırılması
VINE vs TRX: Evde Antrenmanlara Yönelik Süspansiyon Antrenman Sistemlerinin Karşılaştırılması

SC vs TRX: Dijital Varlık Ekosisteminde İki Popüler Kripto Paranın Karşılaştırılması

Yapay Zekâ ile Sanat Oluşturma: NFT Üretimi İçin En İyi Araçlar

Konsorsiyum Blockchain'i Anlamak: Temel Özellikler ve Avantajlar
Delegated Proof of Stake (DPoS) Kavramının İncelenmesi

Kripto Kopya Ticaretinde En İyi Platformlar: Başlangıç Seviyesine Uygun Alternatifler
Kripto muslukları üzerinden ücretsiz kripto para kazanabileceğiniz en iyi uygulamalar