LTO ve TRX: Hangi Blockchain Platformu Daha Yüksek Ölçeklenebilirlik ve İşlem Hızı Sağlıyor?


Giriş: LTO ve TRX Yatırımı Karşılaştırması
Kripto para piyasasında LTO ile TRX karşılaştırması, yatırımcıların sıklıkla gündeme aldığı bir konudur. Her iki varlık, piyasa değeri sıralaması, kullanım alanları ve fiyat performansı açısından belirgin farklılıklar taşırken, kripto varlık dünyasında farklı konumları da temsil etmektedir.
LTO Network (LTO): 2014’te piyasaya sürülmesinden bu yana, işletmeler arası hibrit blockchain platformuyla piyasa tarafından tanınmıştır.
TRON (TRX): 2017’de faaliyete geçtiğinden beri merkeziyetsiz içerik eğlence protokolü olarak öne çıkmış, küresel işlem hacmi ve piyasa değeri bakımından önde gelen kripto paralardan biri olmuştur.
Bu makale; LTO ve TRX’in yatırım değerini, tarihsel fiyat eğilimleri, arz mekanizmaları, kurumsal benimseme, teknolojik ekosistem ve gelecek projeksiyonları çerçevesinde karşılaştırmalı olarak analiz edecek ve yatırımcıların en çok merak ettiği soruyu yanıtlamaya çalışacaktır:
"Şu anda hangisi daha avantajlı bir alım?" I. Fiyat Geçmişi Karşılaştırması ve Güncel Piyasa Durumu
LTO ve TRX Tarihsel Fiyat Eğilimleri
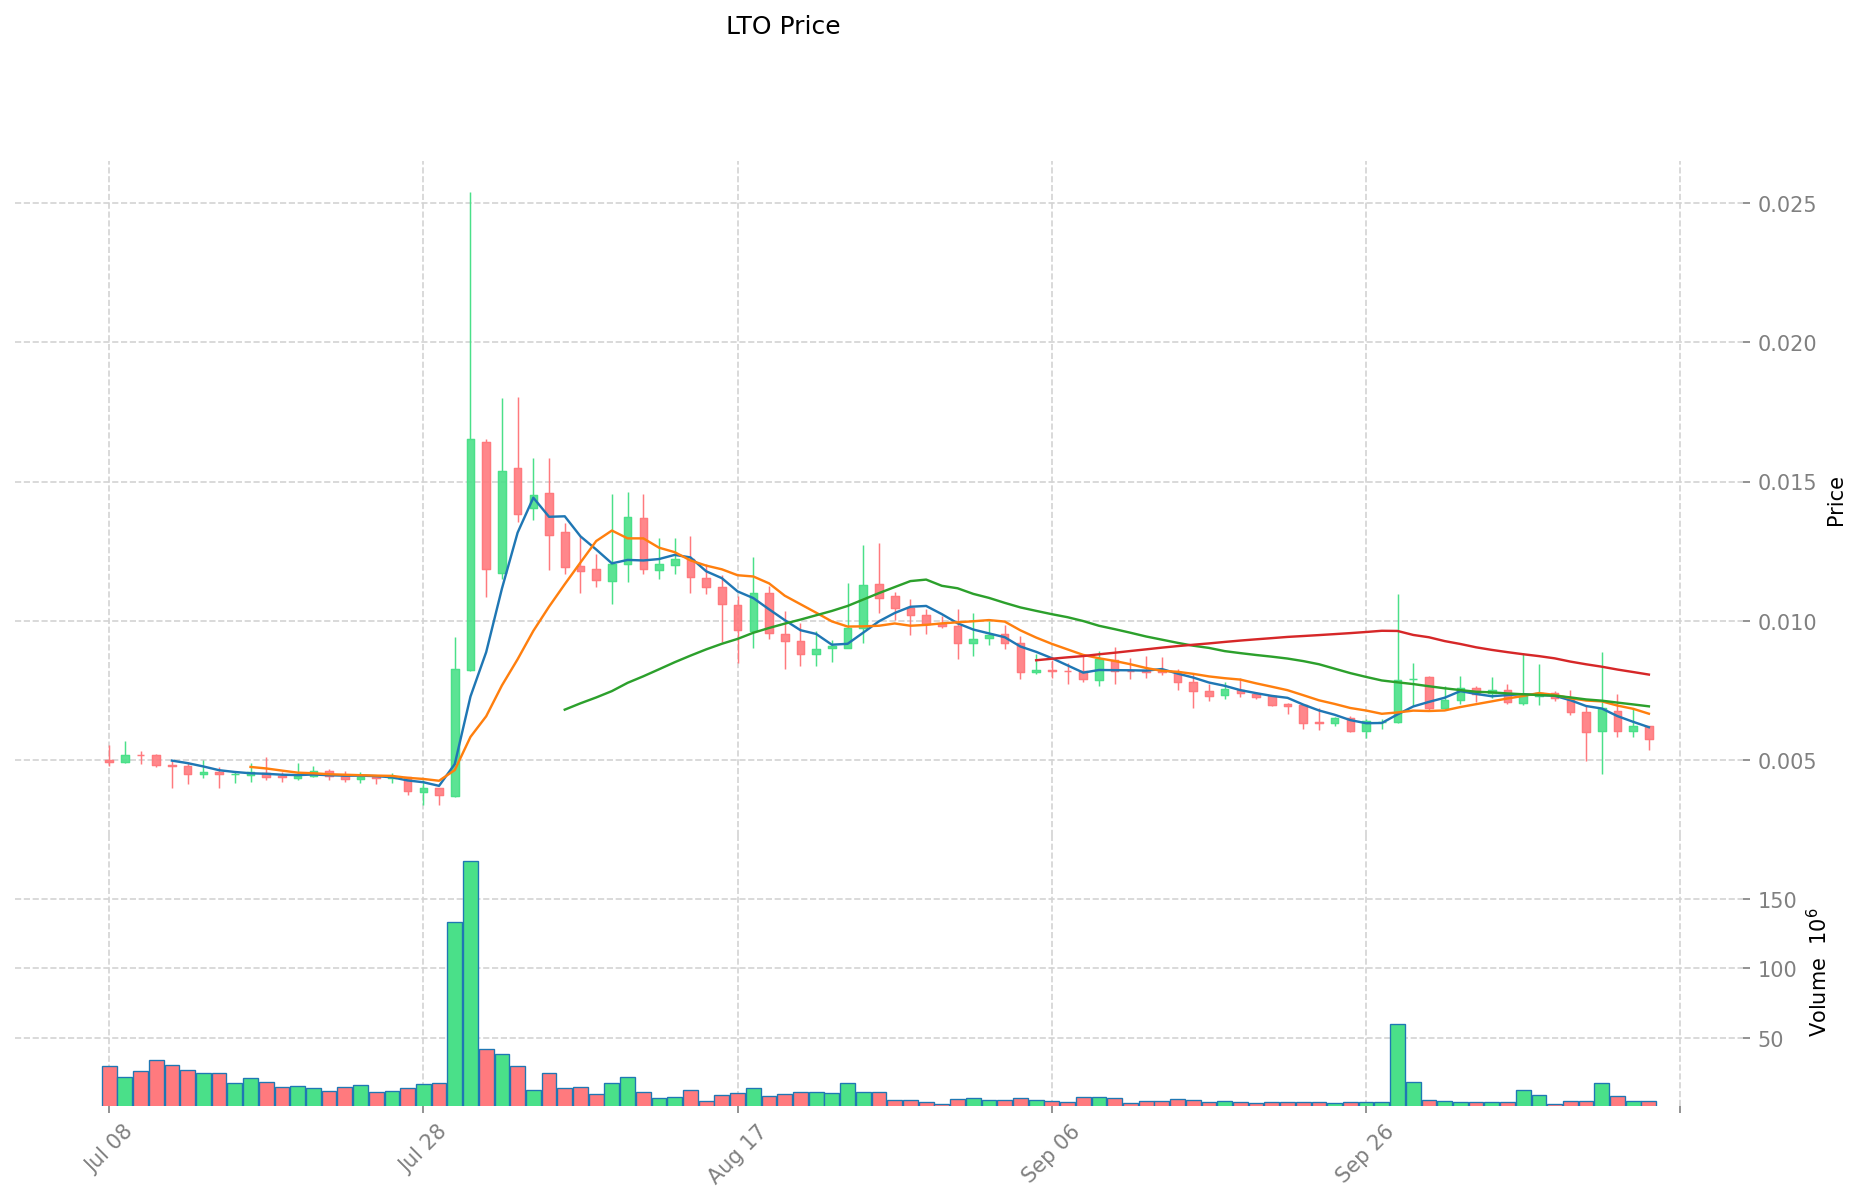
- 2021: LTO, artan benimseme ve piyasa ilgisiyle 0,901021 $ ile tüm zamanların en yüksek seviyesine ulaştı.
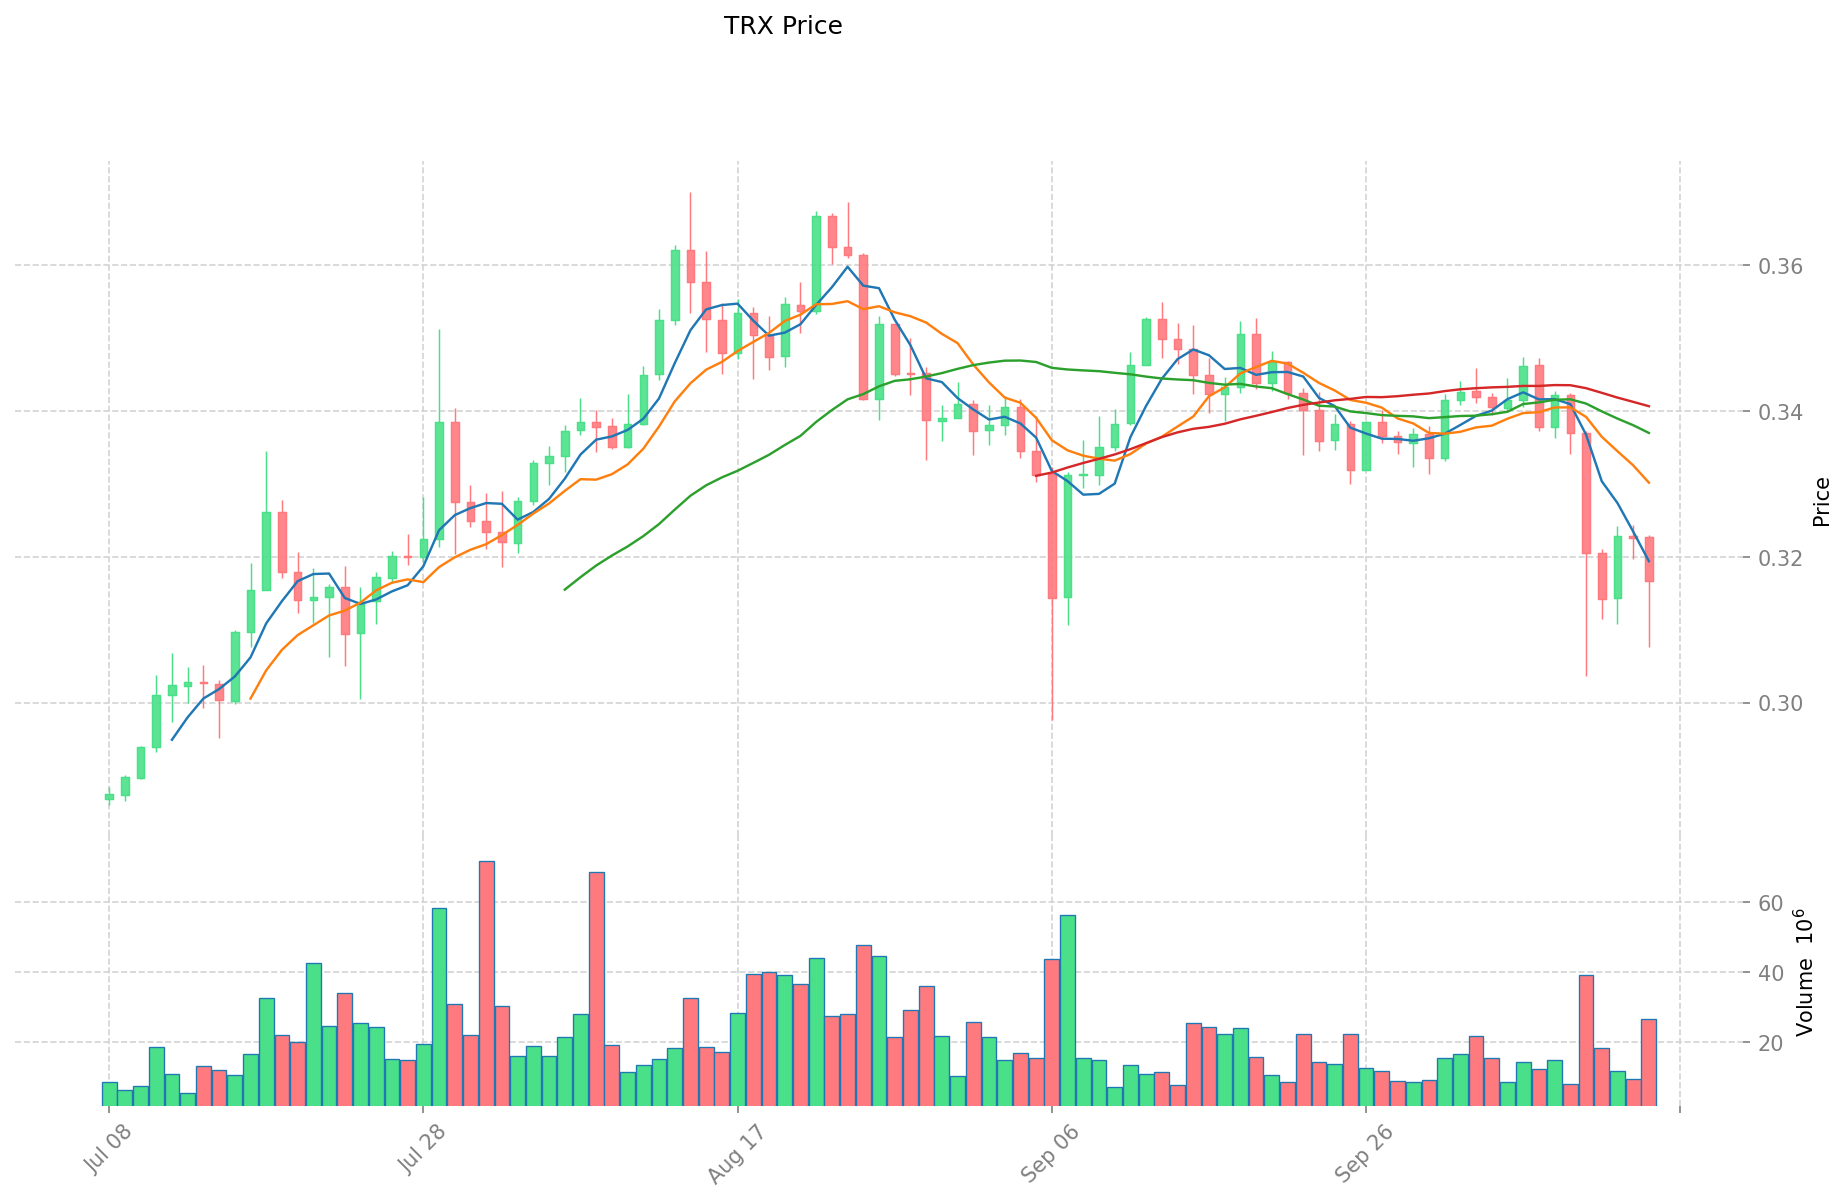
- 2024: TRX, ekosistem büyümesi ve iş birliklerinin etkisiyle yıllık en yüksek seviyesi olan 0,44948 $’a çıktı.
- Karşılaştırmalı analiz: Son piyasa döngüsünde LTO, zirveden 0,0032098 $ seviyesine gerilerken; TRX, daha istikrarlı bir seyir izleyerek yüksek fiyat bandını korudu.
Güncel Piyasa Durumu (15 Ekim 2025)
- LTO güncel fiyatı: 0,005767 $
- TRX güncel fiyatı: 0,31705 $
- 24 saatlik işlem hacmi: 25.522,84 $ (LTO) ve 8.296.757,33 $ (TRX)
- Piyasa Duyarlılığı Endeksi (Korku & Açgözlülük Endeksi): 38 (Korku)
Anlık fiyatları görüntülemek için tıklayın:
- LTO güncel fiyatı Piyasa Fiyatı
- TRX güncel fiyatı Piyasa Fiyatı
II. LTO ve TRX Yatırım Değerini Etkileyen Temel Unsurlar
Arz Mekanizmaları Karşılaştırması (Tokenomik)
- LTO: Değeri, ağdaki depolama talebine bağlıdır
- TRX: Değeri, uygulama kullanımı ve piyasa likiditesiyle şekillenir
- 📌 Tarihsel Trend: Arz mekanizmaları, piyasa eğilimleri ve teknik beklentilere bağlı olarak fiyat döngülerini yönlendirir.
Kurumsal Benimseme ve Piyasa Uygulamaları
- Kurumsal portföyler: Piyasa trendleri doğrultusunda değerlendirme gerekir
- Kurumsal benimseme: Yatırım değeri, projenin potansiyeli ve piyasa gereksinimleriyle ilişkilidir
- Düzenleyici yaklaşım: Yatırım değerlendirmeleri için piyasa eğilimleri ve teknik görünüm dikkate alınmalıdır
Teknoloji Gelişimi ve Ekosistem Oluşumu
- Teknik gelişim: Her iki tokenın değeri, teknolojik ilerlemeye bağlıdır
- Piyasa değerlendirmesi: Yatırım değeri, mevcut piyasa ihtiyaçları ve gelecekteki teknik gelişmelerle bağlantılıdır
- Ekosistem karşılaştırması: Değer analizi, kullanım senaryoları ve likidite üzerinden yapılmalıdır
Makroekonomik Faktörler ve Piyasa Döngüleri
- Enflasyon ortamında performans: Yatırım öncesi analiz gerektirir
- Para politikası etkisi: Piyasa trendleri yatırım değerini şekillendirir
- Jeopolitik faktörler: Yatırım öncesi piyasa eğilimleri ve teknik görünüm analiz edilmelidir
III. 2025-2030 Fiyat Tahmini: LTO ve TRX
Kısa Vadeli Tahmin (2025)
- LTO: Temkinli 0,00374595 $ - 0,005763 $ | İyimser 0,005763 $ - 0,00835635 $
- TRX: Temkinli 0,1805589 $ - 0,31677 $ | İyimser 0,31677 $ - 0,3262731 $
Orta Vadeli Tahmin (2027)
- LTO, büyüme aşamasına geçebilir; fiyat aralığı 0,004612791645 $ - 0,01093402464 $ olarak tahmin ediliyor
- TRX, istikrarlı bir döneme geçebilir; fiyat aralığı 0,3183867148875 $ - 0,427012770555 $ öngörülüyor
- Temel etkenler: Kurumsal sermaye girişi, ETF ve ekosistem gelişimi
Uzun Vadeli Tahmin (2030)
- LTO: Temel senaryo 0,012858938322355 $ - 0,01234458078946 $ | İyimser senaryo 0,01234458078946 $ - 0,017616745501626 $
- TRX: Temel senaryo 0,447905868644826 $ - 0,237390110381757 $ | İyimser senaryo 0,447905868644826 $ - 0,51509174894155 $
Yasal Uyarı: Bu analiz, geçmiş piyasa verileri ve projeksiyonlara dayanmaktadır. Kripto para piyasası yüksek oynaklık ve öngörülemezliğe sahiptir. Buradaki bilgiler yatırım tavsiyesi değildir. Yatırım kararı almadan önce kendi araştırmanızı yapınız.
LTO:
| Yıl | Tahmini En Yüksek Fiyat | Tahmini Ortalama Fiyat | Tahmini En Düşük Fiyat | Fiyat Değişimi (%) |
|---|---|---|---|---|
| 2025 | 0,00835635 | 0,005763 | 0,00374595 | 0 |
| 2026 | 0,0100247385 | 0,007059675 | 0,0049417725 | 22 |
| 2027 | 0,01093402464 | 0,00854220675 | 0,004612791645 | 48 |
| 2028 | 0,01353598081605 | 0,009738115695 | 0,0060376317309 | 69 |
| 2029 | 0,014080828389185 | 0,011637048255525 | 0,008844156674199 | 102 |
| 2030 | 0,017616745501626 | 0,012858938322355 | 0,01234458078946 | 123 |
TRX:
| Yıl | Tahmini En Yüksek Fiyat | Tahmini Ortalama Fiyat | Tahmini En Düşük Fiyat | Fiyat Değişimi (%) |
|---|---|---|---|---|
| 2025 | 0,3262731 | 0,31677 | 0,1805589 | 0 |
| 2026 | 0,4276236615 | 0,32152155 | 0,276508533 | 1 |
| 2027 | 0,427012770555 | 0,37457260575 | 0,3183867148875 | 18 |
| 2028 | 0,42484024944165 | 0,4007926881525 | 0,23245975912845 | 26 |
| 2029 | 0,482995268492577 | 0,412816468797075 | 0,210536399086508 | 30 |
| 2030 | 0,51509174894155 | 0,447905868644826 | 0,237390110381757 | 41 |
IV. Yatırım Stratejisi Karşılaştırması: LTO ve TRX
Uzun Vadeli ve Kısa Vadeli Yatırım Stratejisi
- LTO: İş dünyası odaklı blockchain çözümleri ve B2B uygulamalarına yatırım yapanlar için uygundur
- TRX: Ekosistem çeşitliliği ve içerik dağıtım platformlarına erişim arayan yatırımcılar için uygundur
Risk Yönetimi ve Varlık Dağılımı
- Temkinli yatırımcılar: LTO %20, TRX %80
- Agresif yatırımcılar: LTO %40, TRX %60
- Koruma araçları: Stablecoin tahsisi, opsiyonlar, çapraz token portföyleri
V. Potansiyel Risk Karşılaştırması
Piyasa Riski
- LTO: Düşük piyasa değeri ve işlem hacmi nedeniyle yüksek oynaklık
- TRX: Genel piyasa trendleri ve DeFi sektöründeki dalgalanmalardan daha fazla etkilenebilir
Teknik Risk
- LTO: Ölçeklenebilirlik ve ağ istikrarı riskleri
- TRX: Hash gücü yoğunlaşması ve potansiyel güvenlik açıkları
Düzenleyici Risk
- Küresel düzenleyici politikalar her iki tokenı farklı şekilde etkileyebilir; TRX, daha büyük piyasa varlığı nedeniyle daha fazla incelemeye tabi olabilir
VI. Sonuç: Hangisi Daha Avantajlı?
📌 Yatırım Değeri Özeti:
- LTO avantajları: Kurumsal odaklı blockchain, B2B benimseme potansiyeli
- TRX avantajları: Gelişmiş ekosistem, yüksek likidite, içerik dağıtımına odaklanma
✅ Yatırım Tavsiyesi:
- Yeni başlayanlar: Daha yerleşik ekosistem için TRX’e düşük oranlı portföy ayrılabilir
- Deneyimli yatırımcılar: Hem LTO hem TRX ile farklı blockchain kullanım alanlarında dengeli portföy oluşturulabilir
- Kurumsal yatırımcılar: Her iki projenin detaylı incelemesi yapılmalı; TRX’in piyasa varlığı ve LTO’nun kurumsal çözümleri dikkate alınabilir
⚠️ Risk Uyarısı: Kripto para piyasası yüksek oynaklığa sahiptir. Bu makale yatırım tavsiyesi değildir. None
VII. Sıkça Sorulan Sorular
S1: LTO ve TRX arasındaki temel farklar nelerdir? C: LTO, kurumsal odaklı bir blockchain platformudur; TRX ise merkeziyetsiz içerik eğlence protokolüdür. LTO, düşük piyasa değeri ve işlem hacmine sahipken, B2B uygulamalarına odaklanır; TRX ise geniş ekosistem ve yüksek likiditeyle içerik dağıtımı ve DeFi uygulamalarını hedefler.
S2: Hangi token daha fazla fiyat istikrarı sunuyor? C: Geçmiş veriler TRX’in LTO’ya göre daha istikrarlı fiyat performansı sergilediğini gösteriyor. TRX, son piyasa döngülerinde yüksek fiyat aralığını korurken, LTO tüm zamanların en yüksek seviyesinden daha sert bir düşüş yaşadı.
S3: LTO ve TRX’in arz mekanizmaları nasıl farklıdır? C: LTO’nun değeri, ağda depolama talebine bağlıdır; TRX’in değeri ise ekosistemdeki uygulamalar ve piyasa likiditesinden etkilenir. Tokenomikteki bu farklar fiyat döngülerini ve piyasa davranışını etkiler.
S4: LTO ve TRX için uzun vadeli fiyat beklentileri nedir? C: 2030’da LTO için temel senaryo fiyat aralığı 0,012858938322355 $ - 0,01234458078946 $; iyimser senaryo ise 0,01234458078946 $ - 0,017616745501626 $. TRX için temel aralık 0,447905868644826 $ - 0,237390110381757 $; iyimser aralık ise 0,447905868644826 $ - 0,51509174894155 $’dır.
S5: Yatırımcılar portföylerini LTO ve TRX arasında nasıl dağıtmalı? C: Temkinli yatırımcılar için önerilen dağılım %20 LTO ve %80 TRX; agresif yatırımcılar için %40 LTO ve %60 TRX olabilir. Bu genel önerilerdir, yatırımcılar risk tercihi ve piyasa analizine göre dağılımı kendileri belirlemelidir.
S6: LTO ve TRX yatırımlarının başlıca riskleri nelerdir? C: LTO, düşük piyasa değeri ve işlem hacmi nedeniyle yüksek oynaklık ve ölçeklenebilirlik ile ağ istikrarı riskleri taşır. TRX ise piyasa trendleri ve DeFi dalgalanmalarına daha açık olup, hash gücü yoğunlaşması ve güvenlik açıkları gibi riskler taşır. Her iki token da değişen düzenleyici politikalardan etkilenebilir.
Share
Content
How to Buy Cryptocurrency


Trending Cryptocurrencies


SYND ve TRX: İki Gelişmekte Olan Kripto Paranın Performansı ve Potansiyelinin Karşılaştırılması

SLIM vs TRX: Fitness Hedefleriniz İçin Hangi Suspension Training Sistemi Daha Uygun?

OL ve TRX: Hangi Suspension Training Sistemi Fitness Hedeflerinize Daha Uygun?
MBG vs TRX: Evde egzersiz yapmak isteyenler için iki popüler fitness ekipmanının karşılaştırılması

VINE vs TRX: Evde Antrenmanlara Yönelik Süspansiyon Antrenman Sistemlerinin Karşılaştırılması

SC vs TRX: Dijital Varlık Ekosisteminde İki Popüler Kripto Paranın Karşılaştırılması
Dropee Günlük Kombinasyonu 11 Aralık 2025
Tomarket Günlük Kombinasyonu 11 Aralık 2025

Merkeziyetsiz Finans'ta Geçici Kayıp Nedir?

Kripto Parada Çifte Harcama: Önleme Stratejileri

Kripto Ticaretinde Wyckoff Yönteminin Anlaşılması