MTRG vs OP: Comparing Two Innovative Blockchain Scaling Solutions
Introduction: MTRG vs OP Investment Comparison
In the cryptocurrency market, the comparison between Meter (MTRG) vs Optimism (OP) has been an unavoidable topic for investors. The two not only show significant differences in market cap ranking, application scenarios, and price performance, but also represent different positions in the crypto asset landscape.
Meter (MTRG): Since its launch, it has gained market recognition for its positioning as an EVM high-performance public chain based on the HotStuff2 consensus.
Optimism (OP): Since its inception, it has been hailed as a low-cost, lightning-fast Ethereum Layer 2 blockchain solution, addressing the practical needs of developers and users.
This article will comprehensively analyze the investment value comparison between MTRG and OP, focusing on historical price trends, supply mechanisms, institutional adoption, technological ecosystems, and future predictions, attempting to answer the question investors care about most:
"Which is the better buy right now?"
I. Price History Comparison and Current Market Status
MTRG (Coin A) and OP (Coin B) Historical Price Trends
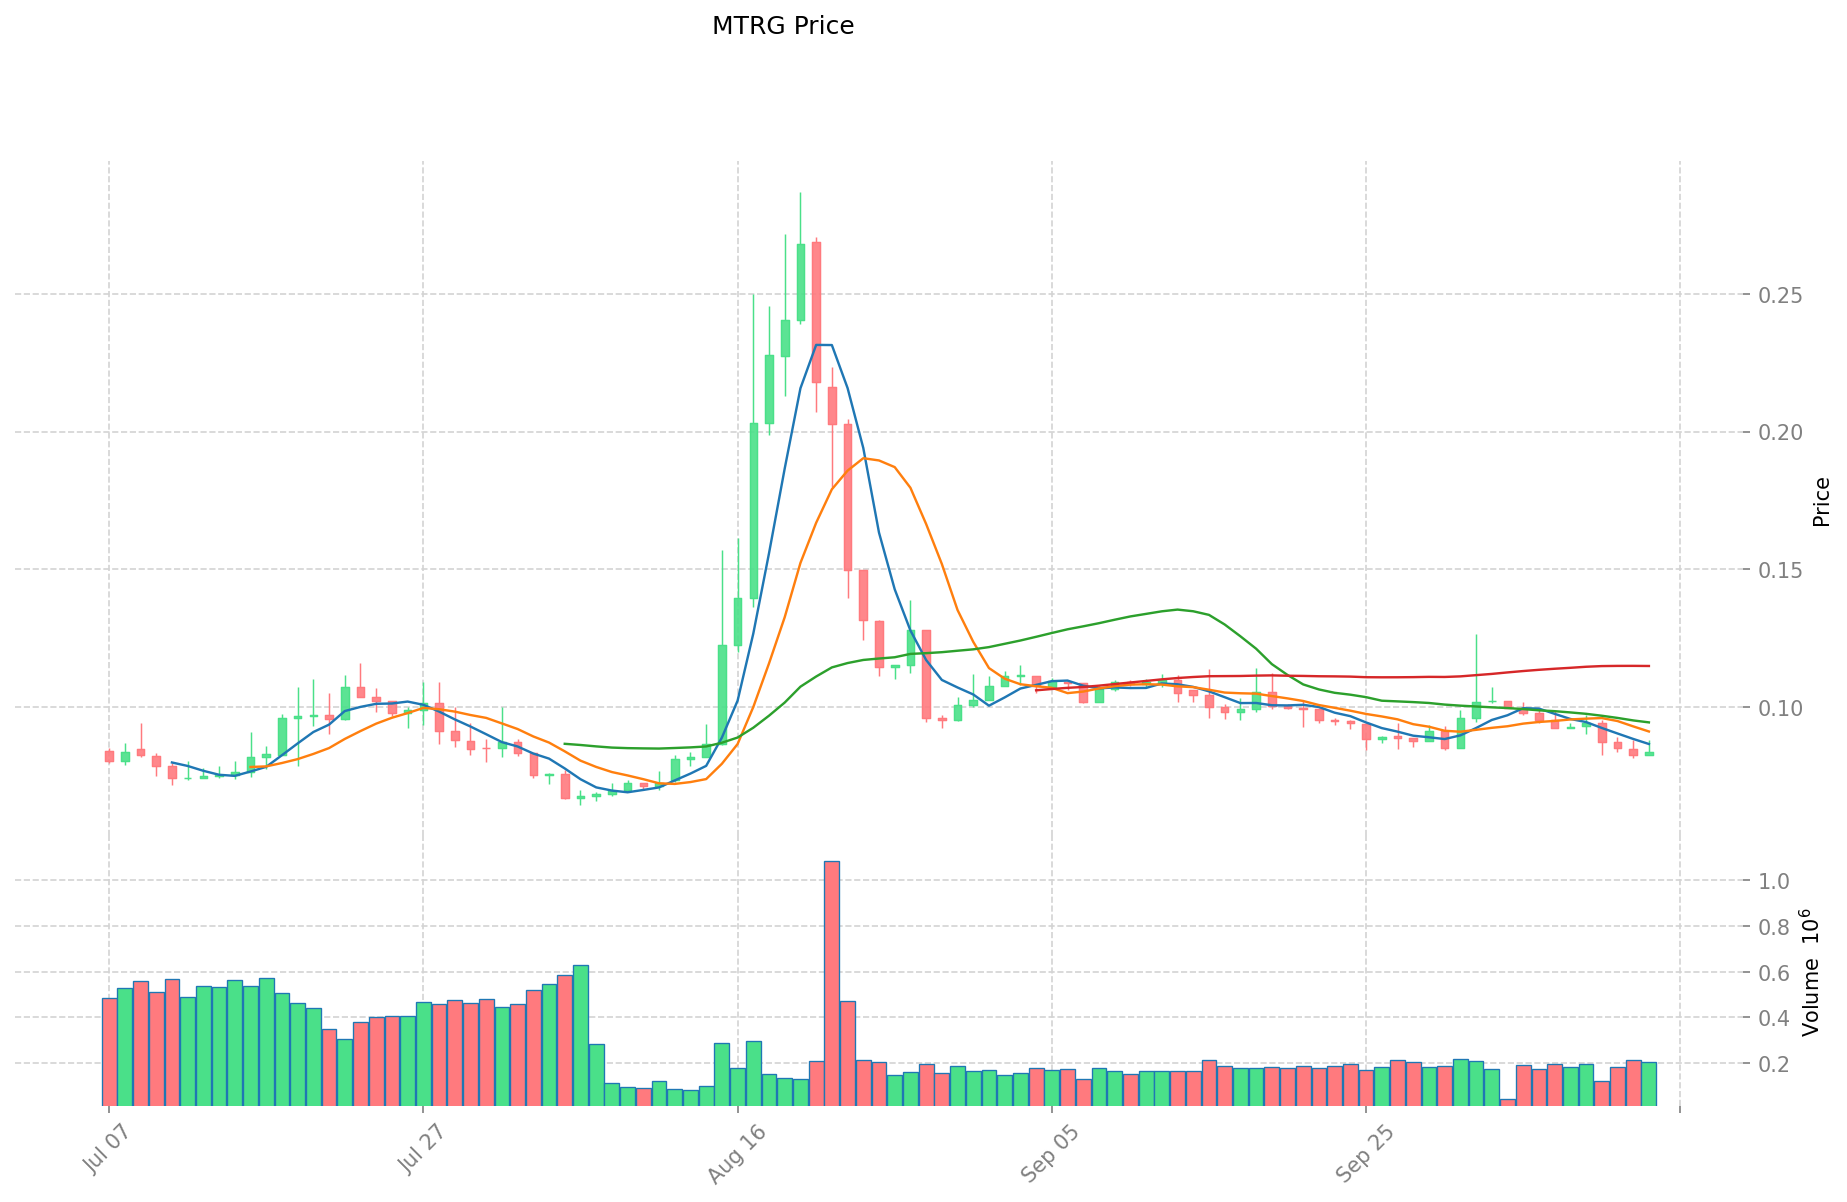
- 2021: MTRG reached its all-time high of $16.47 on November 3, 2021.
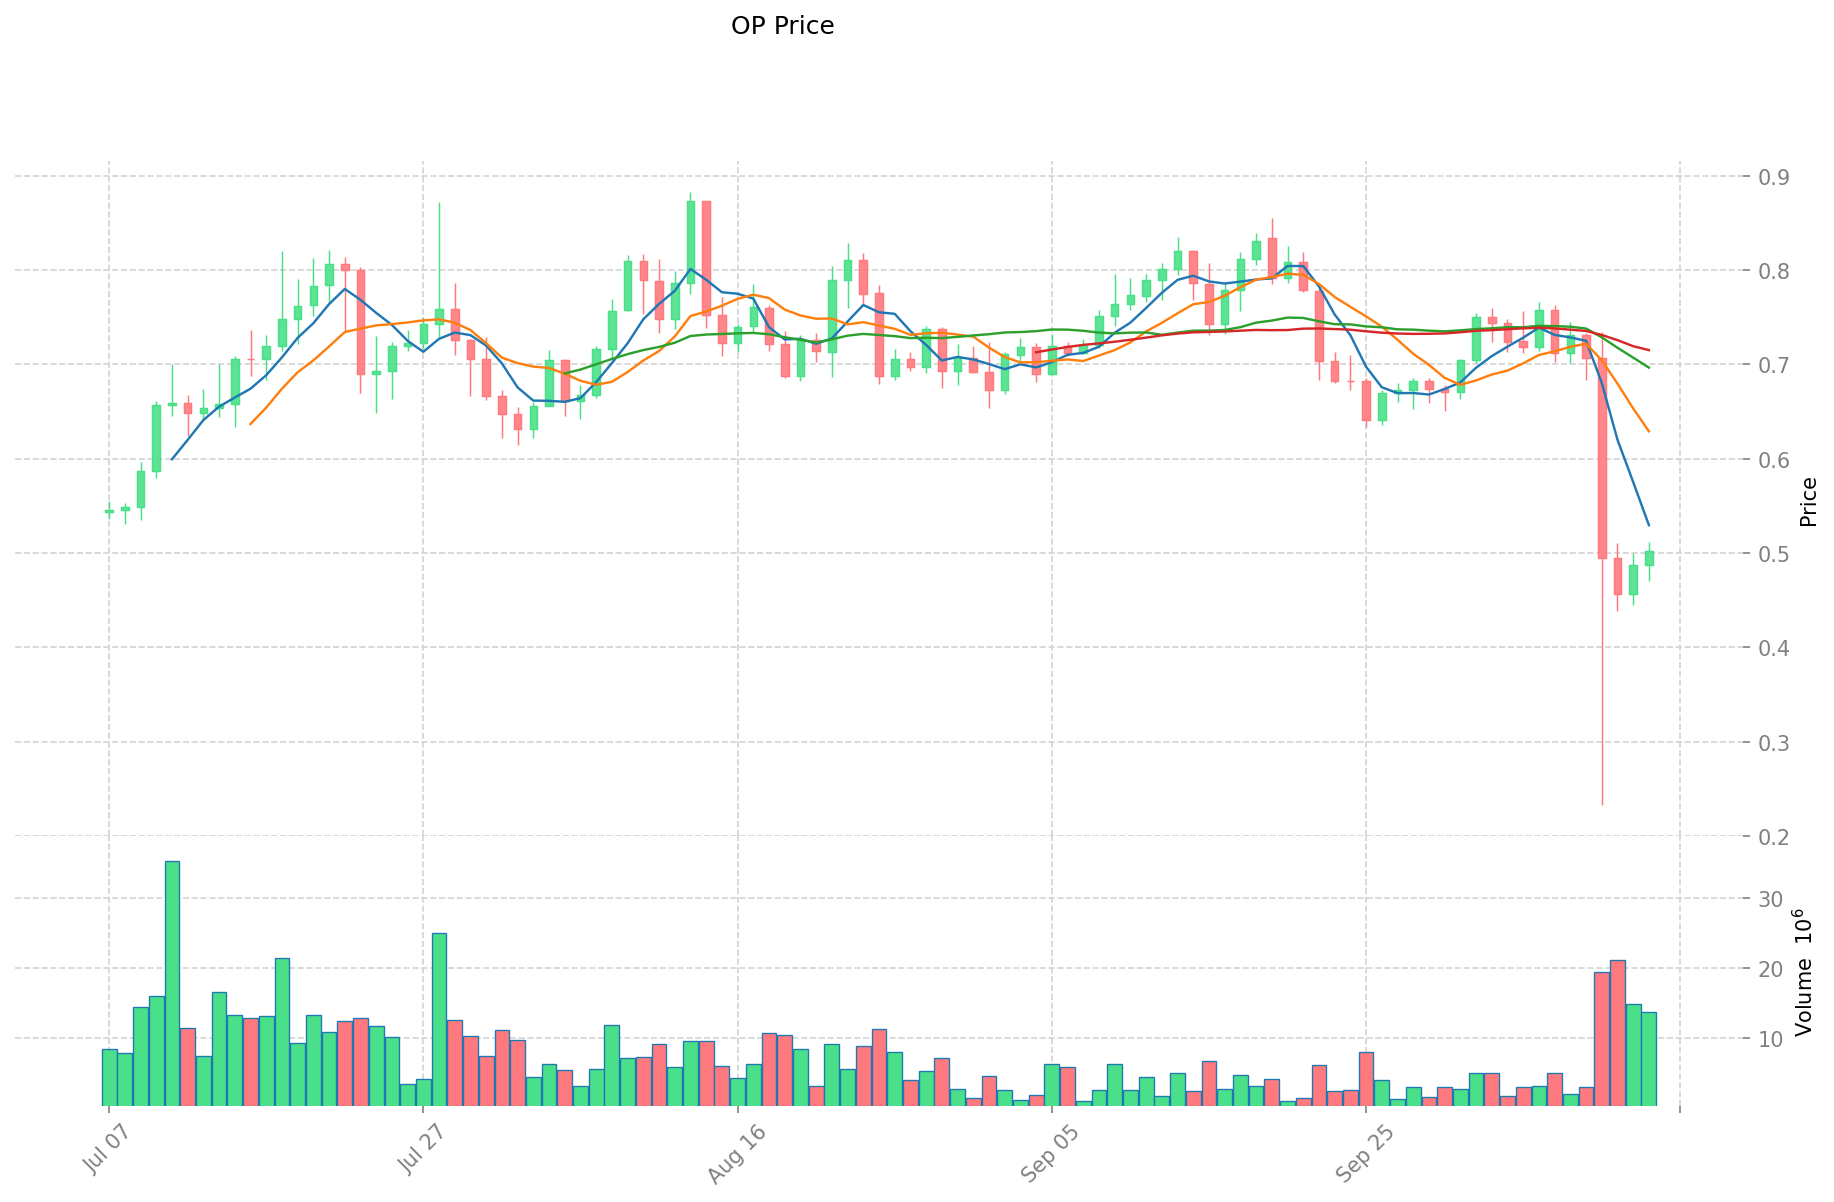
- 2024: OP hit its all-time high of $4.84 on March 6, 2024.
- Comparative analysis: MTRG has fallen from its high of $16.47 to a current price of $0.08372, while OP has declined from $4.84 to $0.5035.
Current Market Situation (2025-10-14)
- MTRG current price: $0.08372
- OP current price: $0.5035
- 24-hour trading volume: MTRG $17,250.35 vs OP $6,600,020.76
- Market Sentiment Index (Fear & Greed Index): 38 (Fear)
Click to view real-time prices:
- View MTRG current price Market Price
- View OP current price Market Price
II. Core Factors Affecting the Investment Value of MTRG vs OP
Supply Mechanism Comparison (Tokenomics)
- MTRG: Fixed maximum supply of 100 million tokens, with a deflationary mechanism through token burns during transactions.
- OP: Initial supply of 4.29 billion tokens with gradual distribution through airdrops, ecosystem funding, and governance allocation.
- 📌 Historical pattern: Deflationary models like MTRG's tend to create upward price pressure long-term, while OP's distribution schedule may cause periodic supply increases affecting price stability.
Institutional Adoption and Market Applications
- Institutional holdings: OP has gained more significant institutional backing through Optimism Foundation partnerships and venture capital investments.
- Enterprise adoption: OP has stronger enterprise integration through Optimism's scaling solutions for Ethereum applications, while MTRG focuses on decentralized financial services in the Meter ecosystem.
- Regulatory attitudes: Both tokens face similar regulatory environments as utility tokens, with neither experiencing specific regulatory targeting.
Technical Development and Ecosystem Building
- MTRG technical upgrades: Implementation of HotStuff consensus algorithm and Layer 2 interoperability solutions for enhanced security and cross-chain functionality.
- OP technical development: Continuous improvement of Optimistic Rollups technology, enhancing transaction throughput and reducing costs on Ethereum.
- Ecosystem comparison: OP has a more mature ecosystem with established DeFi protocols, NFT marketplaces, and dApps leveraging Ethereum compatibility, while MTRG focuses on stablecoin infrastructure and interoperability between blockchain networks.
Macroeconomic Factors and Market Cycles
- Performance in inflationary environments: MTRG's fixed supply model potentially offers better inflation resistance compared to OP's expanding supply.
- Macroeconomic monetary policy: Both tokens show sensitivity to interest rates and USD strength, with OP demonstrating higher correlation to overall crypto market movements.
- Geopolitical factors: MTRG's cross-chain infrastructure may offer advantages during periods of regulatory uncertainty or regional restrictions on crypto activities.
III. 2025-2030 Price Prediction: MTRG vs OP
Short-term Prediction (2025)
- MTRG: Conservative $0.0627-$0.0848 | Optimistic $0.0848-$0.0916
- OP: Conservative $0.4085-$0.5043 | Optimistic $0.5043-$0.5346
Mid-term Prediction (2027)
- MTRG may enter a growth phase, with prices expected in the range of $0.0700-$0.1170
- OP may enter a consolidation phase, with prices expected in the range of $0.4503-$0.7311
- Key drivers: Institutional capital inflow, ETFs, ecosystem development
Long-term Prediction (2030)
- MTRG: Base scenario $0.1157-$0.1493 | Optimistic scenario $0.1493-$0.1493
- OP: Base scenario $0.8877-$1.0297 | Optimistic scenario $1.0297-$1.0297
Disclaimer
MTRG:
| 年份 | 预测最高价 | 预测平均价格 | 预测最低价 | 涨跌幅 |
|---|---|---|---|---|
| 2025 | 0.0915732 | 0.08479 | 0.0627446 | 1 |
| 2026 | 0.096117944 | 0.0881816 | 0.056436224 | 5 |
| 2027 | 0.11703021044 | 0.092149772 | 0.07003382672 | 10 |
| 2028 | 0.1234161896396 | 0.10458999122 | 0.0972686918346 | 24 |
| 2029 | 0.117423183142694 | 0.1140030904298 | 0.087782379630946 | 36 |
| 2030 | 0.149269946454258 | 0.115713136786247 | 0.074056407543198 | 38 |
OP:
| 年份 | 预测最高价 | 预测平均价格 | 预测最低价 | 涨跌幅 |
|---|---|---|---|---|
| 2025 | 0.534558 | 0.5043 | 0.408483 | 0 |
| 2026 | 0.54020616 | 0.519429 | 0.47787468 | 3 |
| 2027 | 0.7311482604 | 0.52981758 | 0.450344943 | 5 |
| 2028 | 0.926809892694 | 0.6304829202 | 0.479167019352 | 25 |
| 2029 | 0.99666740025216 | 0.778646406447 | 0.65406298141548 | 54 |
| 2030 | 1.029682007885512 | 0.88765690334958 | 0.683495815579176 | 76 |
IV. Investment Strategy Comparison: MTRG vs OP
Long-term vs Short-term Investment Strategies
- MTRG: Suitable for investors focused on cross-chain infrastructure and deflationary tokenomics
- OP: Suitable for investors interested in Ethereum scaling solutions and Layer 2 ecosystem growth
Risk Management and Asset Allocation
- Conservative investors: MTRG: 20% vs OP: 80%
- Aggressive investors: MTRG: 40% vs OP: 60%
- Hedging tools: Stablecoin allocation, options, cross-currency portfolios
V. Potential Risk Comparison
Market Risk
- MTRG: Higher volatility due to lower market cap and trading volume
- OP: Susceptible to Ethereum ecosystem fluctuations and Layer 2 competition
Technical Risk
- MTRG: Scalability, network stability
- OP: Dependence on Ethereum's development, potential vulnerabilities in rollup technology
Regulatory Risk
- Global regulatory policies may impact both tokens, with OP potentially facing more scrutiny due to its closer integration with Ethereum
VI. Conclusion: Which Is the Better Buy?
📌 Investment Value Summary:
- MTRG advantages: Deflationary model, cross-chain infrastructure potential
- OP advantages: Established ecosystem, strong institutional backing, Ethereum scaling solution
✅ Investment Advice:
- New investors: Consider allocating a larger portion to OP due to its established market position
- Experienced investors: Balanced approach with exposure to both MTRG and OP
- Institutional investors: Focus on OP for its liquidity and ecosystem integration
⚠️ Risk Warning: The cryptocurrency market is highly volatile. This article does not constitute investment advice. None
VII. FAQ
Q1: What are the key differences between MTRG and OP in terms of tokenomics? A: MTRG has a fixed maximum supply of 100 million tokens with a deflationary mechanism through token burns, while OP has an initial supply of 4.29 billion tokens with gradual distribution through airdrops, ecosystem funding, and governance allocation.
Q2: Which token has shown better price performance historically? A: OP has shown better price performance historically. While MTRG has fallen from its all-time high of $16.47 to $0.08372, OP has declined from $4.84 to $0.5035, maintaining a higher relative value.
Q3: How do MTRG and OP differ in terms of institutional adoption? A: OP has gained more significant institutional backing through Optimism Foundation partnerships and venture capital investments, while MTRG has less prominent institutional support.
Q4: What are the main technical focuses of MTRG and OP? A: MTRG focuses on implementing the HotStuff consensus algorithm and Layer 2 interoperability solutions, while OP concentrates on improving Optimistic Rollups technology for enhancing Ethereum's transaction throughput and reducing costs.
Q5: How do the ecosystems of MTRG and OP compare? A: OP has a more mature ecosystem with established DeFi protocols, NFT marketplaces, and dApps leveraging Ethereum compatibility. MTRG focuses on stablecoin infrastructure and interoperability between blockchain networks.
Q6: What are the long-term price predictions for MTRG and OP by 2030? A: For MTRG, the base scenario predicts $0.1157-$0.1493, with an optimistic scenario of $0.1493. For OP, the base scenario predicts $0.8877-$1.0297, with an optimistic scenario of $1.0297.
Q7: How should investors allocate their portfolio between MTRG and OP? A: Conservative investors might consider allocating 20% to MTRG and 80% to OP, while aggressive investors might opt for 40% MTRG and 60% OP. New investors may want to allocate a larger portion to OP due to its established market position.
Share
Content