MOONEY vs BCH: The Battle for Cryptocurrency Supremacy in the Digital Age
Introduction: MOONEY vs BCH Investment Comparison
In the cryptocurrency market, the comparison between MoonDAO (MOONEY) vs Bitcoin Cash (BCH) has been an unavoidable topic for investors. The two not only show significant differences in market cap ranking, application scenarios, and price performance, but also represent different positions in the crypto asset space.
MoonDAO (MOONEY): Launched in 2022, it has gained market recognition for its mission to democratize access to space research and exploration.
Bitcoin Cash (BCH): Since its inception in 2017, it has been hailed as a "peer-to-peer electronic cash system," and is one of the most traded and valuable cryptocurrencies globally.
This article will comprehensively analyze the investment value comparison between MOONEY and BCH, focusing on historical price trends, supply mechanisms, institutional adoption, technological ecosystems, and future predictions, attempting to answer the question investors care about most:
"Which is the better buy right now?"
I. Price History Comparison and Current Market Status
MOONEY and BCH Historical Price Trends
- 2022: MOONEY launched, with price fluctuations typical of new cryptocurrencies.
- 2017: BCH was created through a Bitcoin hard fork, experiencing significant price volatility.
- Comparative analysis: During the 2022 crypto market downturn, MOONEY dropped from its all-time high of $0.0053678 to a low of $0.0001001, while BCH declined from its peak of $3,785.82 in 2017 to a low of $76.93 in 2018.
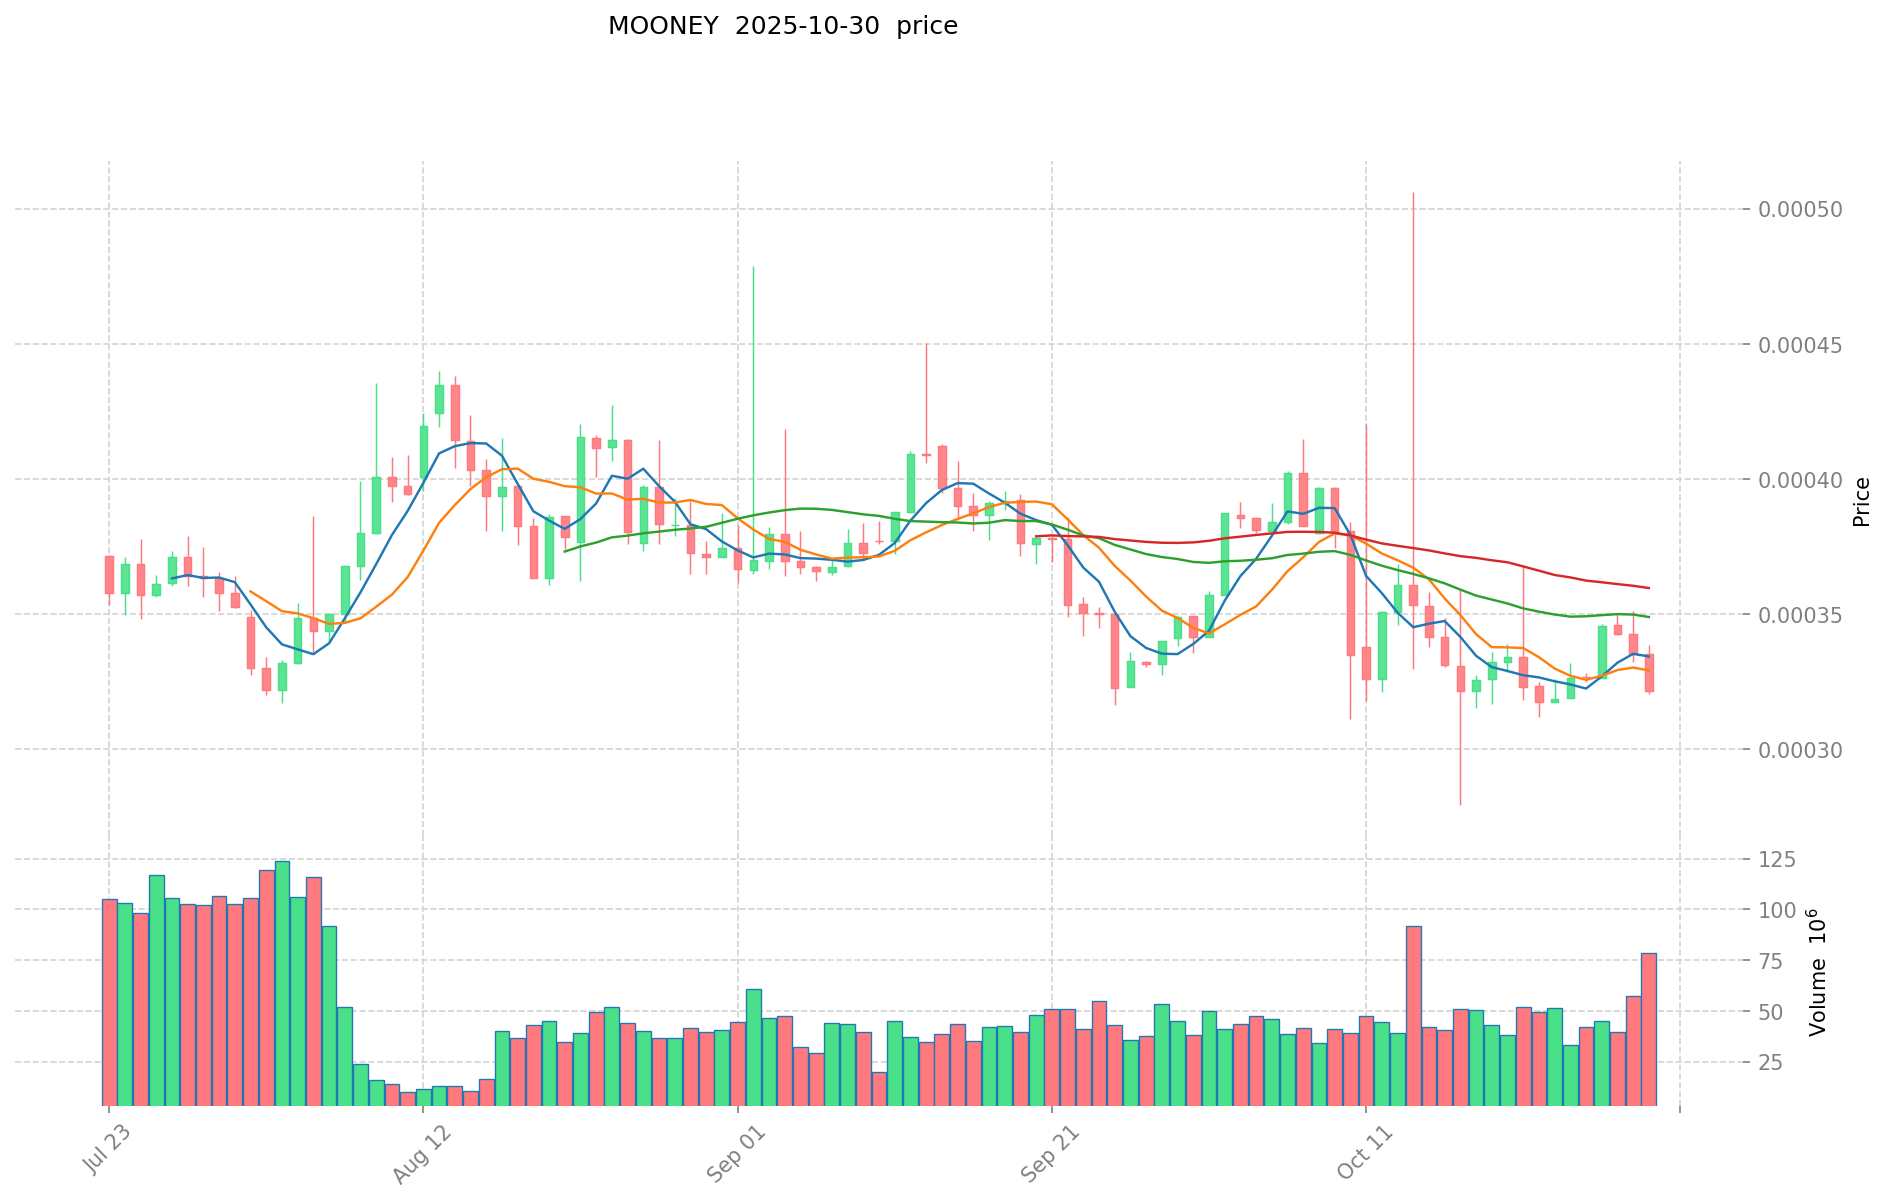
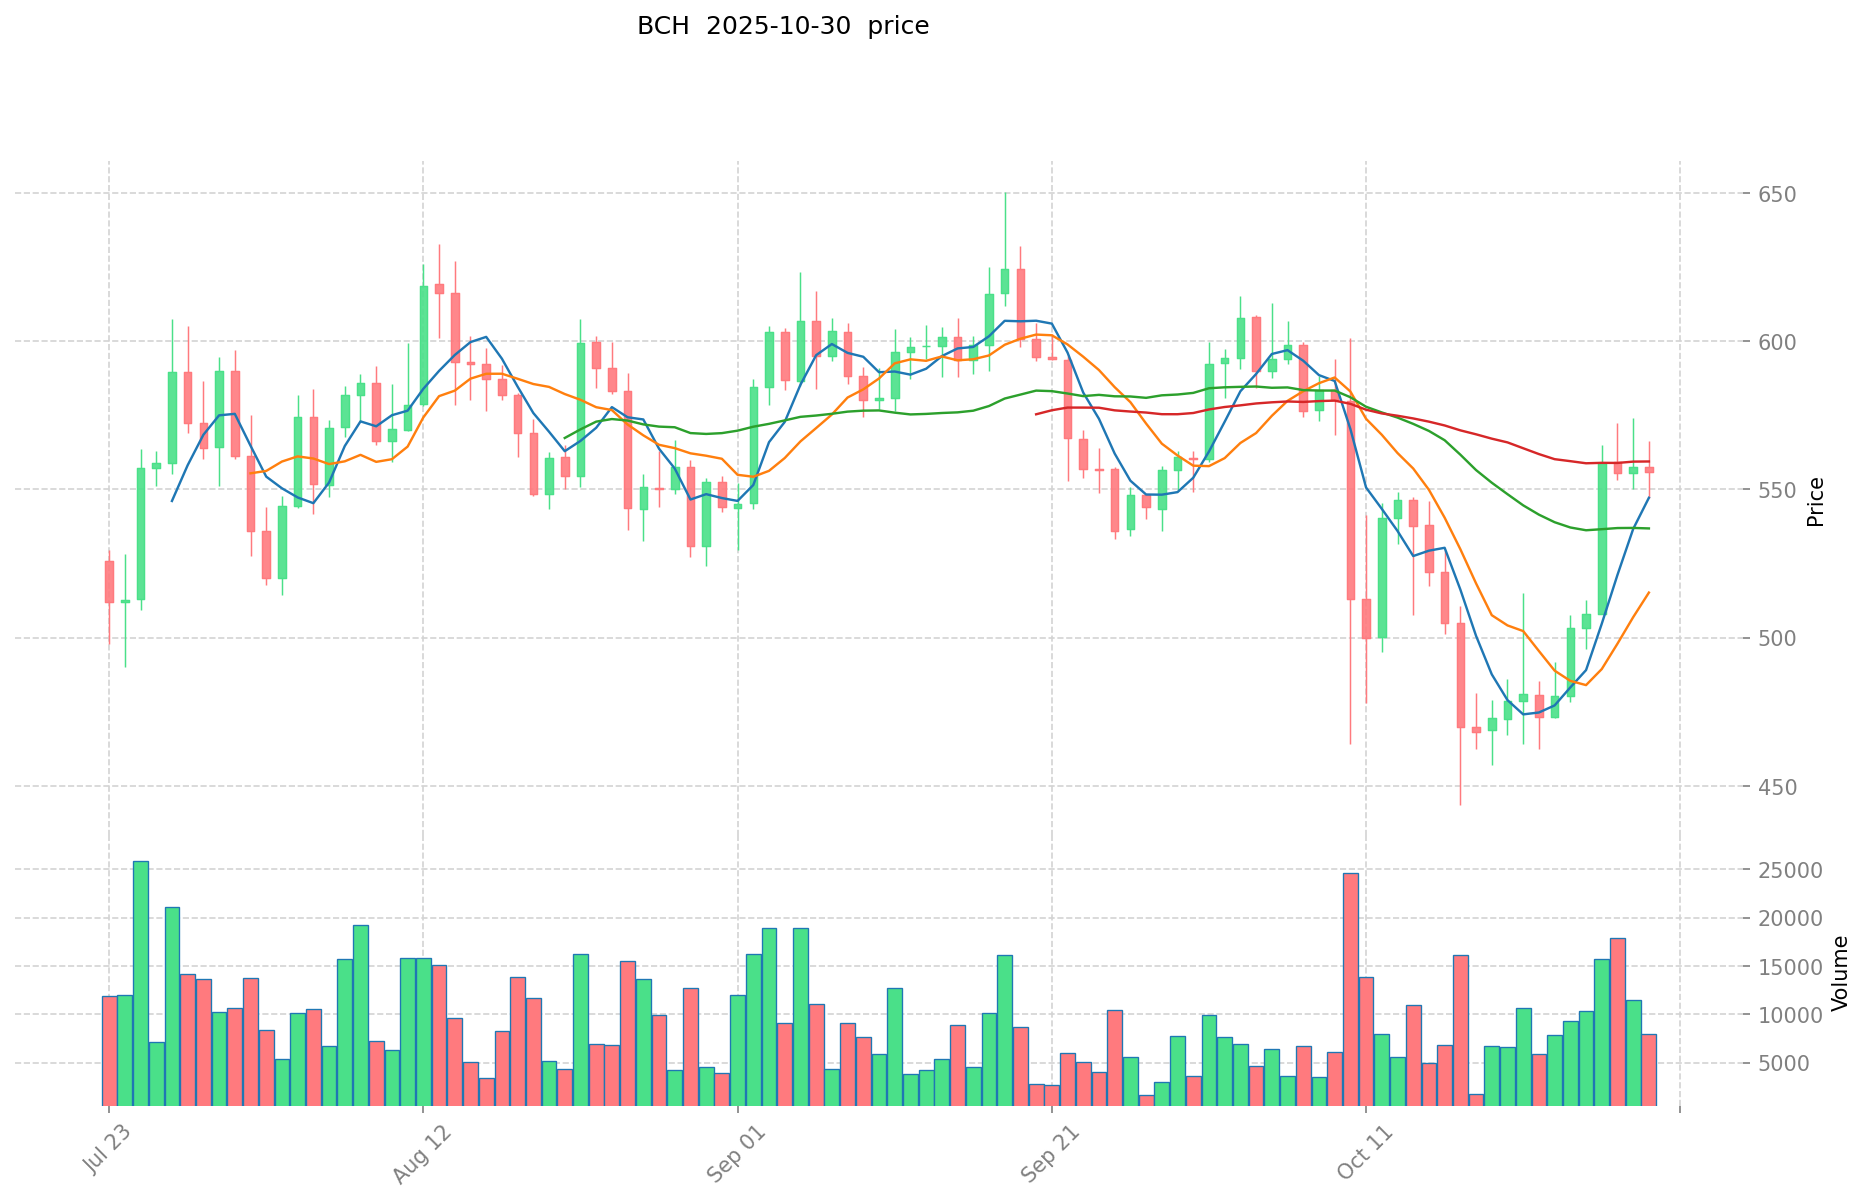
Current Market Situation (2025-10-30)
- MOONEY current price: $0.0003231
- BCH current price: $562.8
- 24-hour trading volume: $19,069.29 (MOONEY) vs $5,873,668.41 (BCH)
- Market Sentiment Index (Fear & Greed Index): 34 (Fear)
Click to view real-time prices:
- Check MOONEY current price Market Price
- Check BCH current price Market Price
Investment Value Analysis: MOONEY vs BCH Core Factors
Supply Mechanism Comparison (Tokenomics)
- MOONEY: Governance token with no profit expectations
- BCH: Follows Bitcoin's model with supply mechanisms and network upgrades
- 📌 Historical pattern: Limited information available about how supply mechanisms drive price cycles for either token.
Institutional Adoption and Market Applications
- Institutional holdings: Insufficient data about institutional preference between these assets
- Enterprise adoption: BCH shows some development in technology innovation with network upgrades including "smart contracts" implementation in 2021
- Regulatory attitudes: Limited information available about regulatory positions on these specific assets
Technical Development and Ecosystem Building
- MOONEY technical profile: Functions primarily as a governance token for 2023MOON project, which aims to establish a self-sustaining settlement on the moon by 2030
- BCH technical development: Active development team pushing technological innovation through continuous network upgrades
- Ecosystem comparison: BCH implemented smart contract capabilities in 2021, but comprehensive ecosystem comparison data is limited
Macroeconomic Factors and Market Cycles
- Inflation resistance properties: Insufficient specific data on comparative performance during inflation
- Monetary policy impacts: No specific information available about how monetary policies affect these assets differently
- Geopolitical factors: No specific information available regarding cross-border transaction demands
III. 2025-2030 Price Prediction: MOONEY vs BCH
Short-term Prediction (2025)
- MOONEY: Conservative $0.000255249 - $0.0003231 | Optimistic $0.0003231 - $0.000423261
- BCH: Conservative $354.0096 - $561.92 | Optimistic $561.92 - $769.8304
Mid-term Prediction (2027)
- MOONEY may enter a growth phase, with an estimated price range of $0.0002093542605 - $0.000456772932
- BCH may enter a steady growth phase, with an estimated price range of $566.12709504 - $805.64240448
- Key drivers: Institutional capital inflow, ETF, ecosystem development
Long-term Prediction (2030)
- MOONEY: Base scenario $0.000356170216303 - $0.000636018243399 | Optimistic scenario $0.000636018243399 - $0.000795022804248
- BCH: Base scenario $805.83789252074112 - $1167.881003653248 | Optimistic scenario $1167.881003653248 - $1413.13601442043008
Disclaimer: This prediction is for informational purposes only and should not be considered as financial advice. Cryptocurrency markets are highly volatile and unpredictable. Always conduct your own research before making any investment decisions.
MOONEY:
| 年份 | 预测最高价 | 预测平均价格 | 预测最低价 | 涨跌幅 |
|---|---|---|---|---|
| 2025 | 0.000423261 | 0.0003231 | 0.000255249 | 0 |
| 2026 | 0.00038810772 | 0.0003731805 | 0.00027615357 | 15 |
| 2027 | 0.000456772932 | 0.00038064411 | 0.0002093542605 | 17 |
| 2028 | 0.00061968861108 | 0.000418708521 | 0.00023866385697 | 29 |
| 2029 | 0.000752837920758 | 0.00051919856604 | 0.000368630981888 | 60 |
| 2030 | 0.000795022804248 | 0.000636018243399 | 0.000356170216303 | 96 |
BCH:
| 年份 | 预测最高价 | 预测平均价格 | 预测最低价 | 涨跌幅 |
|---|---|---|---|---|
| 2025 | 769.8304 | 561.92 | 354.0096 | 0 |
| 2026 | 785.732736 | 665.8752 | 472.771392 | 18 |
| 2027 | 805.64240448 | 725.803968 | 566.12709504 | 28 |
| 2028 | 1133.2703156352 | 765.72318624 | 650.864708304 | 36 |
| 2029 | 1386.265256368896 | 949.4967509376 | 807.07223829696 | 68 |
| 2030 | 1413.13601442043008 | 1167.881003653248 | 805.83789252074112 | 107 |
IV. Investment Strategy Comparison: MOONEY vs BCH
Long-term vs Short-term Investment Strategy
- MOONEY: Suitable for investors focused on space exploration and governance potential
- BCH: Suitable for investors seeking established networks and payment applications
Risk Management and Asset Allocation
- Conservative investors: MOONEY: 10% vs BCH: 90%
- Aggressive investors: MOONEY: 30% vs BCH: 70%
- Hedging tools: Stablecoin allocation, options, cross-currency portfolios
V. Potential Risk Comparison
Market Risk
- MOONEY: High volatility due to lower market cap and trading volume
- BCH: Susceptible to overall crypto market trends and Bitcoin price movements
Technical Risk
- MOONEY: Scalability, network stability
- BCH: Mining centralization, security vulnerabilities
Regulatory Risk
- Global regulatory policies may have differing impacts on both assets
VI. Conclusion: Which Is the Better Buy?
📌 Investment Value Summary:
- MOONEY advantages: Unique focus on space exploration, potential for growth in niche market
- BCH advantages: Established network, wider adoption, smart contract capabilities
✅ Investment Advice:
- Novice investors: Consider a small allocation to MOONEY for diversification, larger allocation to BCH for stability
- Experienced investors: Balanced approach with higher risk tolerance for MOONEY
- Institutional investors: Focus on BCH for liquidity and established market presence
⚠️ Risk Warning: Cryptocurrency markets are highly volatile. This article does not constitute investment advice. None
VII. FAQ
Q1: What are the main differences between MOONEY and BCH? A: MOONEY is a governance token focused on space exploration, launched in 2022. BCH is a peer-to-peer electronic cash system created in 2017 through a Bitcoin hard fork. BCH has a larger market cap, higher trading volume, and more established network compared to MOONEY.
Q2: Which cryptocurrency has shown better price performance historically? A: BCH has a longer price history and has shown significant volatility since its creation in 2017, reaching an all-time high of $3,785.82. MOONEY, being newer, has less historical data but experienced price fluctuations typical of new cryptocurrencies since its launch in 2022.
Q3: How do the supply mechanisms differ between MOONEY and BCH? A: MOONEY functions as a governance token with no profit expectations. BCH follows Bitcoin's model with supply mechanisms and undergoes network upgrades. However, limited information is available about how these supply mechanisms specifically drive price cycles for either token.
Q4: What are the key factors driving the future price predictions for MOONEY and BCH? A: Key drivers for both cryptocurrencies include institutional capital inflow, potential ETF approvals, and ecosystem development. The space exploration focus of MOONEY and the established network of BCH also play roles in their respective price predictions.
Q5: How should investors approach allocating their portfolios between MOONEY and BCH? A: Conservative investors might consider allocating 10% to MOONEY and 90% to BCH. More aggressive investors could opt for a 30% MOONEY and 70% BCH split. The exact allocation should be based on individual risk tolerance and investment goals.
Q6: What are the main risks associated with investing in MOONEY and BCH? A: MOONEY faces high volatility due to its lower market cap and trading volume, as well as potential scalability and network stability issues. BCH is susceptible to overall crypto market trends, Bitcoin price movements, and risks related to mining centralization and security vulnerabilities. Both are subject to regulatory risks.
Q7: Which cryptocurrency might be more suitable for different types of investors? A: Novice investors might consider a small allocation to MOONEY for diversification and a larger allocation to BCH for stability. Experienced investors could take a balanced approach with a higher risk tolerance for MOONEY. Institutional investors might focus on BCH due to its liquidity and established market presence.
Share
Content
Introduction: MOONEY vs BCH Investment Comparison
I. Price History Comparison and Current Market Status
Investment Value Analysis: MOONEY vs BCH Core Factors
III. 2025-2030 Price Prediction: MOONEY vs BCH
IV. Investment Strategy Comparison: MOONEY vs BCH
V. Potential Risk Comparison
VI. Conclusion: Which Is the Better Buy?
VII. FAQ

