GLQ ve ARB: Kuantum Hesaplama Algoritmaları ile Klasik Bit Tabanlı Yaklaşımların Karşılaştırmalı Analizi


Giriş: GLQ ve ARB Yatırımı Karşılaştırması
Kripto para piyasasında, GraphLinq Protocol (GLQ) ile Arbitrum (ARB) arasındaki karşılaştırma, yatırımcıların ilgisini daima çeken bir başlık olmuştur. Bu iki kripto varlık, piyasa değeri sıralaması, kullanım alanları ve fiyat performanslarındaki belirgin farkların yanı sıra, kripto piyasasında farklı konumlandırmaları da temsil etmektedir.
GraphLinq Protocol (GLQ): 2021’de piyasaya sürülen GLQ, merkeziyetsiz DeFi veri izleme ve çoklu zincir uygulamaları üzerinden otomasyon ve dışsal yürütme olanaklarıyla piyasa tarafından tanınmıştır.
Arbitrum (ARB): 2023’te tanıtılan ARB, Ethereum için bir ölçeklendirme çözümü olarak büyük övgüyle karşılanmış; yüksek işlem hacmine sahip, düşük maliyetli akıllı kontratlar sunarken, merkeziyetsiz güvenliği de korumuştur.
Bu makalede, GLQ ve ARB’nin yatırım değerlerini kapsamlı biçimde analiz edecek; tarihsel fiyat hareketleri, arz mekanizmaları, kurumsal benimseme, teknolojik ekosistemler ve gelecek öngörüleri üzerinden karşılaştırmalı bir değerlendirme sunarak yatırımcıların en çok merak ettiği soruya yanıt arayacağız:
"Şu anda hangisi daha kârlı bir yatırım?"
I. Fiyat Geçmişi Karşılaştırması ve Güncel Piyasa Durumu
GLQ ve ARB Tarihsel Fiyat Eğilimleri
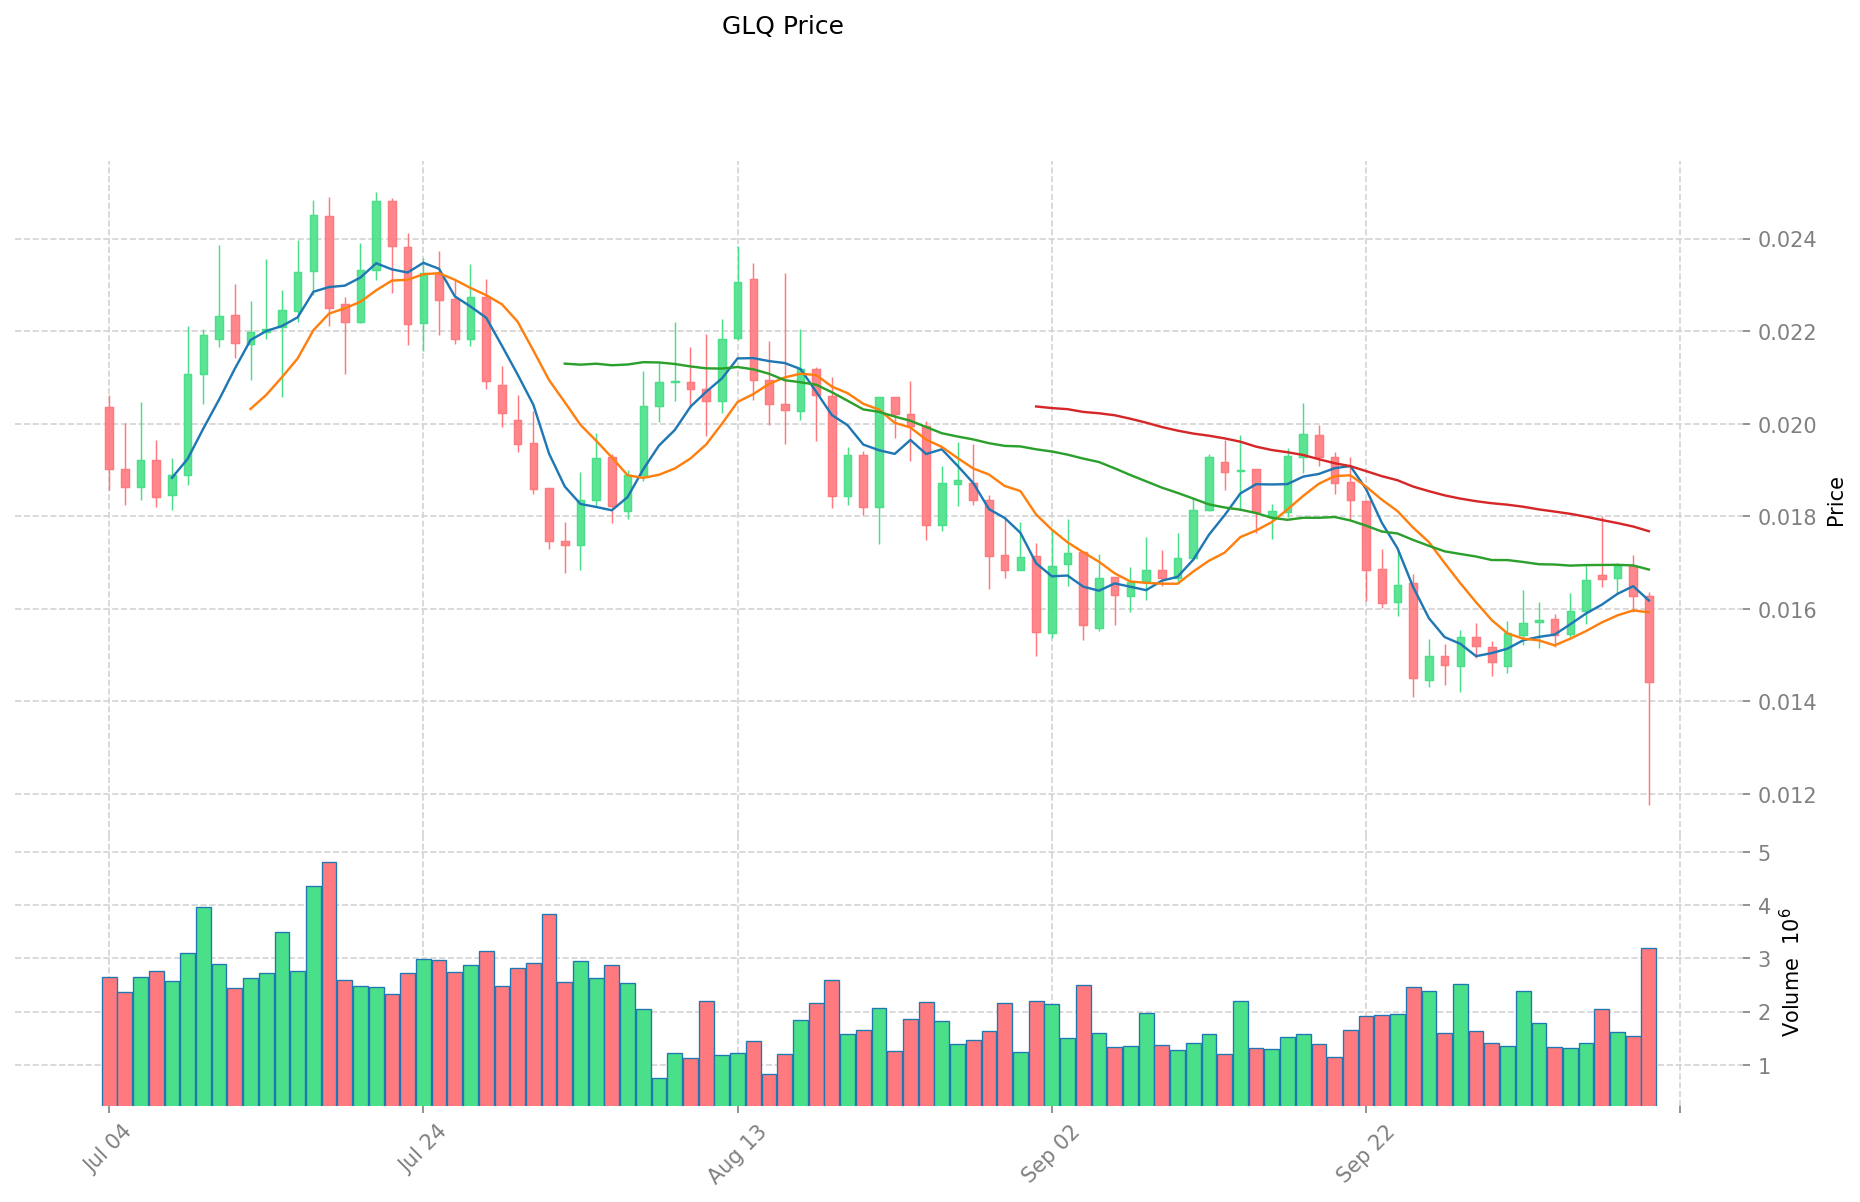
- 2024: GLQ, protokolün benimsenmesindeki artış sayesinde 18 Mart 2024’te $0,19361 ile tüm zamanların en yüksek seviyesine ulaştı.
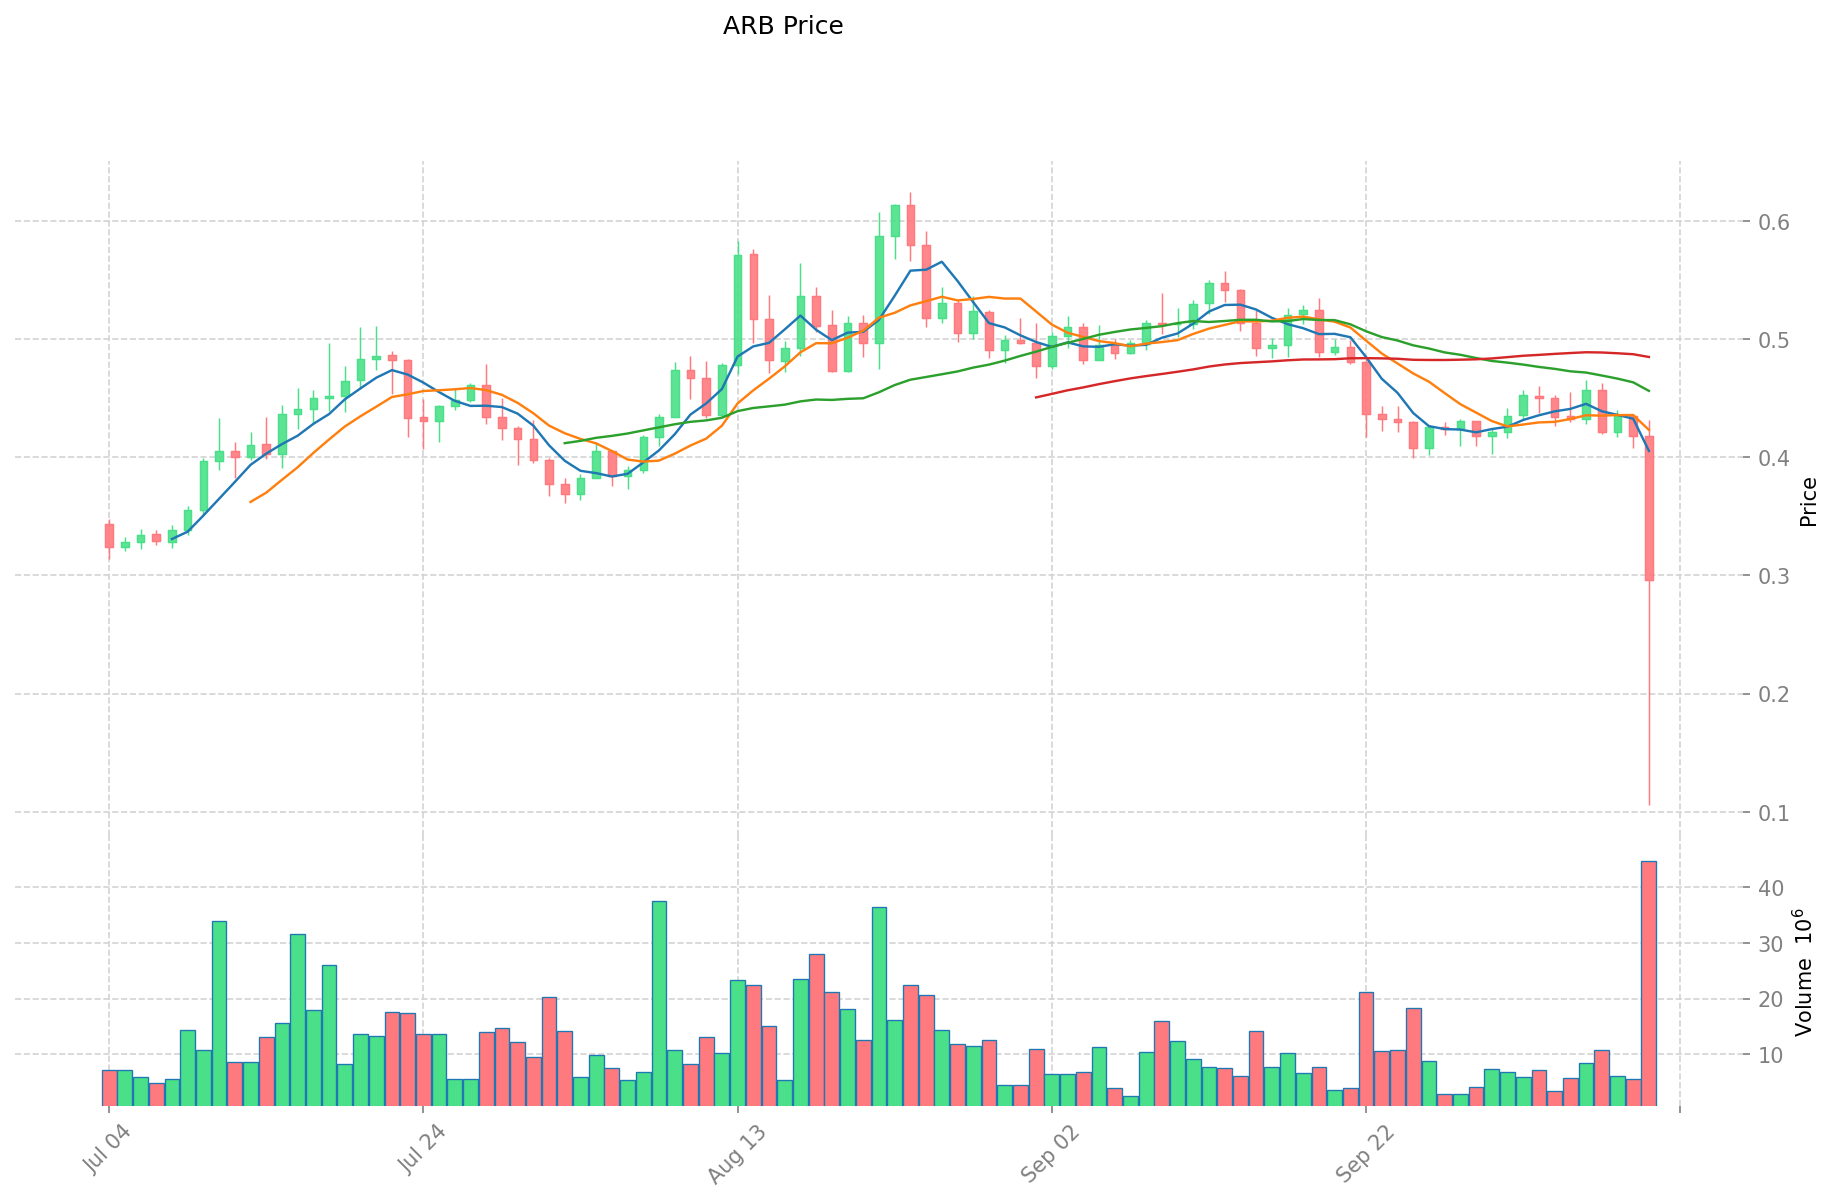
- 2023: ARB, 23 Mart 2023’te $1,18 başlangıç fiyatıyla piyasaya çıktı ve aynı gün $4,00 ile zirve yaptı.
- Karşılaştırmalı analiz: Son piyasa döngüsünde GLQ, en yüksek $0,19361 değerinden $0,01431 tabanına gerilerken; ARB, $4,00 zirvesinden $0,2969 seviyesine düştü.
Güncel Piyasa Durumu (11 Ekim 2025)
- GLQ güncel fiyat: $0,01431
- ARB güncel fiyat: $0,2969
- 24 saatlik işlem hacmi: GLQ $49.738,59 | ARB $15.389.262,77
- Piyasa Duyarlılık Endeksi (Korku & Açgözlülük Endeksi): 27 (Korku)
Gerçek zamanlı fiyatlar için tıklayın:
- GLQ güncel fiyatı için Piyasa Fiyatı
- ARB güncel fiyatı için Piyasa Fiyatı
II. GLQ ve ARB Yatırım Değerini Etkileyen Temel Faktörler
Arz Mekanizması Karşılaştırması (Tokenomik)
Kurumsal Benimseme ve Piyasa Uygulamaları
Teknik Gelişim ve Ekosistem Oluşturma
- Solareum Teknik Yükseltmesi: Q4’te çoklu invertörlerin piyasaya çıkması planlanıyor; bu geliştirme, çeşitli enerji kaynaklarıyla bağlantı kurmayı kolaylaştıracak.
Makroekonomik Etkenler ve Piyasa Döngüleri
III. 2025-2030 Fiyat Tahminleri: GLQ ve ARB
Kısa Vadeli Tahmin (2025)
- GLQ: İhtiyatlı $0,0130-$0,0143 | İyimser $0,0143-$0,0199
- ARB: İhtiyatlı $0,2697-$0,3030 | İyimser $0,3030-$0,3757
Orta Vadeli Tahmin (2027)
- GLQ, büyüme evresine girebilir; fiyat tahmini $0,0148-$0,0268
- ARB, konsolidasyon evresinde olabilir; fiyat tahmini $0,2693-$0,4527
- Temel etkenler: Kurumsal sermaye girişi, ETF’ler, ekosistem geliştirme
Uzun Vadeli Tahmin (2030)
- GLQ: Temel senaryo $0,0220-$0,0314 | İyimser senaryo $0,0314-$0,0430
- ARB: Temel senaryo $0,4889-$0,5257 | İyimser senaryo $0,5257-$0,6098
Yasal Uyarı: Yukarıdaki tahminler, tarihsel veriler ve piyasa analizlerine dayanmaktadır. Kripto para piyasaları yüksek oranda dalgalanır ve ani değişikliklere açıktır. Bu öngörüler yatırım tavsiyesi değildir. Yatırım kararı öncesinde mutlaka kendi araştırmanızı yapınız.
GLQ:
| Yıl | Tahmini En Yüksek Fiyat | Tahmini Ortalama Fiyat | Tahmini En Düşük Fiyat | Değişim Oranı (%) |
|---|---|---|---|---|
| 2025 | 0,0199326 | 0,01434 | 0,0130494 | 0 |
| 2026 | 0,021420375 | 0,0171363 | 0,01370904 | 19 |
| 2027 | 0,026796889125 | 0,0192783375 | 0,014844319875 | 34 |
| 2028 | 0,0304096495725 | 0,0230376133125 | 0,02073385198125 | 60 |
| 2029 | 0,036076902447375 | 0,0267236314425 | 0,020042723581875 | 86 |
| 2030 | 0,043018365714564 | 0,031400266944937 | 0,021980186861456 | 119 |
ARB:
| Yıl | Tahmini En Yüksek Fiyat | Tahmini Ortalama Fiyat | Tahmini En Düşük Fiyat | Değişim Oranı (%) |
|---|---|---|---|---|
| 2025 | 0,37572 | 0,303 | 0,26967 | 2 |
| 2026 | 0,441168 | 0,33936 | 0,2748816 | 14 |
| 2027 | 0,45270624 | 0,390264 | 0,26928216 | 31 |
| 2028 | 0,4509890784 | 0,42148512 | 0,252891072 | 41 |
| 2029 | 0,615094309872 | 0,4362370992 | 0,231205662576 | 46 |
| 2030 | 0,60977221726176 | 0,525665704536 | 0,48886910521848 | 77 |
IV. Yatırım Stratejisi Karşılaştırması: GLQ ve ARB
Uzun Vadeli ve Kısa Vadeli Yatırım Stratejileri
- GLQ: DeFi otomasyonu ve çoklu zincir uygulamalarına odaklanan yatırımcılar için uygun
- ARB: Ethereum ölçeklendirme çözümleri ve akıllı kontrat platformlarına ilgi duyanlar için uygun
Risk Yönetimi ve Varlık Dağılımı
- Temkinli yatırımcı: GLQ %20 | ARB %80
- Aggresif yatırımcı: GLQ %40 | ARB %60
- Koruma araçları: Stablecoin tahsisi, opsiyonlar, çapraz döviz portföyleri
V. Potansiyel Risk Karşılaştırması
Piyasa Riski
- GLQ: Daha düşük piyasa değeri ve işlem hacmi nedeniyle volatilitesi yüksek
- ARB: Ethereum ekosistemi risklerine ve diğer Layer 2 çözümlerinin rekabetine açık
Teknik Risk
- GLQ: Ölçeklenebilirlik ve ağ istikrarı
- ARB: Merkezileşme endişeleri ve Layer 2 teknolojisinde potansiyel güvenlik açıkları
Regülasyon Riski
- Küresel regülasyon politikaları, iki token üzerinde farklı etkiler yaratabilir; ARB, Ethereum ekosistemindeki rolü nedeniyle daha fazla incelemeye tabi olabilir
VI. Sonuç: Hangisi Daha İyi Bir Alım?
📌 Yatırım Değeri Özeti:
- GLQ avantajları: DeFi otomasyonunda niş pazar, çoklu zincir uygulamalarında büyüme potansiyeli
- ARB avantajları: Ethereum ölçeklendirme çözümü olarak güçlü destek, yüksek likidite ve kurumsal ilgi
✅ Yatırım Tavsiyesi:
- Yeni başlayan yatırımcılar: ARB’yi çeşitlendirilmiş bir kripto portföyünde küçük bir oran olarak değerlendirebilir
- Deneyimli yatırımcılar: GLQ ve ARB’yi dengeli şekilde portföylerine dahil edebilir, risk toleransına göre oranlarını ayarlayabilir
- Kurumsal yatırımcılar: ARB’ye, likiditesi ve Ethereum’un ölçeklendirme sürecindeki rolü nedeniyle odaklanabilir
⚠️ Risk Uyarısı: Kripto para piyasası yüksek volatiliteye sahiptir; bu makale yatırım tavsiyesi değildir. None
VII. Sıkça Sorulan Sorular
S1: GLQ ve ARB arasındaki temel farklar nelerdir? C: GLQ, DeFi otomasyonu ve çoklu zincir uygulamalarına odaklanırken; ARB, Ethereum ölçeklendirme çözümüdür. GLQ’nun piyasa değeri ve işlem hacmi daha düşük, ARB’de ise likidite ve kurumsal ilgi daha yüksektir.
S2: Tarihsel olarak hangi token daha iyi fiyat performansı gösterdi? C: ARB, tarihsel olarak daha iyi fiyat performansı sergilemiştir. Mart 2023’te piyasaya çıkış gününde $4,00 ile rekor kırarken, GLQ’nun en yüksek seviyesi Mart 2024’te $0,19361 olmuştur.
S3: 2030 yılı fiyat tahminlerinde GLQ ve ARB nasıl karşılaştırılıyor? C: 2030 için GLQ’nun temel senaryosu $0,0220-$0,0314, iyimser senaryosu $0,0314-$0,0430 aralığındadır. ARB’nin temel senaryosu $0,4889-$0,5257, iyimser senaryosu ise $0,5257-$0,6098’dir.
S4: GLQ ve ARB yatırımlarında öne çıkan başlıca riskler nedir? C: GLQ, düşük piyasa değeri ve olası ölçeklenebilirlik sorunları nedeniyle daha yüksek volatiliteye sahipken; ARB, Ethereum ekosistemi riskleri, Layer 2 rekabeti ve merkezileşme endişeleriyle karşı karşıyadır.
S5: Farklı yatırımcı profilleri GLQ ve ARB’ye nasıl yaklaşmalı? C: Yeni başlayan yatırımcılar ARB’ye küçük bir portföy oranı ayırabilir. Deneyimli yatırımcılar, iki tokeni dengeli şekilde portföylerinde bulundurabilir. Kurumsal yatırımcılar ise yüksek likidite ve Ethereum ölçeklendirme rolü nedeniyle ARB’ye odaklanabilir.
S6: GLQ ve ARB’nin gelecekteki büyümesini hangi faktörler destekleyebilir? C: GLQ’nun büyümesi, DeFi otomasyonu ve çoklu zincir uygulamalarının yaygınlaşmasıyla mümkün olabilir. ARB’de ise büyüme potansiyeli, Ethereum ölçeklendirme başarısı ve Layer 2 çözümlerinin benimsenmesine bağlıdır.
S7: GLQ ve ARB’nin arz mekanizmaları (tokenomik) nasıl karşılaştırılır? C: Detaylar verilmemekle birlikte, tokenomik; toplam arz, dolaşımdaki arz, enflasyon oranı ve token dağıtımı gibi unsurları içerir. Bu faktörler, her iki tokenin uzun vadeli değeri ve istikrarı üzerinde belirleyici olabilir.
Share
Content
Giriş: GLQ ve ARB Yatırımı Karşılaştırması
I. Fiyat Geçmişi Karşılaştırması ve Güncel Piyasa Durumu
II. GLQ ve ARB Yatırım Değerini Etkileyen Temel Faktörler
III. 2025-2030 Fiyat Tahminleri: GLQ ve ARB
IV. Yatırım Stratejisi Karşılaştırması: GLQ ve ARB
V. Potansiyel Risk Karşılaştırması
VI. Sonuç: Hangisi Daha İyi Bir Alım?
VII. Sıkça Sorulan Sorular
How to Buy Cryptocurrency


Trending Cryptocurrencies


EtherVista (VISTA) iyi bir yatırım mı?: Bu yükselen kripto paranın potansiyelini ve risklerini değerlendirmek

Optimism (OP) iyi bir yatırım mı?: Ethereum Layer 2 ölçeklendirme çözümünün potansiyeli ve riskleri üzerine analiz

ARB vs NEAR: İki Yükselen Blockchain Ekosisteminin Karşılaştırmalı Analizi

VISTA ve ARB: Diyabetik Hastalarda Hipertansiyon Yönetiminde İki Yaklaşımın Karşılaştırılması

Eclipse (ES) yatırım için uygun mu?: Bu Yeni Dijital Varlığın Risk ve Getiri Profili üzerine Analiz
ALCX ve OP: Kripto dünyasını yeniden şekillendiren iki DeFi protokolünün kapsamlı analizi

Dropee Günlük Kombinasyonu 11 Aralık 2025
Tomarket Günlük Kombinasyonu 11 Aralık 2025

Merkeziyetsiz Finans'ta Geçici Kayıp Nedir?

Kripto Parada Çifte Harcama: Önleme Stratejileri

Kripto Ticaretinde Wyckoff Yönteminin Anlaşılması