ARB vs NEAR: İki Yükselen Blockchain Ekosisteminin Karşılaştırmalı Analizi

Giriş: ARB ve NEAR Yatırımı Karşılaştırması
Kripto para piyasasında Arbitrum (ARB) ile Near (NEAR) arasındaki karşılaştırma, yatırımcıların sıklıkla gündeme getirdiği ve kaçınamadığı bir başlıktır. Her iki varlık, piyasa değeri sıralaması, uygulama alanları ve fiyat performansı gibi temel açılardan ayrışırken, kripto varlık ekosisteminde farklı konumlandırmaları ile dikkat çekmektedir.
Arbitrum (ARB): Lansmanından bu yana, yüksek işlem hacmi ve düşük maliyetli akıllı sözleşmeler sağlayan Ethereum ölçeklendirme çözümüyle piyasada önemli bir kabul görmüştür.
Near (NEAR): Kuruluşundan itibaren, mobil cihazlarda DApp çalıştırmak için yüksek ölçeklenebilirlik ve hızlı işlem kapasitesi sunan temel protokol olarak öne çıkmıştır.
Bu makalede, ARB ve NEAR’ın yatırım değerleri; geçmiş fiyat eğilimleri, arz mekanizmaları, kurumsal benimseme, teknik ekosistem ve gelecek projeksiyonları üzerinden kapsamlı biçimde karşılaştırılacak, yatırımcıların en çok merak ettiği şu soruya yanıt aranacaktır:
"Şu anda hangisi daha avantajlı bir alım?" İşte talep edilen İngilizce rapor, sağlanan şablona uygun şekilde:
I. Fiyat Geçmişi Karşılaştırması ve Güncel Piyasa Durumu
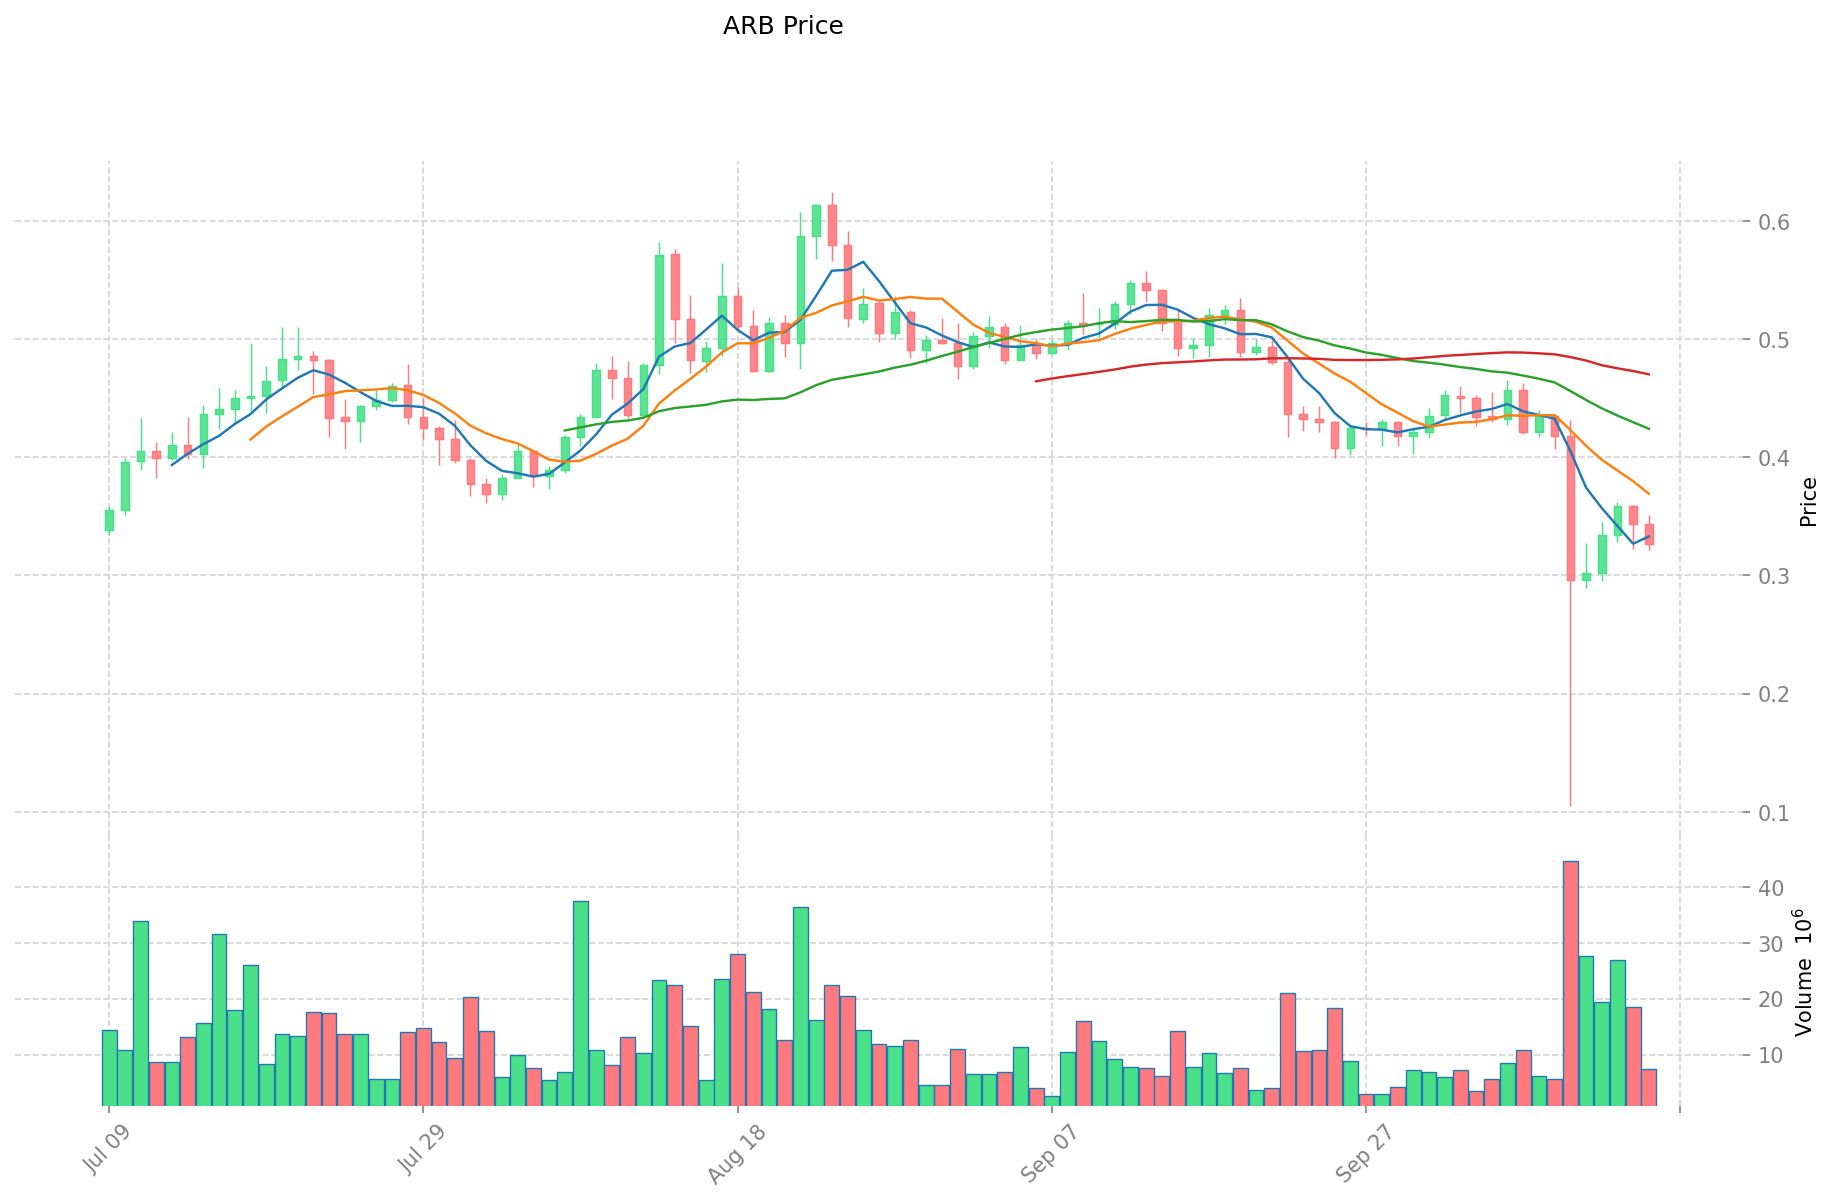
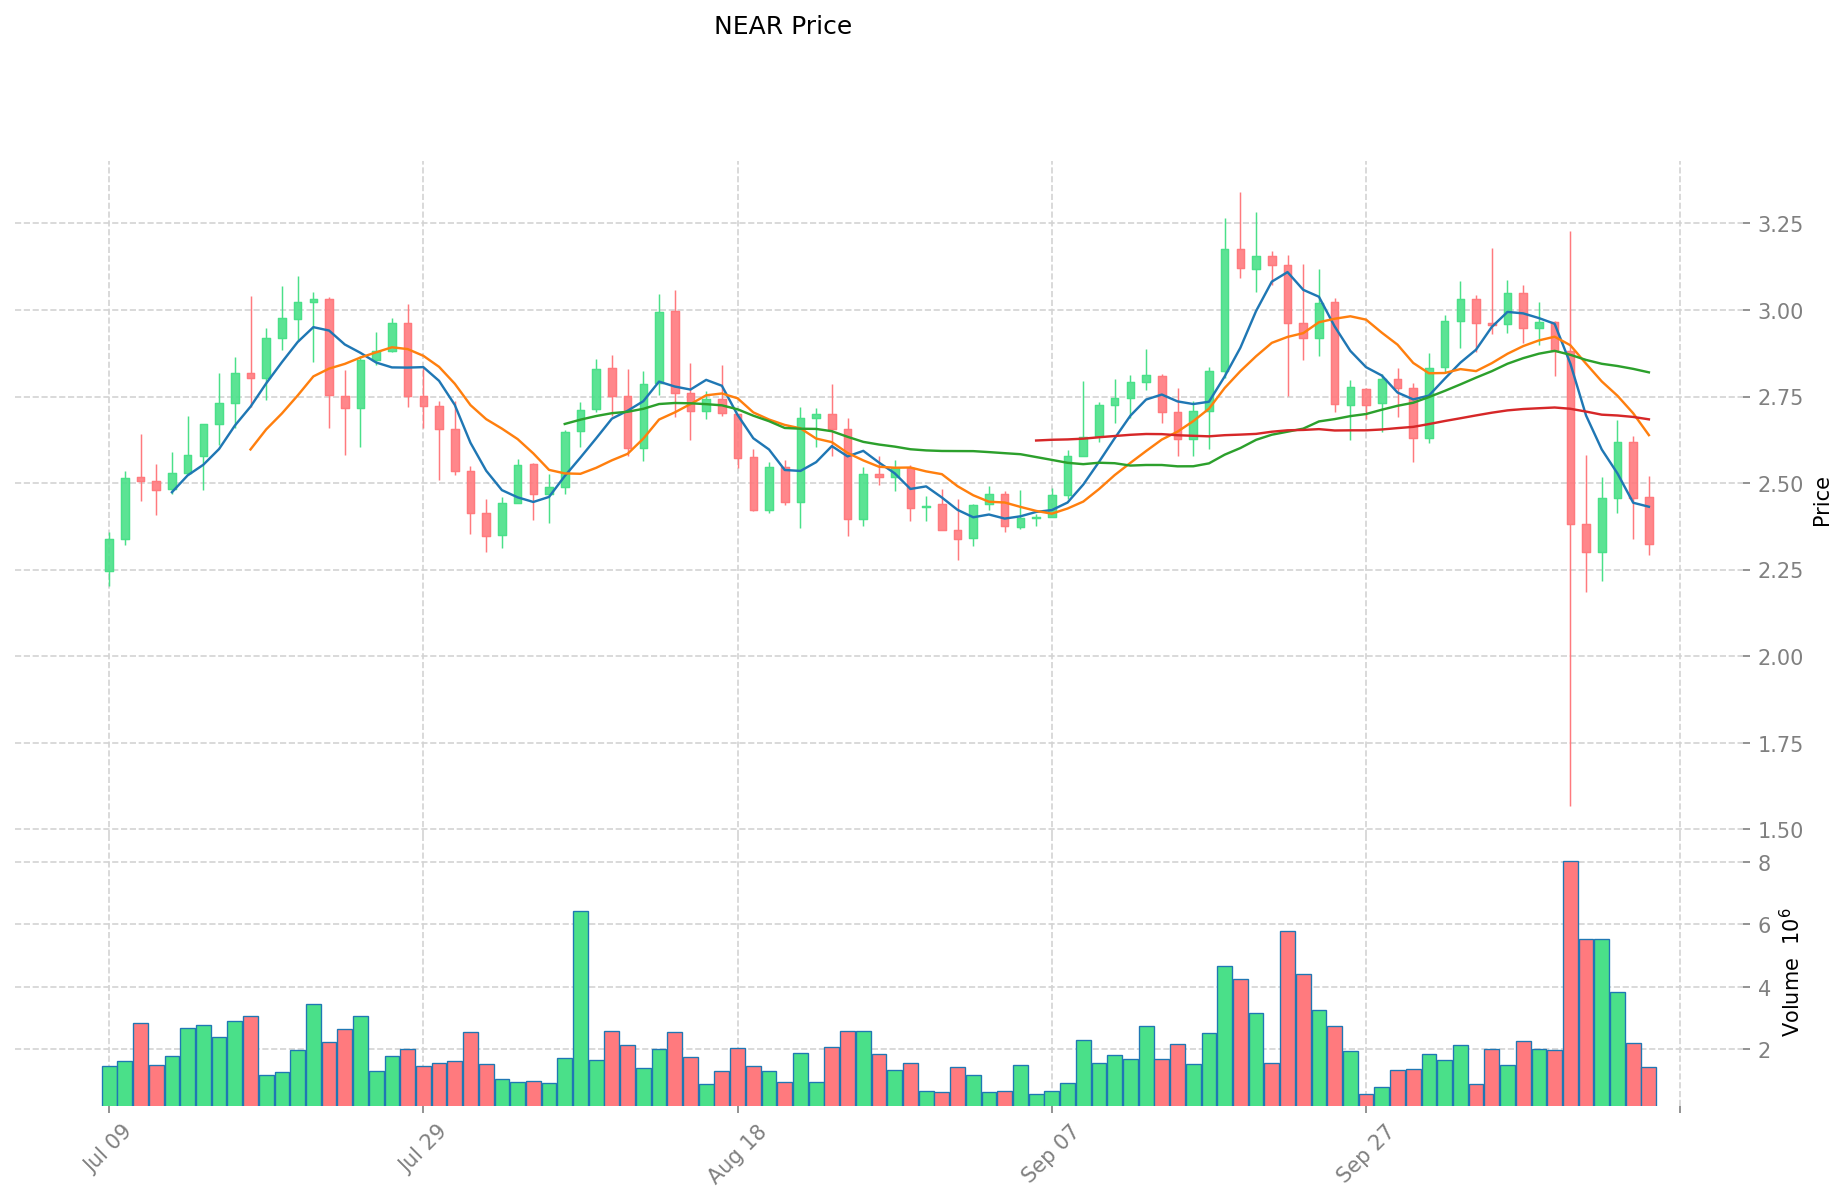
ARB ve NEAR Geçmiş Fiyat Eğilimleri
- 2023: ARB Mart ayında piyasaya sürüldü, $4,00 ile tüm zamanların en yüksek seviyesini gördü; sonrasında ciddi bir değer kaybı yaşadı.
- 2022: NEAR, Ocak ayında $20,44 ile zirve yaptı, ardından ayı piyasasında keskin düşüş yaşadı.
- Karşılaştırmalı analiz: Mevcut piyasa döngüsünde ARB $4,00 seviyesinden $0,1054 seviyesine inerken, NEAR $20,44’ten $0,526762’ye geriledi.
Güncel Piyasa Durumu (16 Ekim 2025)
- ARB güncel fiyat: $0,3269
- NEAR güncel fiyat: $2,326
- 24 saatlik işlem hacmi: $2.508.255 (ARB) ve $3.419.792 (NEAR)
- Piyasa Duyarlılık Endeksi (Korku & Açgözlülük Endeksi): 34 (Korku)
Anlık fiyatları görmek için tıklayın:
- ARB güncel fiyatı Piyasa Fiyatı
- NEAR güncel fiyatı Piyasa Fiyatı


II. ARB Yatırım Değerini Etkileyen Temel Unsurlar
Arz Mekanizması (Tokenomics)
- ARB: Arbitrum DAO hazinesi toplam arzın %42,78’ini (427.8 milyon token) elinde tutarak ekosistem gelişimi ve yönetişimde ciddi bir kontrol sağlıyor
- 📌 Tarihsel Model: ARB’nin token dağıtım modeli, kontrollü sürümler ve DAO kararlarıyla fiyat hareketlerini doğrudan etkiliyor
Kurumsal Benimseme & Piyasa Uygulamaları
- İşlem Hacmi Artışı: ARB, son 30 günde %600’lük işlem ücreti gelir artışı yakalayarak $2,42 milyon seviyesine ulaştı
- Piyasa Performansı: Uzun vadeli alçalan kanalın kırılmasıyla $0,47-$0,50 arasında kritik direnç noktalarına yaklaşmakta
- Ekosistem Gelişimi: 25 milyon ARB token yönetimiyle zincir üstü getiri sağlayan çeşitli teklifler büyümeyi destekliyor
Teknik Gelişim & Ekosistem Oluşumu
- Güçlü Güvenlik: Arbitrum’un mimarisinde, Ethereum ana katmanında gerçekleştirilen ve doğrulayıcıların işlem geçerliliğine itiraz edebildiği sağlam sahtekarlık önleme mekanizmaları bulunuyor
- Ekosistem Yapısı: Curve Finance ve Arbitrum DAO gibi çok katmanlı bir yapı, protokol güncellemeleri ve temel kararları yönetiyor
- Teknik Altyapı: Rollup teknolojisi, Ethereum ölçeklenmesini sağlarken çoklu doğrulama süreçleriyle güvenliği koruyor
Makroekonomik Faktörler & Piyasa Döngüleri
- Piyasa Oynaklığı: ARB, kripto piyasalarına özgü yüksek fiyat dalgalanmalarına maruz kalmakta; bu durum uzun vadeli yatırımcılar için hem fırsat hem de risk anlamı taşır
- Ekosistem Büyümesi: ARB’nin değeri, ekosistemindeki yeni uygulamaların ve projelerin kullanıcı ilgisini ve yatırımları artırmasıyla doğrudan ilişkili
- Ekonomik Rüzgarlar: Genel piyasa dinamikleri, ARB’nin fiyat hareketlerinde makroekonomik etkilerle belirleyici rol oynar
III. 2025-2030 Fiyat Öngörüleri: ARB vs NEAR
Kısa Vadeli Öngörü (2025)
- ARB: Muhafazakar $0,28 - $0,33 | İyimser $0,33 - $0,39
- NEAR: Muhafazakar $1,51 - $2,33 | İyimser $2,33 - $2,93
Orta Vadeli Öngörü (2027)
- ARB büyüme aşamasına geçebilir, tahmini fiyat aralığı $0,26 - $0,44
- NEAR konsolidasyon sürecine girebilir, tahmini fiyat aralığı $2,12 - $3,52
- Temel etmenler: Kurumsal sermaye girişi, ETF’ler ve ekosistem gelişimi
Uzun Vadeli Öngörü (2030)
- ARB: Temel senaryo $0,31 - $0,52 | İyimser senaryo $0,52 - $0,64
- NEAR: Temel senaryo $2,36 - $4,46 | İyimser senaryo $4,46 - $4,68
Feragatname
ARB:
| Yıl | Tahmini En Yüksek Fiyat | Tahmini Ortalama Fiyat | Tahmini En Düşük Fiyat | Değişim Oranı |
|---|---|---|---|---|
| 2025 | 0,39252 | 0,3271 | 0,284577 | 0 |
| 2026 | 0,4497625 | 0,35981 | 0,3310252 | 10 |
| 2027 | 0,4412170125 | 0,40478625 | 0,2550153375 | 23 |
| 2028 | 0,52452202275 | 0,42300163125 | 0,296101141875 | 29 |
| 2029 | 0,55903895586 | 0,473761827 | 0,36479660679 | 44 |
| 2030 | 0,6351724814589 | 0,51640039143 | 0,309840234858 | 58 |
NEAR:
| Yıl | Tahmini En Yüksek Fiyat | Tahmini Ortalama Fiyat | Tahmini En Düşük Fiyat | Değişim Oranı |
|---|---|---|---|---|
| 2025 | 2,93328 | 2,328 | 1,5132 | 0 |
| 2026 | 2,8673976 | 2,63064 | 2,104512 | 13 |
| 2027 | 3,518744064 | 2,7490188 | 2,116744476 | 18 |
| 2028 | 4,41877281912 | 3,133881432 | 1,81765123056 | 34 |
| 2029 | 5,1358048907616 | 3,77632712556 | 2,1902697328248 | 62 |
| 2030 | 4,67886930856884 | 4,4560660081608 | 2,361714984325224 | 91 |
IV. Yatırım Stratejisi Karşılaştırması: ARB vs NEAR
Uzun Vadeli ve Kısa Vadeli Yatırım Stratejileri
- ARB: Ethereum ölçeklenmesi ve ekosistem genişlemesine odaklanan yatırımcılar için uygundur
- NEAR: Yüksek ölçeklenebilir temel protokoller ve mobil DApp desteğine odaklanan yatırımcılar için uygundur
Risk Yönetimi ve Varlık Dağılımı
- Muhafazakar yatırımcılar: ARB %30 vs NEAR %70
- Agresif yatırımcılar: ARB %60 vs NEAR %40
- Koruma araçları: Stablecoin ayrımı, opsiyonlar, çapraz para portföyü
V. Potansiyel Risk Karşılaştırması
Piyasa Riski
- ARB: Yeni piyasaya çıkışı ve piyasa duyarlılığı nedeniyle yüksek oynaklık
- NEAR: Kripto piyasa trendlerine karşı hassasiyet
Teknik Risk
- ARB: Ölçeklenebilirlik sorunları, yoğun trafik sırasında ağ istikrarı
- NEAR: Güvenlik açıkları, merkeziyetsizlik endişeleri
Yasal Risk
- Küresel düzenleyici politikalar iki token üzerinde farklı etkiler yaratabilir
VI. Sonuç: Hangisi Daha Avantajlı?
📌 Yatırım Değeri Özeti:
- ARB avantajları: Güçlü Ethereum ölçeklendirme çözümü, gelişen ekosistem, yüksek büyüme potansiyeli
- NEAR avantajları: Yerleşik protokol, mobil DApp odaklı, daha yüksek mevcut piyasa değeri
✅ Yatırım Tavsiyesi:
- Yeni yatırımcılar: NEAR’ın yerleşik pozisyonu nedeniyle dengeli ve hafif NEAR ağırlıklı bir portföy önerilir
- Tecrübeli yatırımcılar: Potansiyel yüksek büyüme için ARB değerlendirmeli, NEAR pozisyonu korunmalı
- Kurumsal yatırımcılar: Portföy çeşitliliği için her iki token incelenmeli, ARB’nin ekosistem gelişimine odaklanılmalı
⚠️ Risk Uyarısı: Kripto para piyasası yüksek oynaklık içerir. Bu makale yatırım tavsiyesi değildir. None
VII. Sıkça Sorulan Sorular
S1: ARB ile NEAR arasındaki temel farklar nelerdir? C: ARB, yüksek işlem hacmi ve düşük maliyetli akıllı sözleşmelere odaklanan bir Ethereum ölçeklendirme çözümüdür; NEAR ise mobil cihazlarda hızlı DApp çalıştırmaya yönelik yüksek ölçeklenebilirliğe sahip bir temel protokoldür. ARB piyasada yenidir ve Ethereum ekosistemine bağlıdır; NEAR ise bağımsız bir blockchain platformu olarak daha uzun süredir aktiftir.
S2: Yakın dönemde hangi token daha iyi fiyat performansı gösterdi? C: 16 Ekim 2025 itibarıyla NEAR ($2,326) ARB’ye ($0,3269) kıyasla daha yüksek fiyatla işlem görmektedir. Ancak, son performans her token’ın tarihsel zirve ve piyasa trendleriyle birlikte değerlendirilmelidir.
S3: ARB’nin değerini artıran ana unsurlar nelerdir? C: ARB’nin değeri temelde Ethereum ölçeklenmesi, işlem hacmi artışı (30 günde %600 ücret geliri artışı), DAO teklifleriyle ekosistem gelişimi ve güçlü güvenlik altyapısı ile şekillenmektedir.
S4: ARB ve NEAR için uzun vadeli fiyat öngörüleri nasıl karşılaştırılır? C: 2030’da ARB’nin temel ve iyimser senaryolarda $0,31 - $0,64 seviyelerine ulaşması beklenirken, NEAR’ın $2,36 - $4,68 aralığında olması öngörülmektedir. Her iki token için de büyüme potansiyeli öne çıkarken, NEAR mutlak fiyat olarak daha yüksek konumunu koruyacaktır.
S5: ARB ve NEAR yatırımıyla ilgili başlıca riskler nelerdir? C: Her iki varlık da kripto piyasalarına özgü oynaklık riski taşır. ARB yeni olmasından ve Ethereum’a bağlılığından ek riskler barındırabilir; NEAR ise ölçeklenebilirlik ve merkeziyetsizlik aşamalarında zorluklarla karşılaşabilir.
S6: Yatırımcılar portföylerini ARB ve NEAR arasında nasıl dağıtmalı? C: Muhafazakar yatırımcılar portföylerinin %30’unu ARB’ye, %70’ini NEAR’a ayırabilir; agresif yatırımcılar %60 ARB, %40 NEAR tercih edebilir. Nihai dağılım, bireysel risk toleransı ve yatırım hedeflerine göre belirlenmelidir.
S7: Hangi token farklı yatırımcı profilleri için daha uygun? C: Yeni yatırımcılar NEAR’ın yerleşik konumu nedeniyle tercih edebilir. Tecrübeli yatırımcılar ARB’de potansiyel büyümeyi değerlendirebilir. Kurumsal yatırımcılar portföy çeşitliliği için her iki varlığı dikkate almalı; ARB’nin ekosistem gelişimine özel ilgi göstermelidir.

GLQ ve ARB: Kuantum Hesaplama Algoritmaları ile Klasik Bit Tabanlı Yaklaşımların Karşılaştırmalı Analizi

EtherVista (VISTA) iyi bir yatırım mı?: Bu yükselen kripto paranın potansiyelini ve risklerini değerlendirmek

Optimism (OP) iyi bir yatırım mı?: Ethereum Layer 2 ölçeklendirme çözümünün potansiyeli ve riskleri üzerine analiz

VISTA ve ARB: Diyabetik Hastalarda Hipertansiyon Yönetiminde İki Yaklaşımın Karşılaştırılması

Eclipse (ES) yatırım için uygun mu?: Bu Yeni Dijital Varlığın Risk ve Getiri Profili üzerine Analiz

ALCX ve OP: Kripto dünyasını yeniden şekillendiren iki DeFi protokolünün kapsamlı analizi

Ordinal NFT'leri İncelemek: İşleyişlerini ve Değerlerini Anlamak

Merkeziyetsiz borsalar için etkin API entegrasyonu

Kazancınızı Artırın: Sei Token Stake Ederek Pasif Gelir Elde Etme Rehberi

DeFi ekosisteminde Otomatik Piyasa Yapıcıların (Automated Market Makers) rolünü anlamak

Blockchain Düğümlerini Anlamak: Yeni Başlayanlar İçin Rehber


