FRAX vs ETC: Comparing Stability and Potential in the Crypto Market
Introduction: FRAX vs ETC Investment Comparison
In the cryptocurrency market, the comparison between FRAX and ETC has always been an unavoidable topic for investors. The two not only show significant differences in market cap ranking, application scenarios, and price performance but also represent different crypto asset positions.
FRAX (FRAX): Since its launch, it has gained market recognition for its role in decentralized finance and as a modular rollup blockchain.
Ethereum Classic (ETC): Launched in 2016, it has been hailed as the continuation of the original Ethereum blockchain, upholding the "code is law" principle.
This article will comprehensively analyze the investment value comparison between FRAX and ETC, focusing on historical price trends, supply mechanisms, institutional adoption, technological ecosystems, and future predictions, attempting to answer the question investors care about most:
"Which is the better buy right now?"
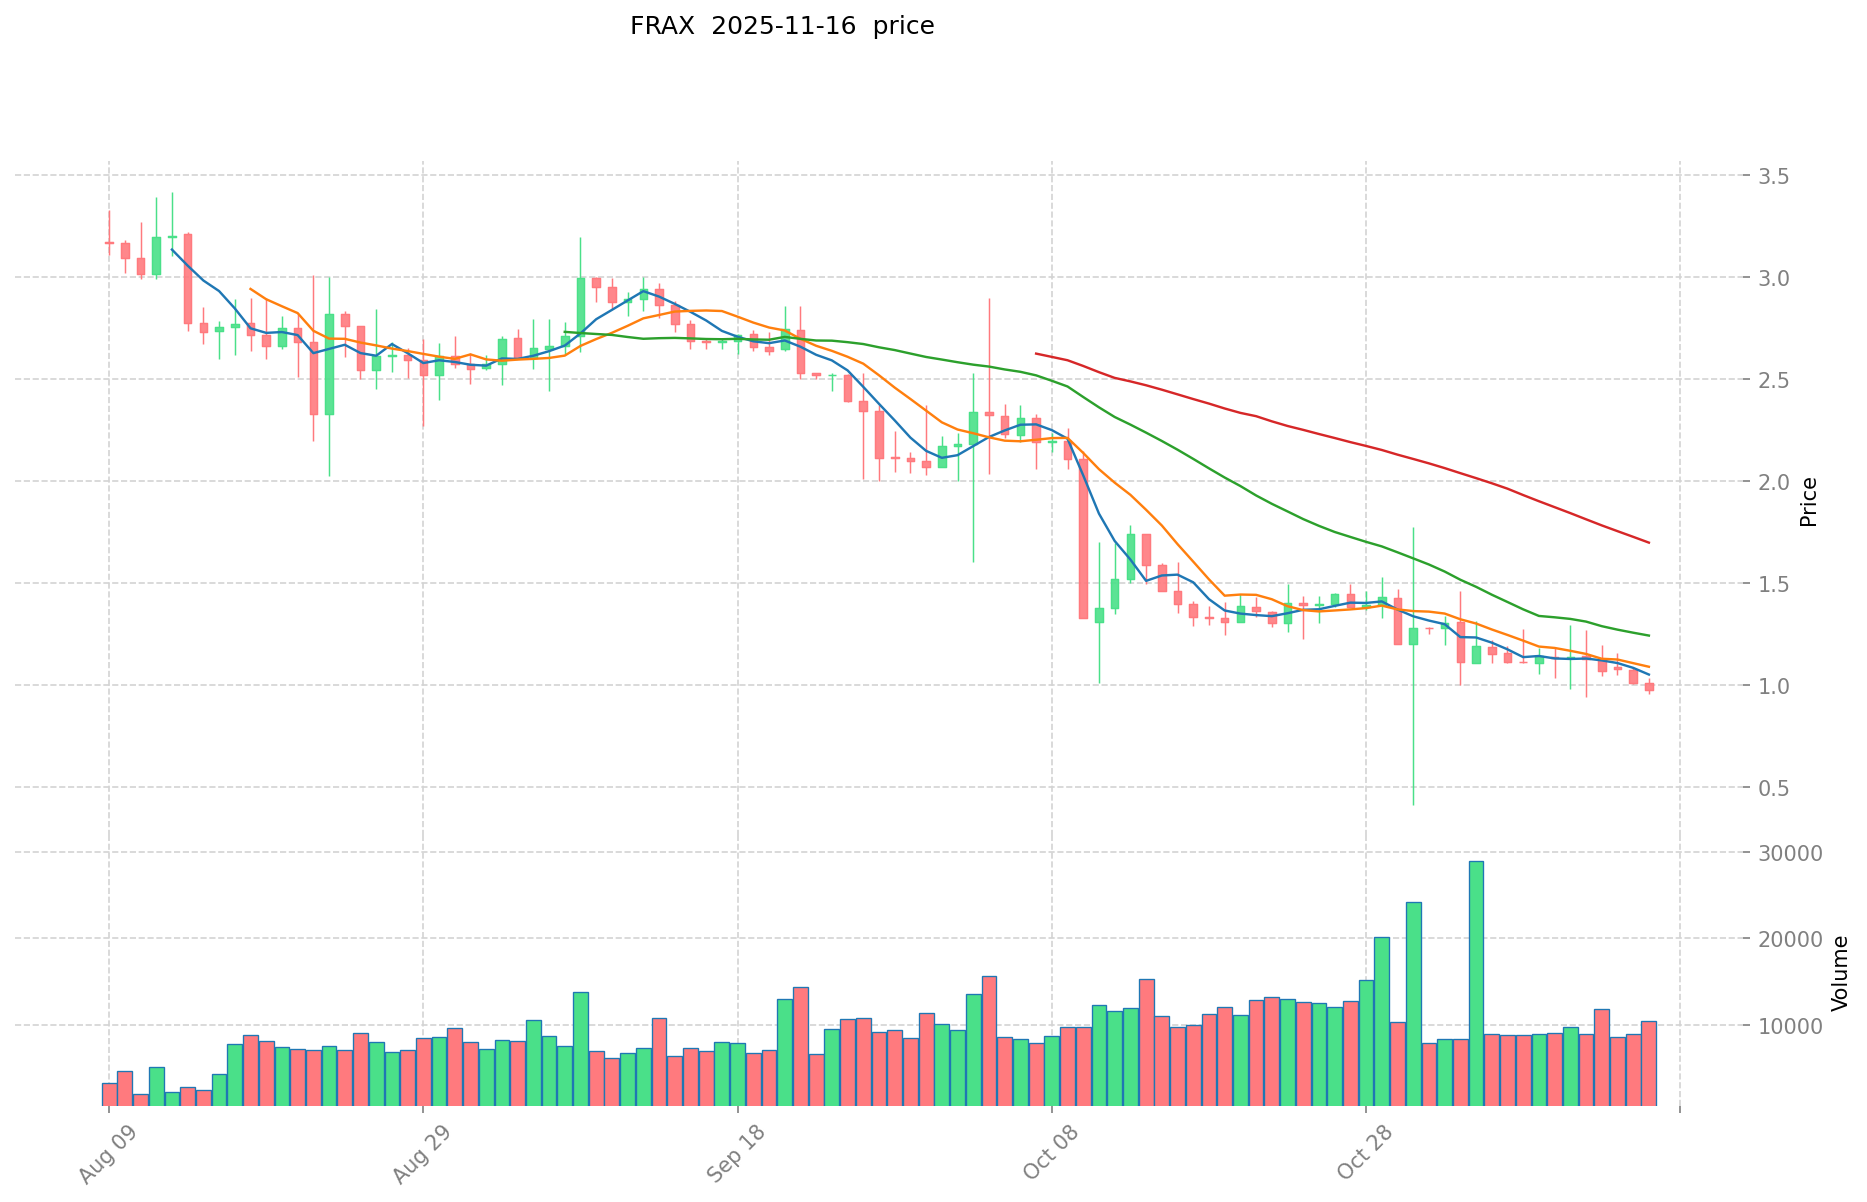
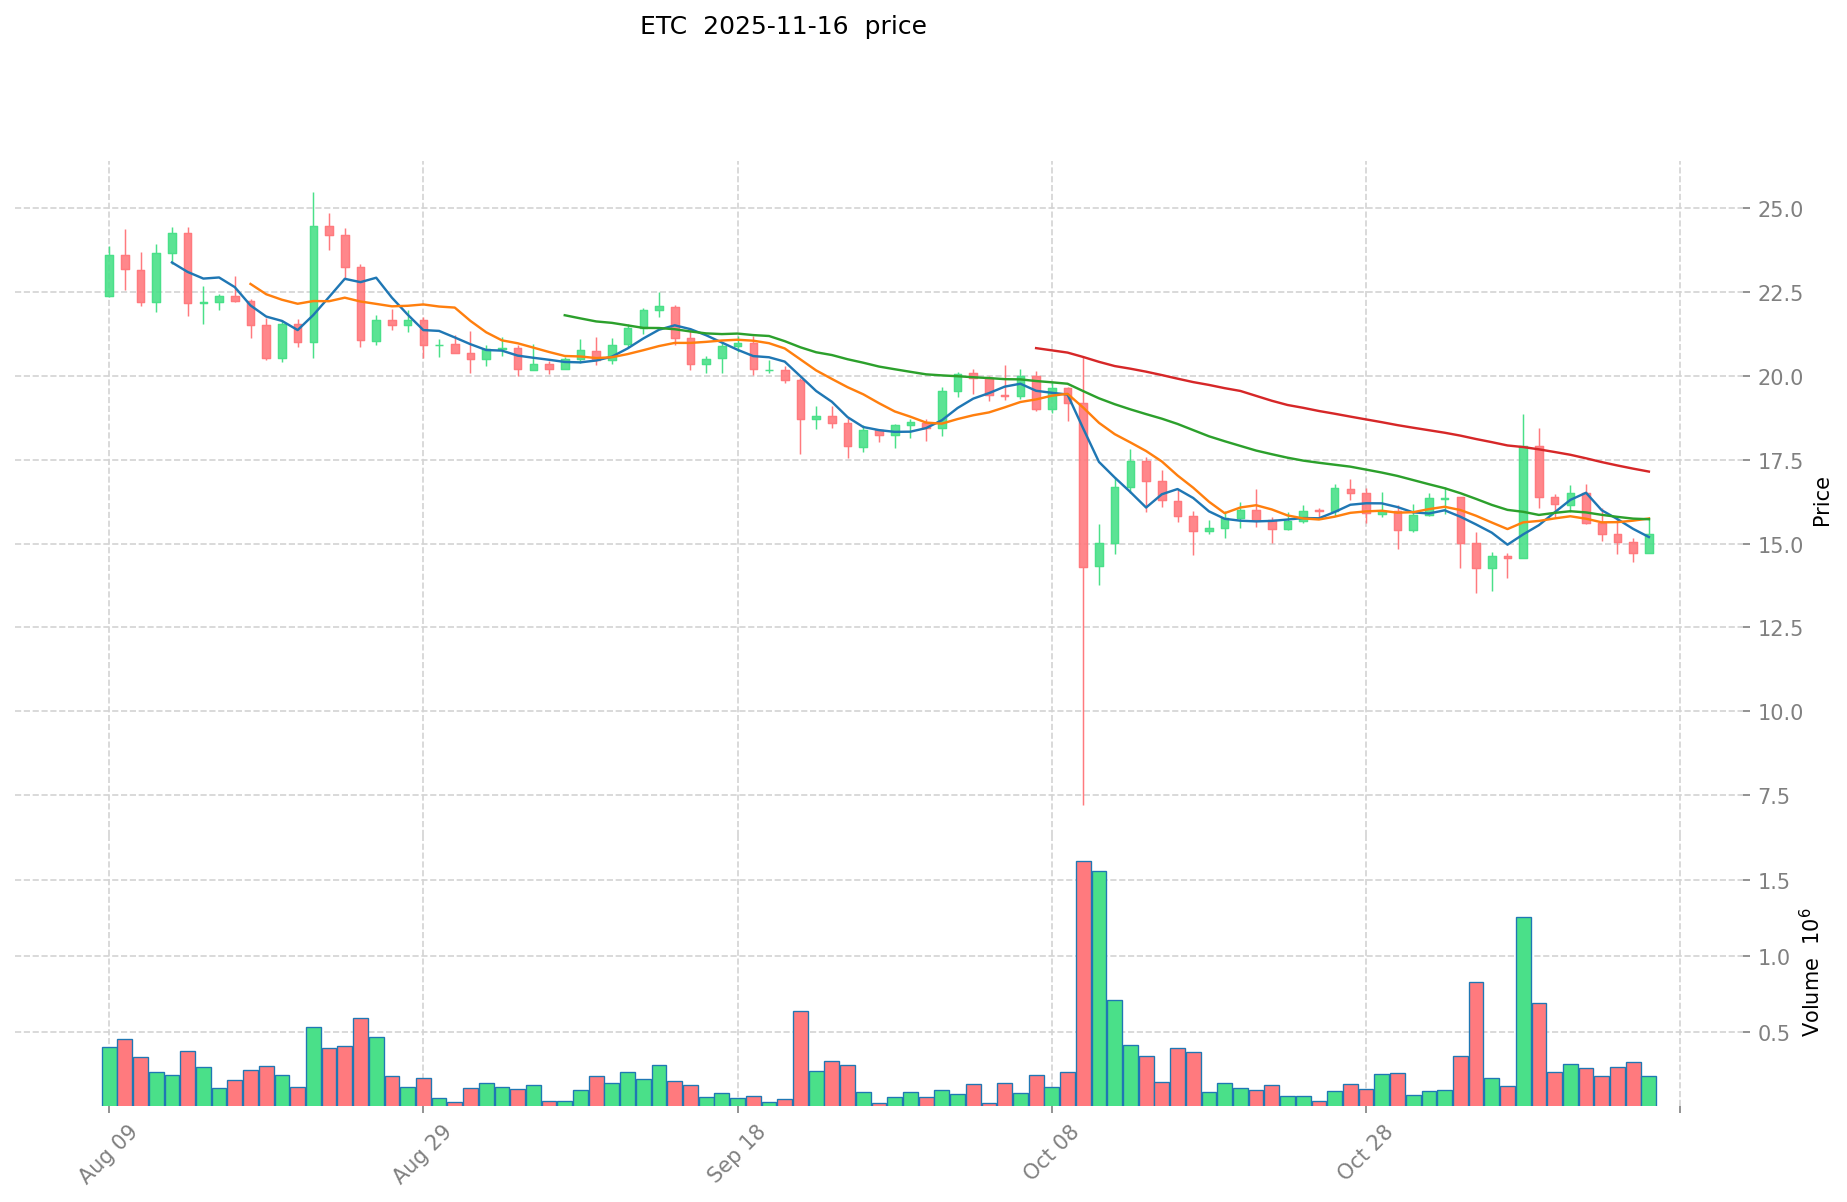
I. Price History Comparison and Current Market Status
FRAX and ETC Historical Price Trends
- 2023: FRAX experienced significant volatility due to market-wide crypto fluctuations.
- 2021: ETC saw a dramatic price surge, reaching its all-time high of $167.09 on May 7, 2021.
- Comparative analysis: During the 2021 bull market, ETC rallied from its previous lows to its all-time high, while FRAX, being a stablecoin, aimed to maintain its peg to the US dollar.
Current Market Situation (2025-11-17)
- FRAX current price: $0.944
- ETC current price: $14.587
- 24-hour trading volume: FRAX $9,735.92 vs ETC $1,922,572.49
- Market Sentiment Index (Fear & Greed Index): 10 (Extreme Fear)
Click to view real-time prices:
- Check FRAX current price Market Price
- Check ETC current price Market Price
II. Core Factors Affecting the Investment Value of FRAX vs ETC
Supply Mechanism Comparison (Tokenomics)
- FRAX: Algorithmic-collateral hybrid stablecoin with fractional reserve backing and a supply that adjusts based on market demand and stability mechanisms
- ETC: Fixed maximum supply of 210.7 million coins with declining block rewards, following a deflationary model similar to Bitcoin
- 📌 Historical pattern: Supply mechanisms drive price cycles differently - FRAX aims for $1 stability while ETC's deflationary model supports potential value appreciation during market demand increases
Institutional Adoption and Market Applications
- Institutional holdings: ETC has gained some institutional interest as a "store of value" asset, while FRAX has attracted DeFi-focused institutions seeking stable infrastructure
- Enterprise adoption: FRAX is primarily used in DeFi protocols for lending, borrowing, and yield farming, while ETC serves more as an alternative investment asset
- Regulatory attitudes: Stablecoins like FRAX face increasing regulatory scrutiny worldwide, while ETC operates under similar regulatory frameworks as other proof-of-work cryptocurrencies
Technical Development and Ecosystem Building
- FRAX technical upgrades: Development of Fraxlend, FraxSwap, and the broader Frax Finance ecosystem supporting stablecoin infrastructure and DeFi applications
- ETC technical development: Maintenance of the original Ethereum vision with proof-of-work consensus and resistance to contentious hard forks
- Ecosystem comparison: FRAX has deeper DeFi integration with cross-chain capabilities and yield-generating applications, while ETC maintains a more focused smart contract platform with emphasis on immutability and security
Macroeconomic Factors and Market Cycles
- Performance in inflationary environments: FRAX aims to maintain stability regardless of inflation, while ETC may potentially act as an inflation hedge similar to other limited-supply cryptocurrencies
- Macroeconomic monetary policy: Interest rates directly impact FRAX's stability mechanisms and yields, while ETC price movement correlates more with general crypto market sentiment
- Geopolitical factors: Cross-border transaction demand benefits FRAX's stability use case, while ETC may see increased interest during periods of financial uncertainty
III. 2025-2030 Price Prediction: FRAX vs ETC
Short-term Prediction (2025)
- FRAX: Conservative $0.69-$0.94 | Optimistic $0.94-$1.05
- ETC: Conservative $11.60-$14.51 | Optimistic $14.51-$15.96
Mid-term Prediction (2027)
- FRAX may enter a growth phase, with estimated prices of $0.74-$1.56
- ETC may enter a consolidation phase, with estimated prices of $13.43-$20.92
- Key drivers: Institutional inflows, ETF developments, ecosystem growth
Long-term Prediction (2030)
- FRAX: Base scenario $0.94-$1.84 | Optimistic scenario $1.84-$2.50
- ETC: Base scenario $16.86-$22.78 | Optimistic scenario $22.78-$32.35
Disclaimer
FRAX:
| 年份 | 预测最高价 | 预测平均价格 | 预测最低价 | 涨跌幅 |
|---|---|---|---|---|
| 2025 | 1.05392 | 0.941 | 0.68693 | 0 |
| 2026 | 1.1670282 | 0.99746 | 0.548603 | 5 |
| 2027 | 1.558431504 | 1.0822441 | 0.735925988 | 14 |
| 2028 | 1.63721887448 | 1.320337802 | 0.83181281526 | 39 |
| 2029 | 2.2033797239776 | 1.47877833824 | 0.9168425697088 | 56 |
| 2030 | 2.503867482307968 | 1.8410790311088 | 0.938950305865488 | 95 |
ETC:
| 年份 | 预测最高价 | 预测平均价格 | 预测最低价 | 涨跌幅 |
|---|---|---|---|---|
| 2025 | 15.9555 | 14.505 | 11.604 | 0 |
| 2026 | 15.9917625 | 15.23025 | 13.40262 | 4 |
| 2027 | 20.918748375 | 15.61100625 | 13.425465375 | 7 |
| 2028 | 19.543418724375 | 18.2648773125 | 14.24660430375 | 25 |
| 2029 | 26.654848705996875 | 18.9041480184375 | 15.312359894934375 | 29 |
| 2030 | 32.346887674348406 | 22.779498362217187 | 16.856828788040718 | 56 |
IV. Investment Strategy Comparison: FRAX vs ETC
Long-term vs Short-term Investment Strategies
- FRAX: Suitable for investors focused on DeFi applications and stable infrastructure
- ETC: Suitable for investors seeking potential value appreciation and blockchain immutability
Risk Management and Asset Allocation
- Conservative investors: FRAX: 70% vs ETC: 30%
- Aggressive investors: FRAX: 40% vs ETC: 60%
- Hedging tools: Stablecoin allocation, options, cross-currency portfolios
V. Potential Risk Comparison
Market Risks
- FRAX: Depegging risk, market-wide stablecoin confidence
- ETC: High volatility, correlation with broader crypto market trends
Technical Risks
- FRAX: Smart contract vulnerabilities, algorithmic stability challenges
- ETC: 51% attack vulnerability, slower adoption of technical upgrades
Regulatory Risks
- Global regulatory policies' differing impacts on stablecoins and proof-of-work cryptocurrencies
VI. Conclusion: Which Is the Better Buy?
📌 Investment Value Summary:
- FRAX advantages: Stability, DeFi integration, yield-generating potential
- ETC advantages: Limited supply, potential store of value, continuation of original Ethereum vision
✅ Investment Advice:
- New investors: Consider FRAX for lower volatility and DeFi exposure
- Experienced investors: Balanced portfolio with both FRAX and ETC based on risk tolerance
- Institutional investors: FRAX for stable infrastructure, ETC for diversification in crypto holdings
⚠️ Risk Warning: Cryptocurrency markets are highly volatile. This article does not constitute investment advice. None
VII. FAQ
Q1: What are the key differences between FRAX and ETC? A: FRAX is a stablecoin designed to maintain a $1 peg, while ETC is a cryptocurrency with a fixed supply. FRAX is primarily used in DeFi applications, while ETC aims to preserve the original Ethereum blockchain principles.
Q2: Which has shown better price performance historically? A: ETC has shown more significant price volatility and potential for appreciation, reaching an all-time high of $167.09 in May 2021. FRAX, as a stablecoin, aims to maintain a consistent value around $1.
Q3: How do their supply mechanisms differ? A: FRAX uses an algorithmic-collateral hybrid model with adjustable supply based on market demand. ETC has a fixed maximum supply of 210.7 million coins with declining block rewards, similar to Bitcoin's deflationary model.
Q4: What are the main use cases for FRAX and ETC? A: FRAX is primarily used in DeFi protocols for lending, borrowing, and yield farming. ETC serves more as an alternative investment asset and a platform for smart contracts emphasizing immutability.
Q5: How do regulatory risks compare between FRAX and ETC? A: Stablecoins like FRAX face increasing regulatory scrutiny worldwide. ETC operates under similar regulatory frameworks as other proof-of-work cryptocurrencies, potentially facing less direct regulatory pressure.
Q6: Which might be a better investment for different types of investors? A: New investors might consider FRAX for lower volatility and DeFi exposure. Experienced investors could balance both in their portfolio. Institutional investors might use FRAX for stable infrastructure and ETC for diversification in crypto holdings.
Q7: What are the long-term price predictions for FRAX and ETC by 2030? A: By 2030, FRAX is predicted to range from $0.94 to $2.50, while ETC is estimated to range from $16.86 to $32.35 in optimistic scenarios. However, these predictions are speculative and subject to market conditions.
Share
Content
Introduction: FRAX vs ETC Investment Comparison
I. Price History Comparison and Current Market Status
II. Core Factors Affecting the Investment Value of FRAX vs ETC
III. 2025-2030 Price Prediction: FRAX vs ETC
IV. Investment Strategy Comparison: FRAX vs ETC
V. Potential Risk Comparison
VI. Conclusion: Which Is the Better Buy?
VII. FAQ

